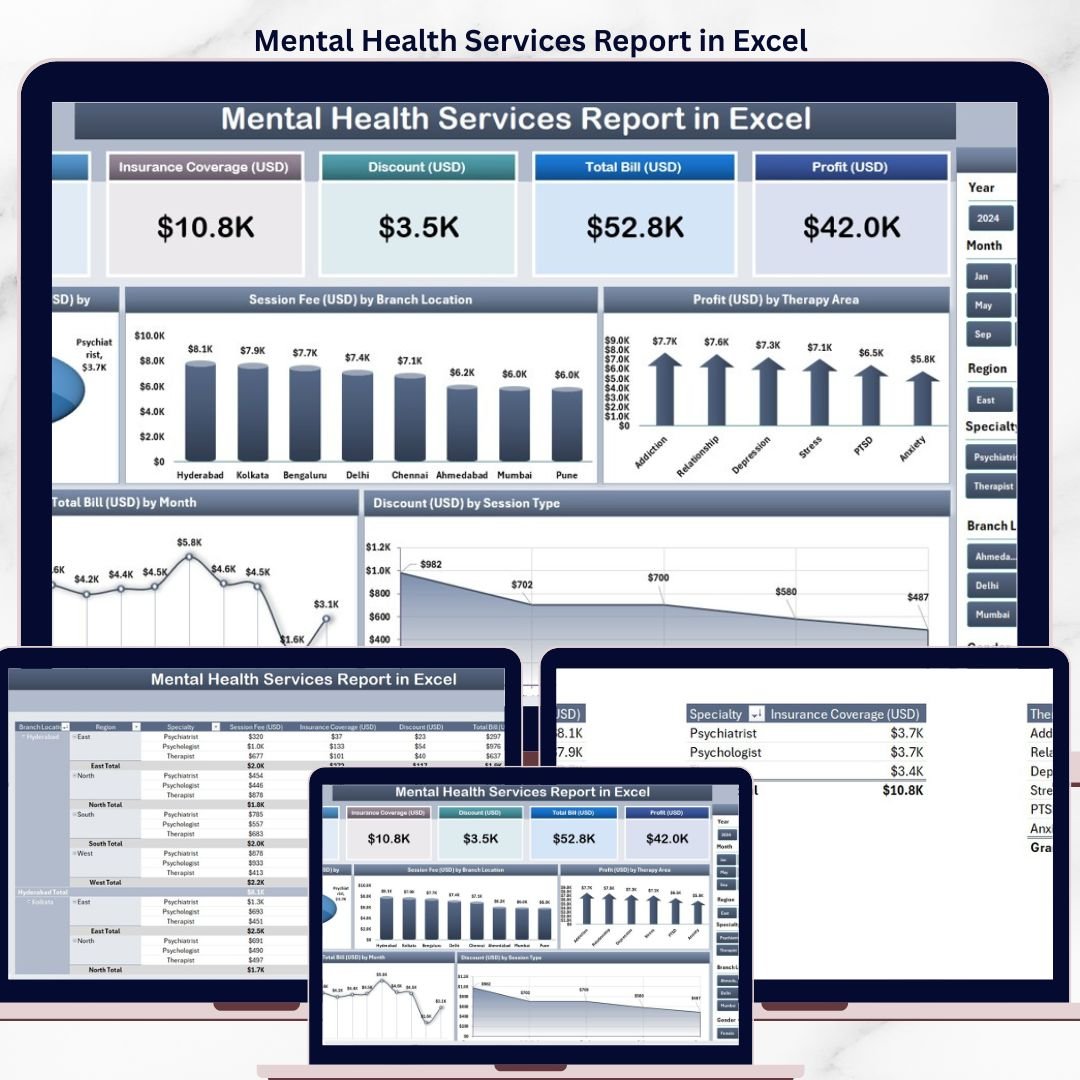
The Mental Health Services Report in Excel tracks 5 core KPIs across 4 structured sheets, with 5 interactive charts covering insurance coverage, session fees, profit, billing trends, and discounts. Setup takes under 10 minutes — replace the sample data and every chart, card, and slicer refreshes automatically through pivot tables.
🌍 Join 8,400+ teams in 40+ countries using NextGenTemplates to replace paid SaaS tools with one-time-purchase Excel, Google Sheets, Power BI, and HTML templates.
✅ Instant download · One-time payment · No subscription · No per-user fees · Lifetime access
Mental Health Services Report in Excel – Summary Page
🔑 Key Features of the Mental Health Services Report
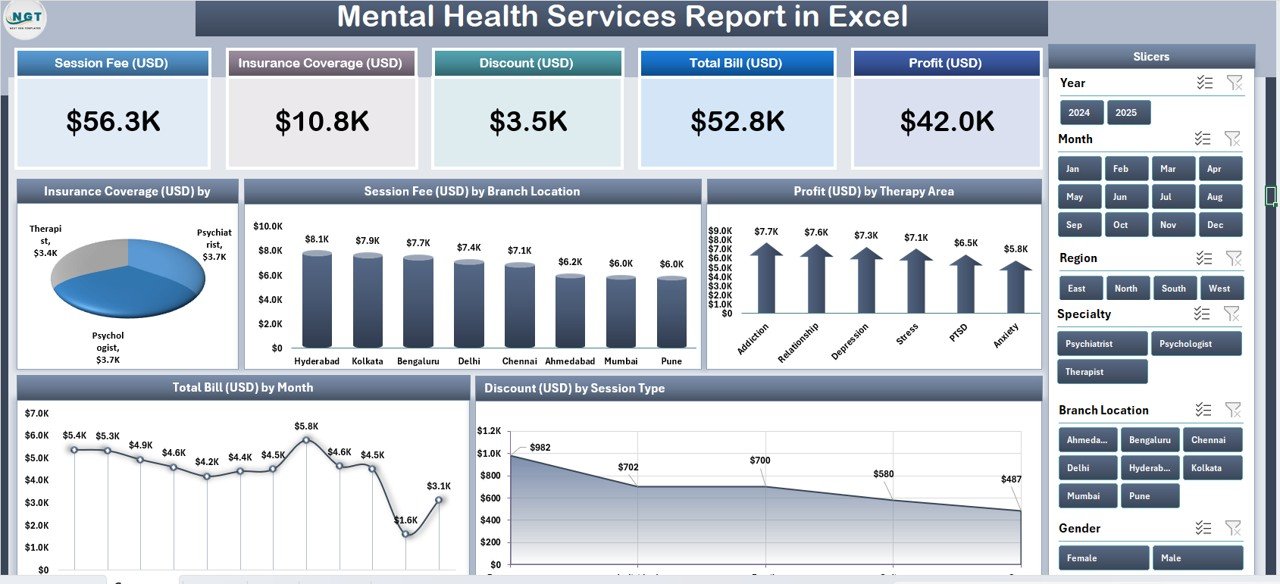
🔹 Five-KPI Summary Page – The top of the Summary Page displays 5 card-style KPIs giving leadership an instant snapshot of clinic performance, while a right-side slicer panel lets you filter the entire report by therapy area, branch, session type, or period.
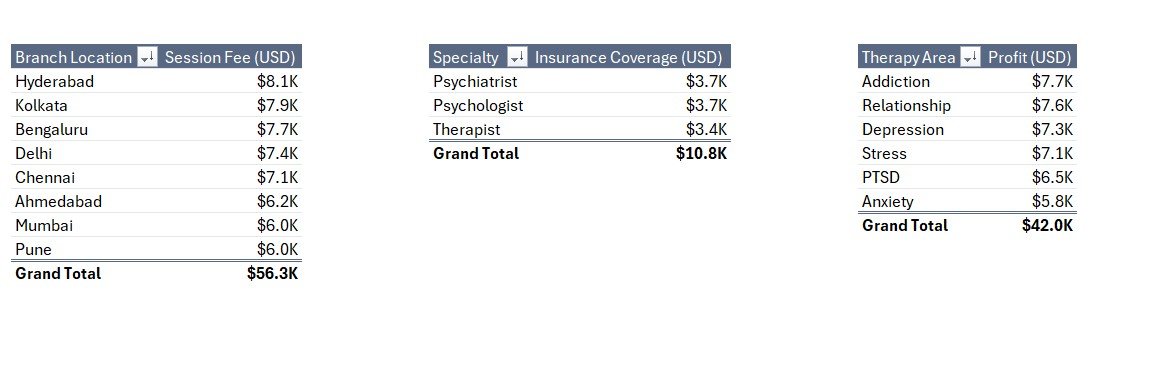
🔹 Insurance Coverage by Speciality – A dedicated chart shows which specialities (Anxiety, Depression, PTSD, Addiction, Family Therapy, etc.) generate the most insurance-reimbursed revenue, so billing teams can spot under-coded or under-contracted specialities in seconds.
🔹 Session Fee by Branch Location – Compare average session fees across every clinic branch. Multi-location practices use this to benchmark pricing, detect outliers, and re-negotiate rates with insurance payers at under-performing locations.
🔹 Profit by Therapy Area – Groups net profit by therapy area (CBT, DBT, EMDR, Group, Family, etc.) so clinic owners know exactly which service lines pay for themselves and which ones need a pricing or caseload review.
🔹 Total Bill by Month – A 12-month trend view of total billed amount, useful for cash-flow forecasting, spotting seasonal dips, and measuring the ROI of marketing campaigns or new hires.
🔹 Discount by Session Type – Breaks down discounts granted across Individual, Couple, Group, Family, and Telehealth sessions, giving practice managers hard data on where write-offs concentrate.
🔹 Detailed Report Page with Information Table – A separate Report Page includes a left-side slicer and a line-item table — useful for auditing individual sessions, preparing insurance claim packets, or reviewing per-patient billing.
🔹 100% Pivot-Table Driven – The Support sheet holds every pivot table that feeds the dashboard. Update one cell in the Data sheet, hit Refresh All, and every card, chart, and slicer updates automatically — no formula edits required.
🔹 Works offline on Windows and Mac Excel – No internet, no cloud, no subscription. Patient-level data never leaves your machine, which matters for HIPAA-adjacent workflows.
📦 What’s Inside the Mental Health Services Report
The file includes 4 Excel sheets, each with a specific purpose in the reporting workflow.
1. Summary Page — The main dashboard view. At the top, 5 KPI cards display headline metrics at a glance. The right-side slicer panel filters the entire page by therapy area, branch, session type, and time period. Five charts cover the core analytical questions: Insurance Coverage by Speciality, Session Fee by Branch Location, Profit by Therapy Area, Total Bill by Month, and Discount by Session Type.
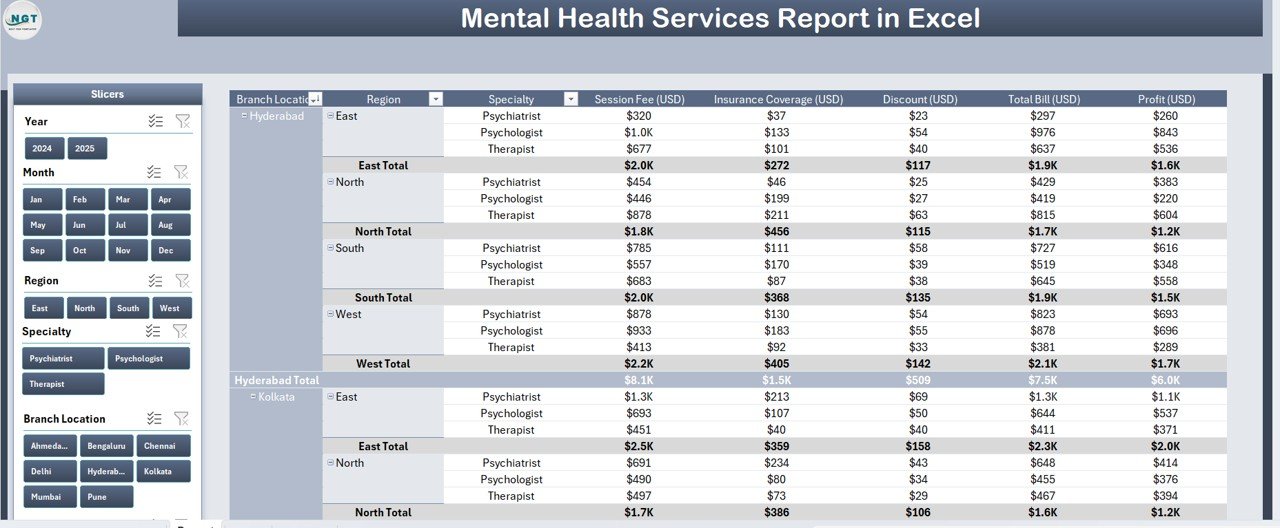
Report Page with slicer and information table
2. Report Page — A left-side slicer drives a detailed information table with transaction-level records. Use this page to pull session-level lists for insurance audits, patient invoicing, or month-end reconciliation.
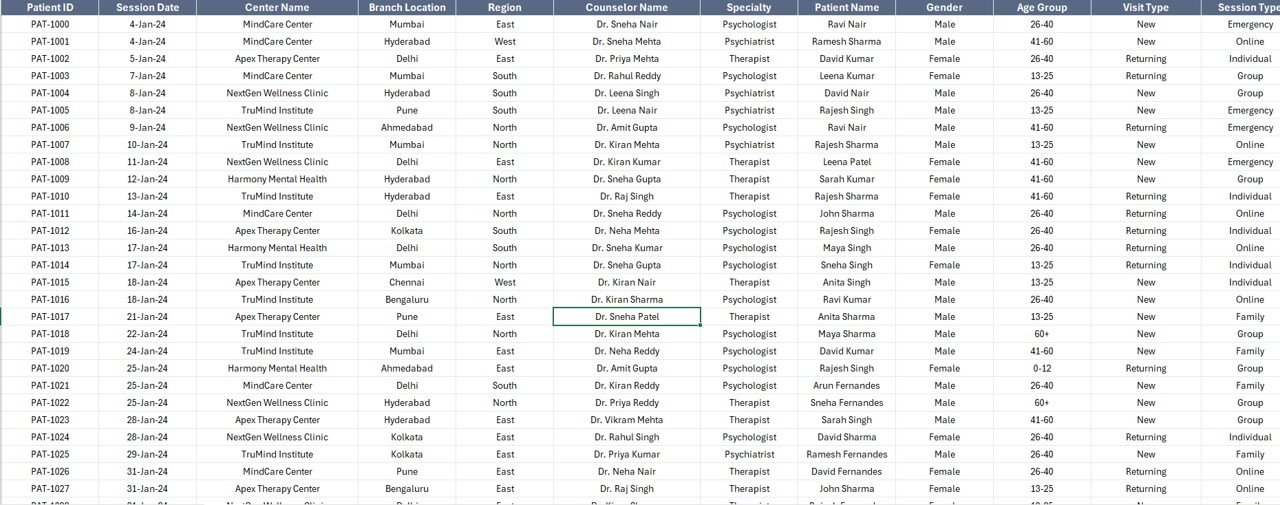
Data Sheet – replace sample data here
3. Data Sheet — The raw input sheet. Paste your session-level data into the same column structure (Date, Branch, Therapy Area, Session Type, Speciality, Therapist, Session Fee, Discount, Total Bill, Insurance Coverage). Keep the headers identical — the pivot tables depend on them.
Support Sheet with pivot tables driving every chart
4. Support Sheet — Holds every pivot table that feeds the Summary Page charts and cards. After updating the Data sheet, click Data → Refresh All in the Excel ribbon and every pivot recalculates. Keep this sheet hidden in production — your team only needs to see the Summary Page and Report Page.
📊 Mental Health Services Report in Excel vs. Google Sheets Equivalent vs. SimplePractice / TherapyNotes — Where This Fits
| Feature | Mental Health Services Report in Excel | Google Sheets equivalent | SimplePractice / TherapyNotes |
|---|---|---|---|
| Cost | $7.99 one-time | ~$10 one-time template | $49–$99 / user / month |
| Platform | Microsoft Excel (desktop) | Google Sheets (browser) | Web + mobile SaaS |
| Works offline | ✅ Yes | ❌ Requires internet | ❌ Requires internet |
| Setup time | Under 10 minutes | ~15 minutes | 2–5 days onboarding |
| Customizable KPIs & charts | ✅ Fully editable | ✅ Editable | ❌ Fixed reports |
| Per-user licence fees | None — share freely | None | $49+ per clinician / month |
| Data stays on your device | ✅ Yes | ❌ Cloud (Google servers) | ❌ Vendor cloud |
| Year-1 cost at 5 clinicians | $7.99 | ~$10 | $2,940 – $5,940 |
| Insurance & branch breakdown | ✅ Pre-built | Needs rebuild | ✅ Pre-built |
For clinics that want insurance, branch, and therapy-area profitability visibility without paying $3,000+ per year in SaaS fees, the Mental Health Services Report in Excel sits in the sweet spot.
👥 Who This Template Is For — and Who It’s Not For
✅ This template is built for:
- Solo therapists and counsellors who bill insurance and private-pay and want one clean monthly report
- Group practices (2–20 clinicians) running multiple branches or specialities who need cross-branch comparisons
- Practice managers preparing month-end reports for clinic owners or investors
- Billing teams reconciling insurance coverage against session fees across specialities
- New clinic owners who haven’t committed to a $3K-a-year SaaS platform yet
❌ This template is NOT for:
- Hospital-scale behavioural health networks needing HIPAA-certified cloud infrastructure with audit logs and SSO
- Clinics that need integrated e-prescribing, telehealth video, and patient portal in one system (use SimplePractice)
- Teams without a basic Microsoft Excel licence or anyone who only uses Google Sheets (grab the Google Sheets version if we release one)
⚙️ How to Use the Mental Health Services Report
- Download and open the .xlsx file in Microsoft Excel 2016 or later, on Windows or Mac.
- Go to the Data sheet and replace the sample rows with your clinic’s session-level data. Keep all column headers identical.
- Click Data → Refresh All in the Excel ribbon. Every pivot table in the Support sheet recalculates.
- Open the Summary Page. All 5 KPI cards and 5 charts now reflect your data. Use the right-side slicer to filter by therapy area, branch, or session type.
- Switch to the Report Page to pull filtered line-item views for insurance claims, audits, or patient invoicing.
- Hide the Support sheet before sharing the file with clinicians — they only need to see the Summary and Report pages.
💼 Real-World Use Cases
Dr. Meera runs a 4-therapist counselling practice in Mumbai. She uses the Mental Health Services Report each month to review which specialities (Anxiety, Depression, PTSD) are the most profitable, then shifts her marketing spend toward the top two. The insurance-coverage-by-speciality chart helped her spot that her addiction-therapy codes were being under-reimbursed — she renegotiated and recovered an estimated ₹65,000 per quarter.
James is a practice manager at a 3-branch group therapy clinic in Toronto. He uses the Session Fee by Branch Location chart to compare average fees across his downtown, suburban, and virtual branches. After spotting a $22 gap at the suburban branch, he standardized pricing and lifted monthly revenue by roughly $4,800 — all without paying SimplePractice’s $588-per-clinician annual fee.
Priya is a freelance therapist starting her own private practice. She needs month-end reports for her accountant but can’t justify $49/month for SaaS yet. The Mental Health Services Report gives her the Total Bill by Month and Discount by Session Type charts she needs, runs entirely offline on her Mac, and cost her $7.99 once.
❓ Frequently Asked Questions
What KPIs does the Mental Health Services Report in Excel track?
The Mental Health Services Report tracks 5 headline KPIs on the Summary Page — shown as card visuals — plus 5 interactive charts covering Insurance Coverage by Speciality, Session Fee by Branch Location, Profit by Therapy Area, Total Bill by Month, and Discount by Session Type. All metrics auto-update when you refresh the pivot tables.
How does this compare to SimplePractice or TherapyNotes?
SimplePractice and TherapyNotes charge $49–$99 per clinician per month — roughly $588 to $1,188 per clinician per year. The Mental Health Services Report in Excel is a $7.99 one-time purchase with no per-user fees, works offline, and keeps patient data on your device rather than in a vendor cloud.
How long does setup take?
Setup takes under 10 minutes. Open the .xlsx file, paste your session-level data into the Data sheet (keep the column headers identical), then click Data → Refresh All. Every card, chart, and slicer on the Summary Page updates automatically. No formulas to edit.
Does this template work on Mac Excel?
Yes. The Mental Health Services Report in Excel is built entirely with pivot tables and slicers — no VBA, no macros — so it runs identically on Windows Excel and Mac Excel 2016 or later. No internet connection is required.
Can I add my own therapy areas or branches?
Yes. Add new therapy areas, branches, session types, or specialities to the Data sheet. After adding rows, click Data → Refresh All in the ribbon and every pivot table on the Support sheet will pick up the new categories and populate the Summary Page charts automatically.
Is patient data safe with this template?
Data stays on your device. The Mental Health Services Report in Excel doesn’t connect to any cloud service, API, or external database. For full HIPAA or PIPEDA compliance you’ll still need to encrypt the file and control access — but unlike SaaS tools, no third party can see your data.
Can I share the report with my team?
Yes. Email the .xlsx file or share it via OneDrive, Dropbox, or SharePoint. There’s no per-user licence — clinicians and billing staff can open and filter the report freely with any Microsoft Excel installation.
👤 About the Author
Built by PK — Microsoft Certified Professional with 15+ years of Excel, Google Sheets, and Power BI experience. Founder of NextGenTemplates, reaching 300K+ subscribers across YouTube channels (@PK-AnExcelExpert, @NextGenTemplates, @NeoTechNavigators). Every template is hand-built and tested before release.
🔗 Explore Related Templates
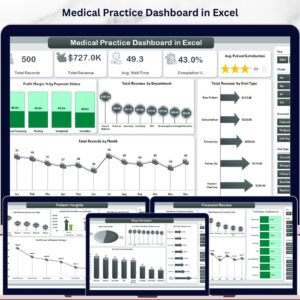
🔹 Medical Practice Dashboard in Excel — The general-medical sibling of this report, covering appointments, revenue, and patient mix.
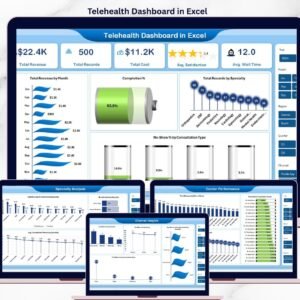
🔹 Telehealth Dashboard in Excel — If you run remote therapy sessions, this template tracks virtual visit volumes, connection quality, and no-show rates.
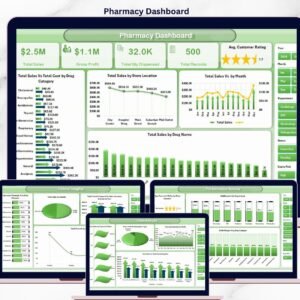
🔹 Pharmacy Dashboard in Excel — A companion for psychiatry practices that also dispense or coordinate medications.
🔹 Hospital Patient Flow Dashboard in Google Sheets — If your team prefers Google Sheets, this is a good alternative for patient-flow visibility.
Also browse all our Excel Dashboard Templates for more industry-specific reports.
📖 Click here to read the Detailed Blog Post
🎥 Visit our YouTube channel for step-by-step video tutorials
👉 YouTube.com/@NextGenTemplates
📅 Last updated: April 2026


Reviews
There are no reviews yet.