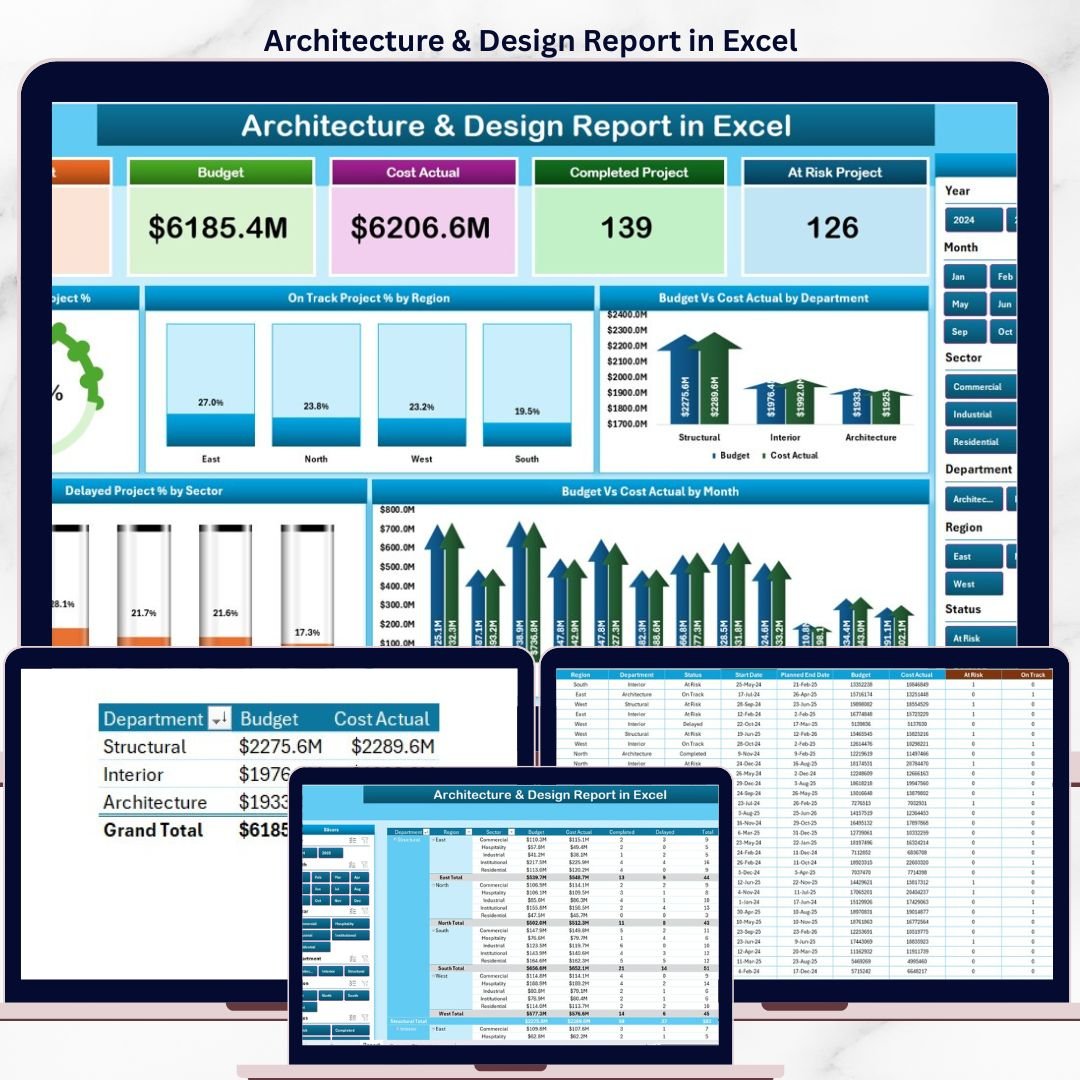

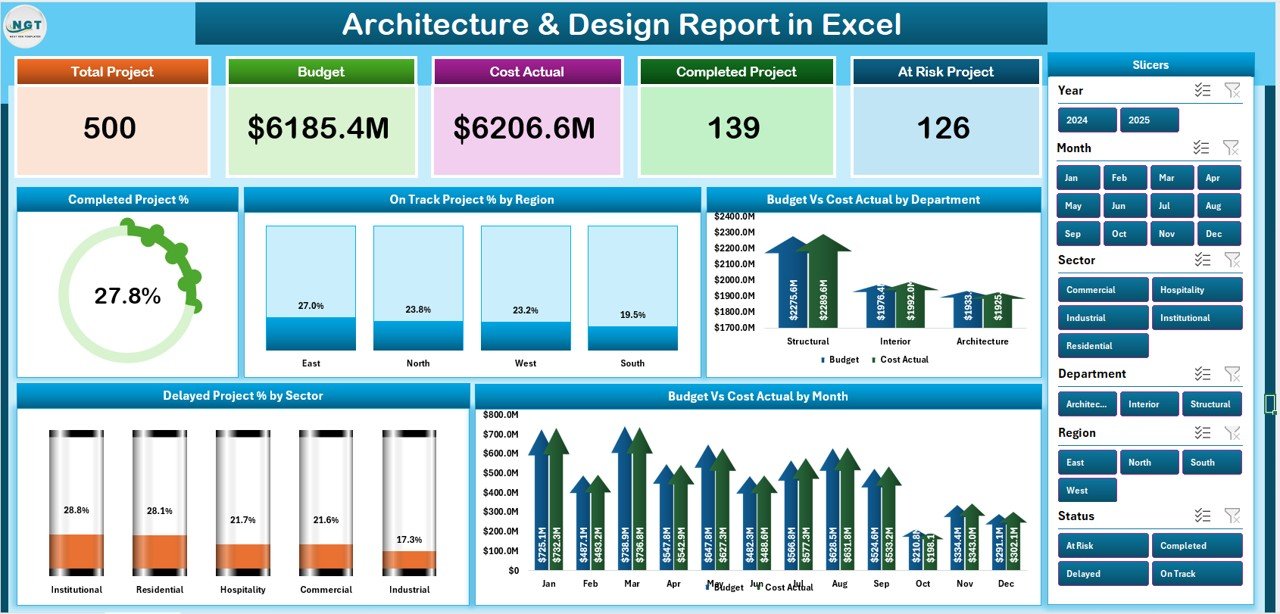
The Architecture & Design Report in Excel tracks 5 KPI cards and 5 interactive charts across 4 sheets, covering Completed Project %, On Track Project % by Region, Budget vs Cost Actual by Department, Delayed Project % by Sector, and Budget vs Cost Actual by Month. Setup takes under 10 minutes — replace the sample data and the entire report refreshes automatically.
🌍 Join 8,400+ teams in 40+ countries using NextGenTemplates to replace paid SaaS tools with one-time-purchase Excel, Google Sheets, Power BI, and HTML templates.
✅ Instant download · One-time payment · No subscription · No per-user fees · Lifetime access
Architecture & Design Report in Excel — Summary Page
🔑 Key Features
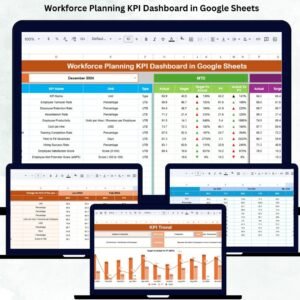
📊 5 KPI cards on the Summary page — Completed Project %, On Track Project %, Delayed Project %, Total Budget, and Total Actual Cost — refresh automatically when new project data is added to the Data sheet.
🎯 Right-side slicer on Summary, left-side slicer on Report page — filter every chart and KPI by region, department, sector, or month with one click. No formula edits needed.
📈 5 pre-built analysis charts — Completed Project %, On Track Project % by Region, Budget vs Cost Actual by Department, Delayed Project % by Sector, and Budget vs Cost Actual by Month. All wired to the slicer.
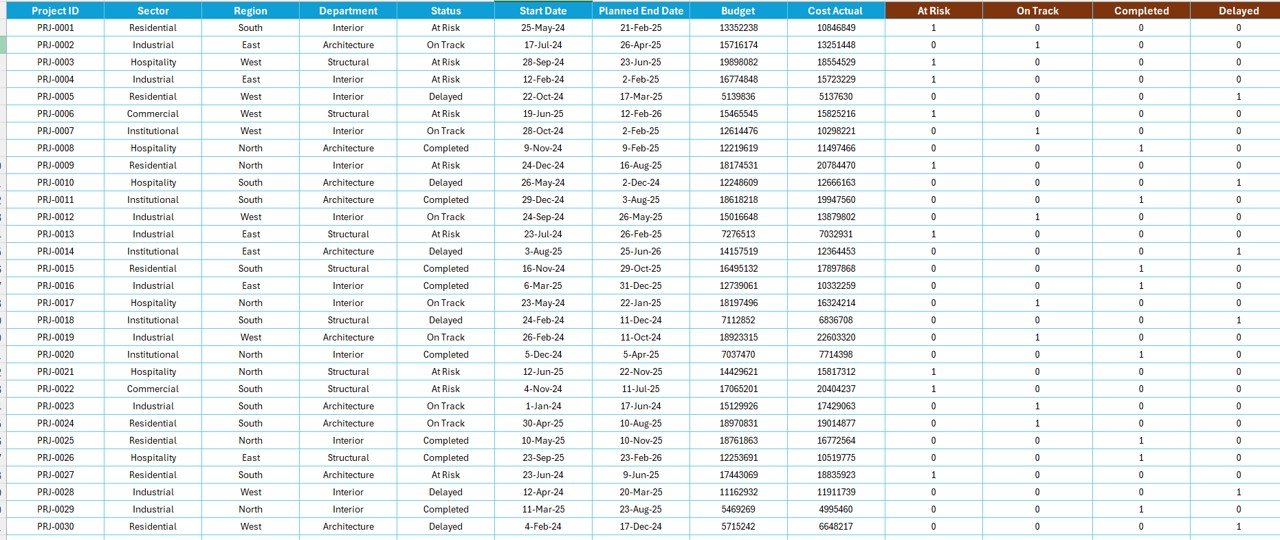
📋 Information Table on the Report page — drill into individual project records with full project metadata, status, budget, and actual cost in a sortable view.
💯 100% formula and pivot-table driven — no macros, no VBA. Works on Excel for Windows, Mac, and the web.
📦 What’s Inside
The file contains 4 sheets — 2 visible report pages and 2 worker sheets that drive the calculations.
Sheet 1 — Summary Page: 5 KPI cards across the top, a right-side slicer, and 5 charts visualizing project status %, budget vs cost actuals, and breakdowns by region, department, sector, and month.

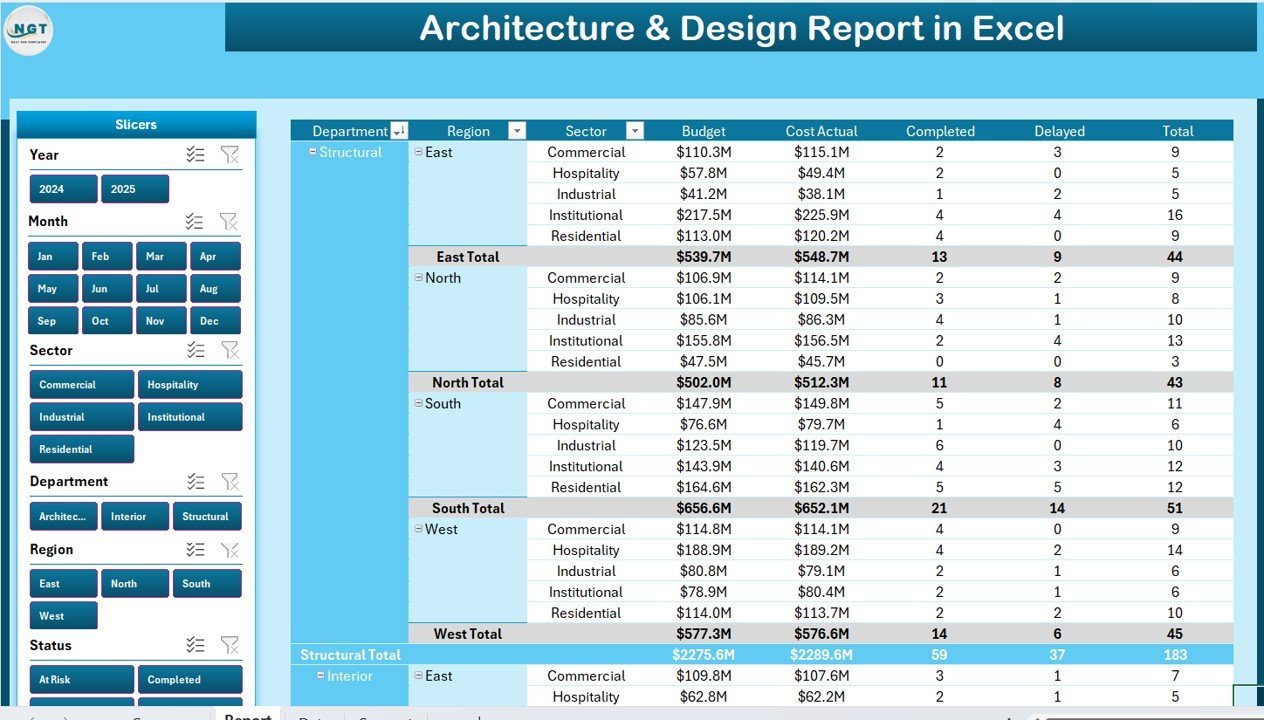
Report Page — Left-side Slicer with detailed Information Table
Sheet 2 — Report Page: A line-by-line view of every project. The left-side slicer filters by region, sector, department, or status. The Information Table shows each project’s key fields — useful for project review meetings and client presentations.
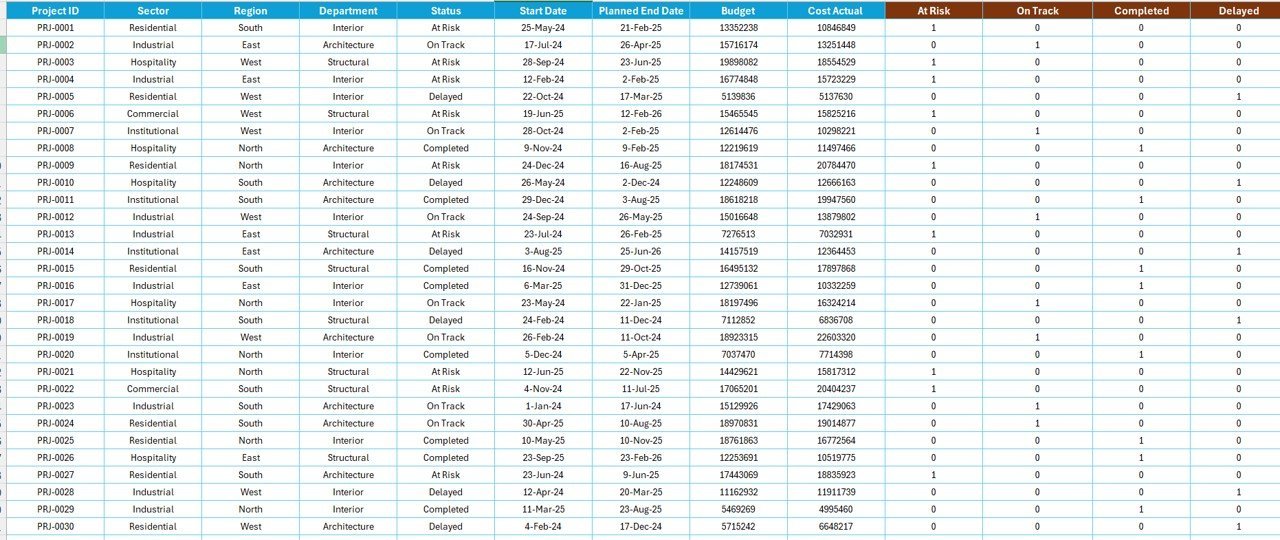
Data Sheet — Single source of truth for all project records
Sheet 3 — Data Sheet: Add or paste your architecture project records here. Required fields include Project ID, Project Name, Region, Sector, Department, Start Date, End Date, Status, Budget, and Actual Cost.

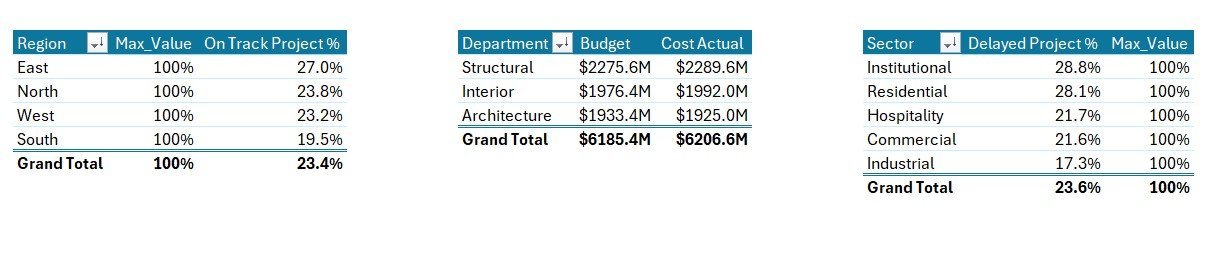
Support Sheet — Pivot tables that power the report
Sheet 4 — Support Sheet: Houses the pivot tables that aggregate Data sheet records into the metrics shown on the Summary and Report pages. After updating data, click Data → Refresh All in the Excel ribbon — every chart and KPI updates in seconds. Keep this sheet hidden in client-facing copies.
📊 Architecture & Design Report vs. Google Sheets vs. Paid PM SaaS
| Feature | Architecture & Design Report (Excel) | Google Sheets Equivalent | Asana / Monday.com / Smartsheet |
|---|---|---|---|
| Cost | $7.99 one-time | $5–$10 one-time | $10.99–$24 / user / month |
| Platform | ✅ Excel (offline + online) | Google Sheets (cloud only) | Cloud SaaS subscription |
| Setup time | ✅ Under 10 minutes | Under 10 minutes | 2–4 weeks of admin setup |
| Slicer-based filtering | ✅ Native Excel slicers | Filter views | Filter UI varies by plan |
| Offline access | ✅ Yes — full functionality | Read-only offline | No — requires internet |
| Year-1 cost at 5 users | $7.99 total | ~$10 total | $660–$1,440 |
| License model | ✅ One-time, lifetime use | One-time | Per-user subscription |
For architecture firms that want a clean, executive-ready project report without paying $1,440 a year for SaaS, this template sits in the sweet spot.
👥 Who This Template Is For — and Who It’s Not For
✅ Built for:
- Architecture firm partners and project leads tracking 10–200 active design and construction projects
- Design studio operations managers reporting weekly project status to clients and senior leadership
- Construction project managers monitoring budget vs actual cost across regions, sectors, and departments
- Independent architects and small firms that want a professional report without paying for project management SaaS
❌ NOT for:
- Enterprise teams needing real-time collaboration across 50+ users with role-based permissions
- Firms that require BIM integration, CAD file linking, or 3D model tracking inside the report
- Project teams that need automatic time-tracking, billing, or invoicing inside the same tool
⚙️ How to Use
- Download and open the file in Microsoft Excel (Windows, Mac, or web).
- Go to the Data sheet and replace the sample records with your firm’s actual project data, keeping the same column structure.
- Click Data → Refresh All in the Excel ribbon. Every pivot, chart, KPI, and slicer updates automatically.
- Open the Summary page and use the right-side slicer to filter by region, sector, department, or status.
- Open the Report page for a line-by-line view with the left-side slicer and Information Table.
- Hide the Support sheet before sharing the file with clients.
💼 Real-World Use Cases
Maria runs a 25-architect studio in Madrid. She uses the report to prepare a monthly project review for her partners — slicing the Summary page by region (Spain, Portugal, France) and by sector (residential, commercial, hospitality) to spot which markets are over- or under-running on budget. She replaced a $1,200/year Smartsheet subscription with this one-time purchase.
James is a project manager at a mid-sized construction firm in Toronto. He uses the Report page slicer to drill into delayed projects every Monday morning, then exports the filtered Information Table to PDF for the operations stand-up. He doesn’t need real-time collaboration — he needs a fast, clean view that he controls.
Aditi is a design lead at a real estate developer in Mumbai. She tracks 30+ architectural projects across India and the UAE. The Budget vs Cost Actual by Department chart is her go-to view for the quarterly leadership review.
❓ Frequently Asked Questions
What KPIs does this report track?
The Architecture & Design Report in Excel tracks 5 headline KPIs — Completed Project %, On Track Project %, Delayed Project %, Total Budget, and Total Actual Cost — plus 5 analysis charts covering region, department, sector, and monthly performance.
How does this compare to Asana or Monday.com?
Asana and Monday.com cost $10.99–$24 per user per month, totalling $660–$1,440 a year for a 5-person team. This Excel report is a one-time $7.99 purchase, works fully offline, and gives you complete control over your data — ideal for firms that want a clean executive report without ongoing SaaS bills.
Does it work on Mac?
Yes. The report is 100% formula and pivot-table driven with no macros or VBA, so it works identically on Excel for Windows, Excel for Mac, and Excel on the web. Native slicers are supported across all three platforms.
How long does setup take?
Under 10 minutes. Replace the sample data on the Data sheet with your project records, click Data → Refresh All, and the entire report rebuilds automatically. No formulas to edit, no charts to reconfigure, no slicer rewiring.
Can I customize this template?
Yes. Every element is fully editable — change colours, add columns, rename slicers, add new KPIs, or swap chart types. It uses standard Excel pivot tables, so any Excel user can adapt it to a different design or construction reporting workflow.
Will I get future updates?
Yes. Every NextGenTemplates purchase includes lifetime access to the latest version. You can re-download from your account anytime. There is no subscription, no expiry, and no usage cap.
👤 About the Author
Built by PK — Microsoft Certified Professional with 15+ years of Excel, Google Sheets, and Power BI experience. Founder of NextGenTemplates, reaching 300K+ subscribers across YouTube channels (@PK-AnExcelExpert, @NextGenTemplates, @NeoTechNavigators). Every template is hand-built and tested before release.
🔗 Explore Related Templates
📋 Emergency Management Report in Excel — same slicer-driven Excel Report format for crisis and incident reporting.
🔬 Research Institutions Report in Excel — Report-style template for academic and research institution reporting.
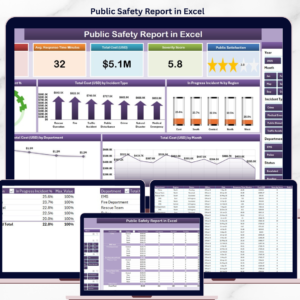
🚨 Public Safety Report in Excel — slicer-based template for public safety and government departments.
🏗️ Construction Project Timeline in Google Sheets — Gantt-style timeline view for construction project schedules.
Browse the full Excel Dashboard Templates library or explore the Google Sheets Dashboards collection for cloud alternatives.
📖 Click here to read the Detailed Blog Post
🎥 Visit our YouTube channel for step-by-step video tutorials
👉 YouTube.com/@NextGenTemplates
📅 Last updated: May 2026


Reviews
There are no reviews yet.