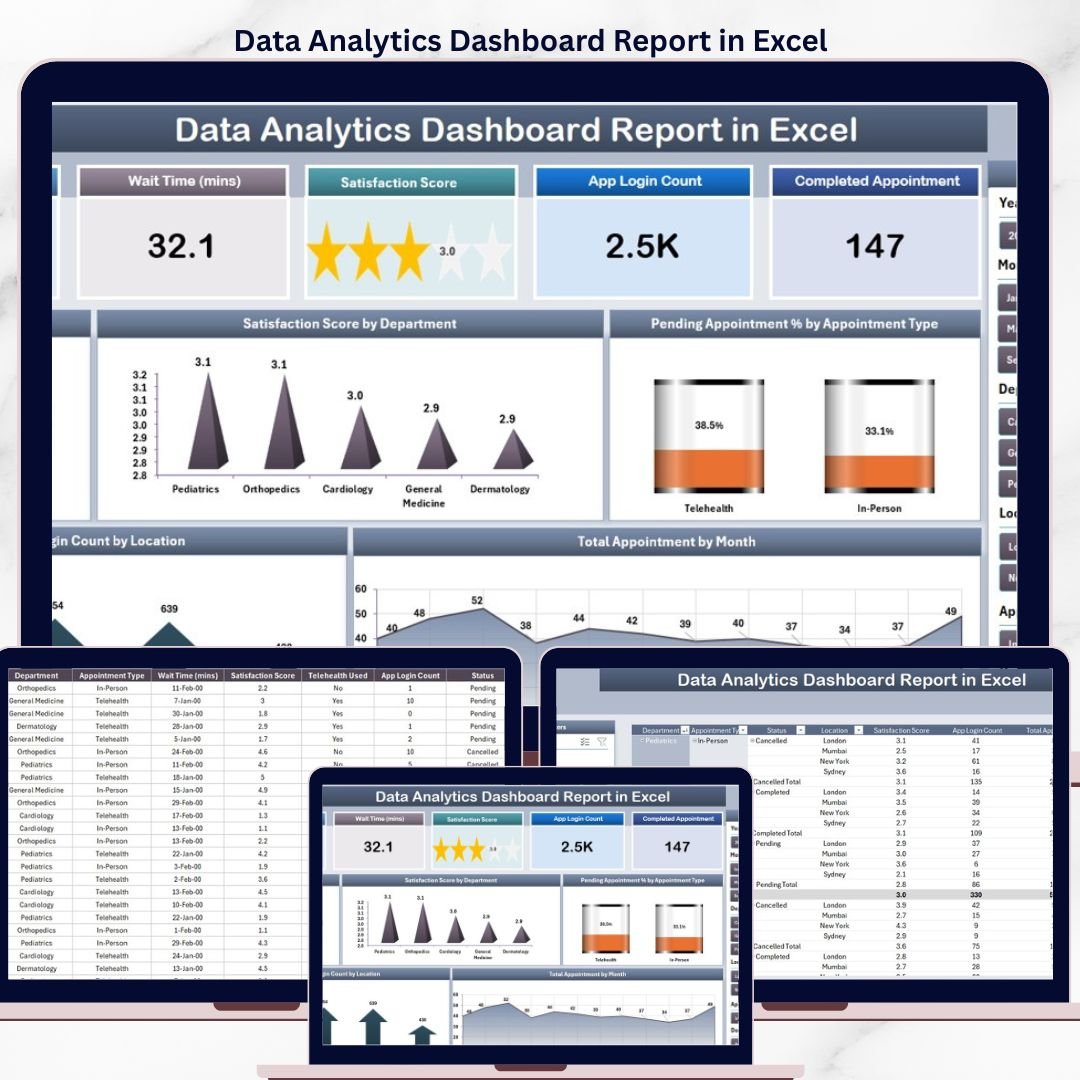
The Data Analytics Dashboard Report in Excel tracks 5 appointment KPIs across 4 worksheets, with 5 interactive charts, a right-side slicer on the Summary page, and a filtered Information Table on the Report page. Setup takes under 10 minutes — replace the sample appointment log with your own data, click Refresh All, and every card, chart, and pivot rebuilds automatically.
🌍 Join 8,400+ teams in 40+ countries using NextGenTemplates to replace paid SaaS tools with one-time-purchase Excel, Google Sheets, Power BI, and HTML templates.
✅ Instant download · One-time payment · No subscription · No per-user fees · Lifetime access
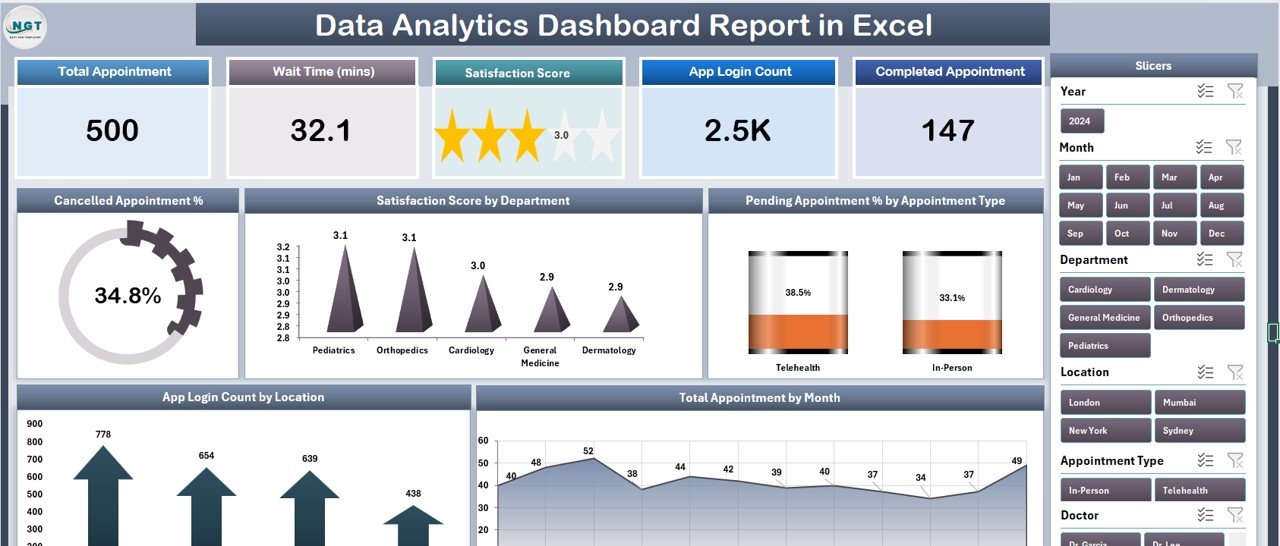
Summary page — 5 KPI cards, right-side slicer, and 5 analysis charts
🔑 Key Features of the Data Analytics Dashboard Report in Excel
This 4-worksheet report is engineered for appointment-driven operations — clinics, salons, customer-success teams, service desks — where weekly KPI reviews need to happen in Excel.
🔹 5 KPI cards plus a right-side slicer on the Summary page filter every card and chart by Department, Location, or Appointment Type with one click.
🔹 5 analysis charts — Cancelled Appointment %, Satisfaction Score by Department, Pending Appointment % by Appointment Type, App Login Count by Location, Total Appointment by Month.
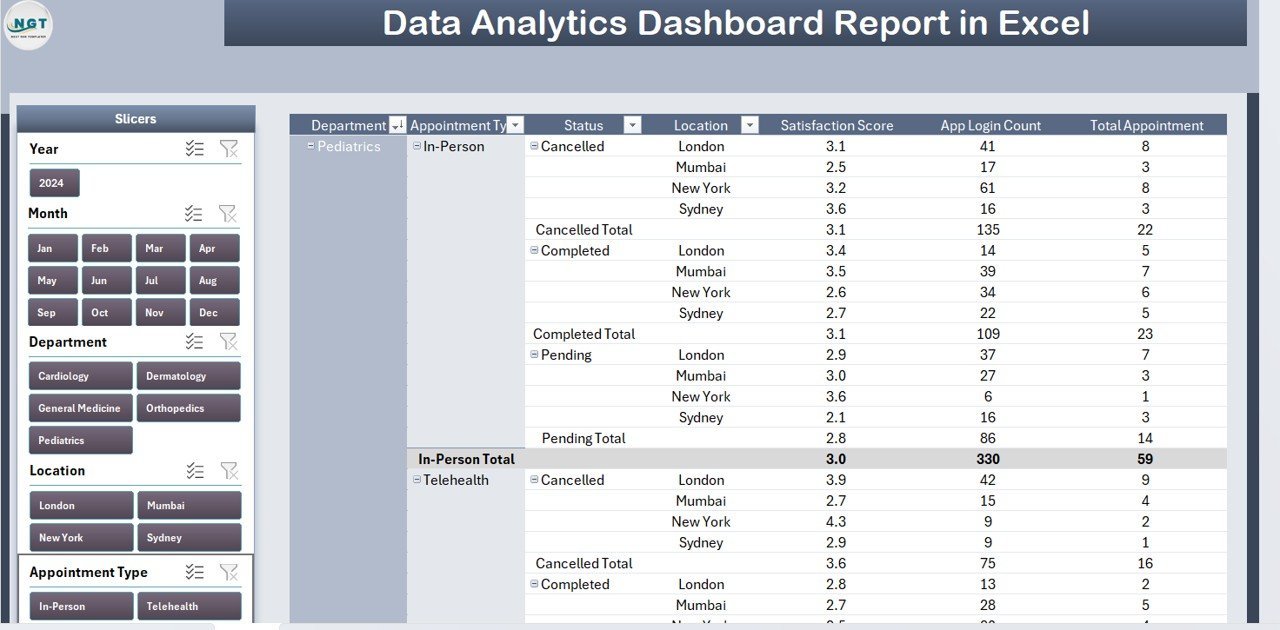
🔹 Dedicated Report page with a left-side slicer and Information Table — print-ready for PDF exports and weekly leadership packs.
🔹 Pivot-driven Support sheet wires every chart to a refreshable pivot — change the data, hit Refresh All, and the whole dashboard updates.
📦 What’s Inside the Data Analytics Dashboard Report
The Excel desktop file ships with 4 worksheets, in this order:
📊 1. Summary Page — 5 KPI cards on top, right-side slicer for filtering, and 5 charts: Cancelled Appointment %, Satisfaction Score by Department, Pending Appointment % by Appointment Type, App Login Count by Location, Total Appointment by Month.

Report page — left-side slicer plus printable Information Table
📋 2. Report Page — left-side slicer and a structured Information Table. This is the page operations leads send to leadership weekly — print to PDF or copy into a slide.
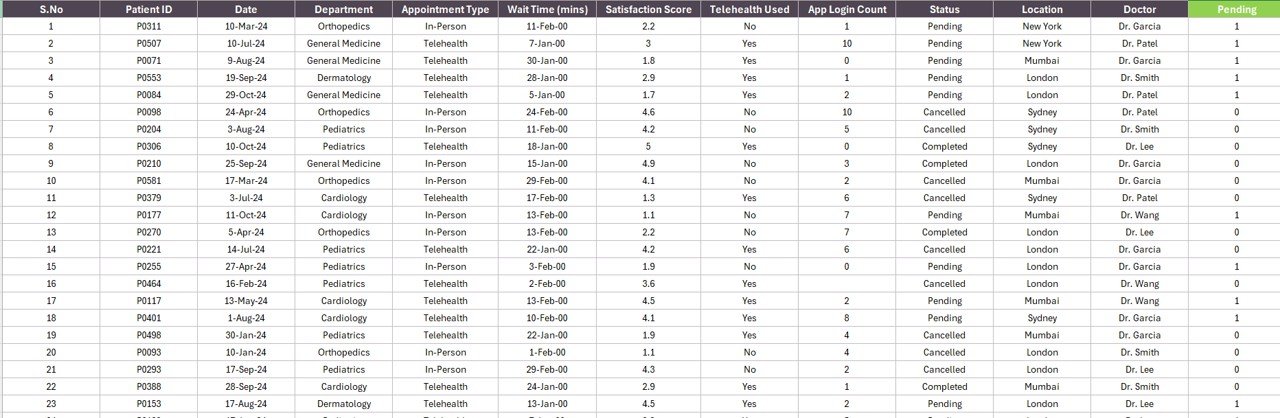
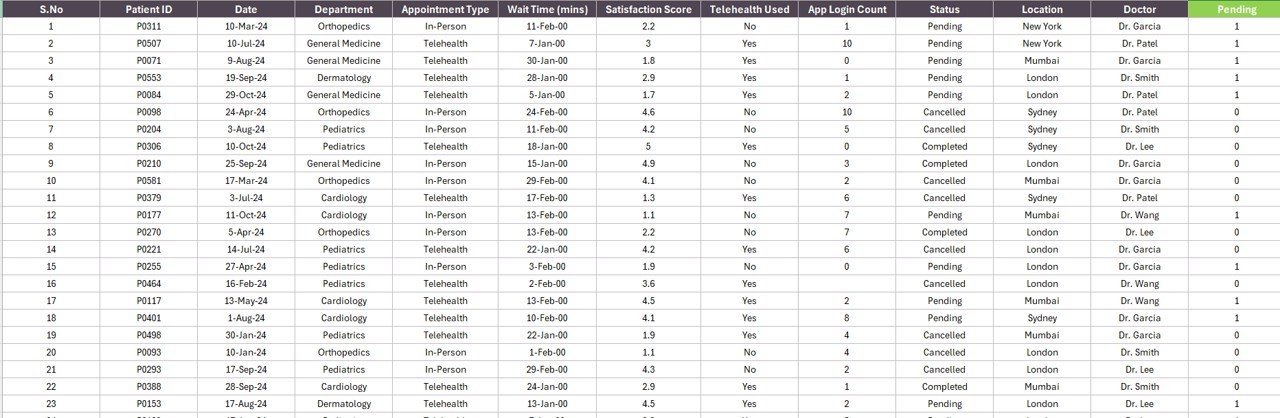
Data sheet — drop your appointment log here in the same column structure
🗂️ 3. Data Sheet — paste your appointment log here in the same column structure (Date, Department, Appointment Type, Location, Status, Satisfaction Score, App Login flag). Every other sheet refreshes from this single source.

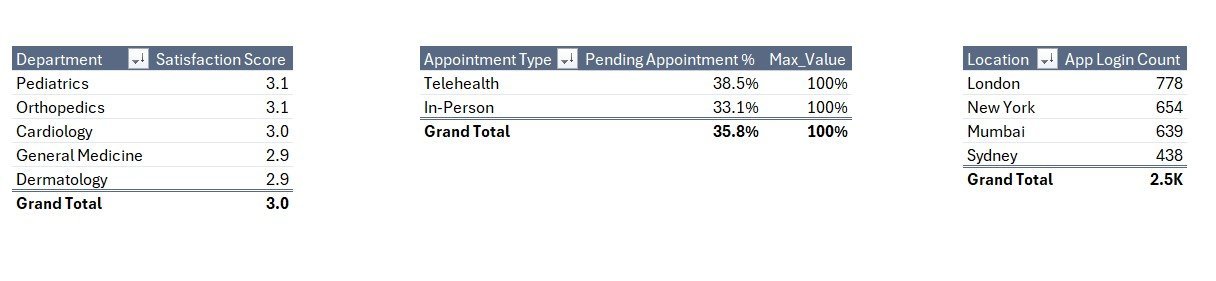
Support sheet — pivot tables wired to every chart on the Summary page
⚙️ 4. Support Sheet — hidden-by-default pivot tables that feed the dashboard. You’ll only touch this if you want to add a new chart or extend the model. Hide it from end users.
📊 Data Analytics Dashboard Report in Excel vs. Google Sheets vs. Paid BI SaaS — Where This Fits
| Feature | Data Analytics Dashboard Report (Excel) | Google Sheets equivalent | Power BI Pro / Tableau / Domo |
|---|---|---|---|
| Cost | $7.99 one-time | $8–$12 one-time | $10–$70 / user / month |
| Platform | Microsoft Excel (desktop) | Google Sheets (browser) | Standalone BI app |
| Setup time | Under 10 minutes | 10–15 minutes | 2–5 days (modeling, gateway, RLS) |
| Works offline | ✅ | ❌ | ❌ (mostly) |
| Slicer-based filtering | ✅ 2 slicers (Summary + Report) | Slicers (limited) | ✅ |
| Customizable fields | ✅ Full pivot model exposed | ✅ | Limited without admin rights |
| Year-1 cost at 5 users | $7.99 total | $8–$12 total | $600–$4,200 |
| Printable PDF export | ✅ Report page is print-ready | ✅ | ✅ |
| Vendor lock-in | None — your file | None — your file | High |
For teams that want a refreshable, slicer-driven appointment analytics report without paying $25–$70 per user every month for Power BI Pro or Tableau, the Data Analytics Dashboard Report in Excel sits in the sweet spot.
👥 Who This Template Is For — and Who It’s Not For
✅ This template is built for:
- Operations leads at appointment-driven businesses (clinics, salons, fitness studios, consultancies) tracking 50–10,000 appointments per month
- Customer service managers who report weekly on cancellation %, pending tickets, and satisfaction by department
- Small-to-mid healthcare practices, telehealth providers, and multi-location service brands needing a single Excel report for QBRs
- Excel-comfortable analysts who want pivot-refresh control without learning DAX or Power Query M
❌ This template is NOT for:
- Enterprise teams needing real-time API connections, SOC 2 audit logs, or row-level security
- Pure mobile-only workflows — this is a desktop Excel file (mobile Excel can read but slicers behave inconsistently)
- Teams whose data lives only in cloud apps and never gets exported to a sheet
⚙️ How to Use the Data Analytics Dashboard Report
- Download the .xlsx file and open it in Microsoft Excel (desktop, 2016+).
- Go to the Data sheet and replace the sample rows with your own appointment log — keep the column headers intact.
- Click Data → Refresh All on the ribbon. Every pivot table in the Support sheet rebuilds.
- Open the Summary page, click the right-side slicer, and pick a Department or Location to filter the entire view.
- Switch to the Report page, filter via the left-side slicer, and print to PDF for your weekly leadership pack.
💼 Real-World Use Cases
Priya runs operations at a 12-location dental chain. Every Monday she drops the previous week’s appointment log into the Data sheet, refreshes once, then uses the right-side Location slicer to flag any clinic where the Cancelled Appointment % crosses 8%. Her weekly leadership pack is the printed Report page — five minutes of work, no Power BI license needed.
Marcus is a customer-service director at a 60-person SaaS firm. He repurposed the report by mapping support tickets to the appointment columns: ticket type → Appointment Type, agent team → Department, region → Location. The CSAT-by-Department chart became his QBR centerpiece — replacing a $1,440-per-year Tableau Creator seat.
❓ Frequently Asked Questions
What KPIs does the Data Analytics Dashboard Report in Excel track?
The Data Analytics Dashboard Report tracks 5 headline appointment KPIs: Cancelled Appointment %, Pending Appointment % by Appointment Type, Satisfaction Score by Department, App Login Count by Location, and Total Appointment by Month. All five refresh automatically when you replace the sample data on the Data sheet.
Will this work on a Mac?
Yes. The Data Analytics Dashboard Report in Excel works in Microsoft Excel for Mac (2019+). Slicers, pivot tables, and refresh-all behave the same as on Windows. There are no VBA macros, so there is no macro-security prompt to clear on Mac.
How long does setup take?
Under 10 minutes for a typical 1,000-row appointment log. Paste your data into the Data sheet, click Data → Refresh All, and every chart and KPI card on the Summary page rebuilds. No formula edits, no chart-source repointing required.
How does this compare to Power BI Pro or Tableau?
Power BI Pro is $14/user/month and Tableau Creator is $75/user/month — both require modeling time and a license per analyst. The Data Analytics Dashboard Report in Excel is $7.99 one-time, runs in the Excel you already own, and covers most weekly appointment-reporting use cases without a subscription.
Can I add more departments, locations, or appointment types?
Yes. Add new values directly to the Data sheet and click Data → Refresh All. The slicers on both the Summary and Report pages auto-extend. You can also add fields to the pivot tables on the Support sheet to chart additional dimensions.
👤 About the Author
Built by PK — Microsoft Certified Professional with 15+ years of Excel, Google Sheets, and Power BI experience. Founder of NextGenTemplates, reaching 300K+ subscribers across YouTube channels (@PK-AnExcelExpert, @NextGenTemplates, @NeoTechNavigators). Every template is hand-built and tested before release.
🔗 Explore Related Templates
Browse our full library of Excel Reports or our Excel Dashboard Templates.
📄 Public Relations (PR) Report in Excel — same 4-page report structure, tuned for media-relations teams.
📄 Mental Health Services Report in Excel — appointment-driven analytics for behavioral-health practices.
📄 Administration Report in Excel — for ops and admin teams running cross-departmental reporting.
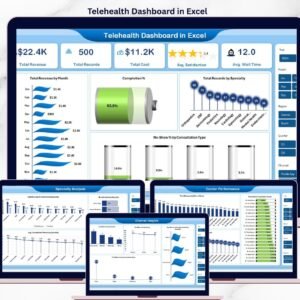
📊 Also available as a fuller dashboard: Telehealth Dashboard in Excel ($17.99) and Medical Practice Dashboard in Google Sheets ($9.99) for teams needing more pages and KPIs.
📖 Click here to read the Detailed Blog Post
🎥 Visit our YouTube channel for step-by-step video tutorials
👉 YouTube.com/@NextGenTemplates


Reviews
There are no reviews yet.