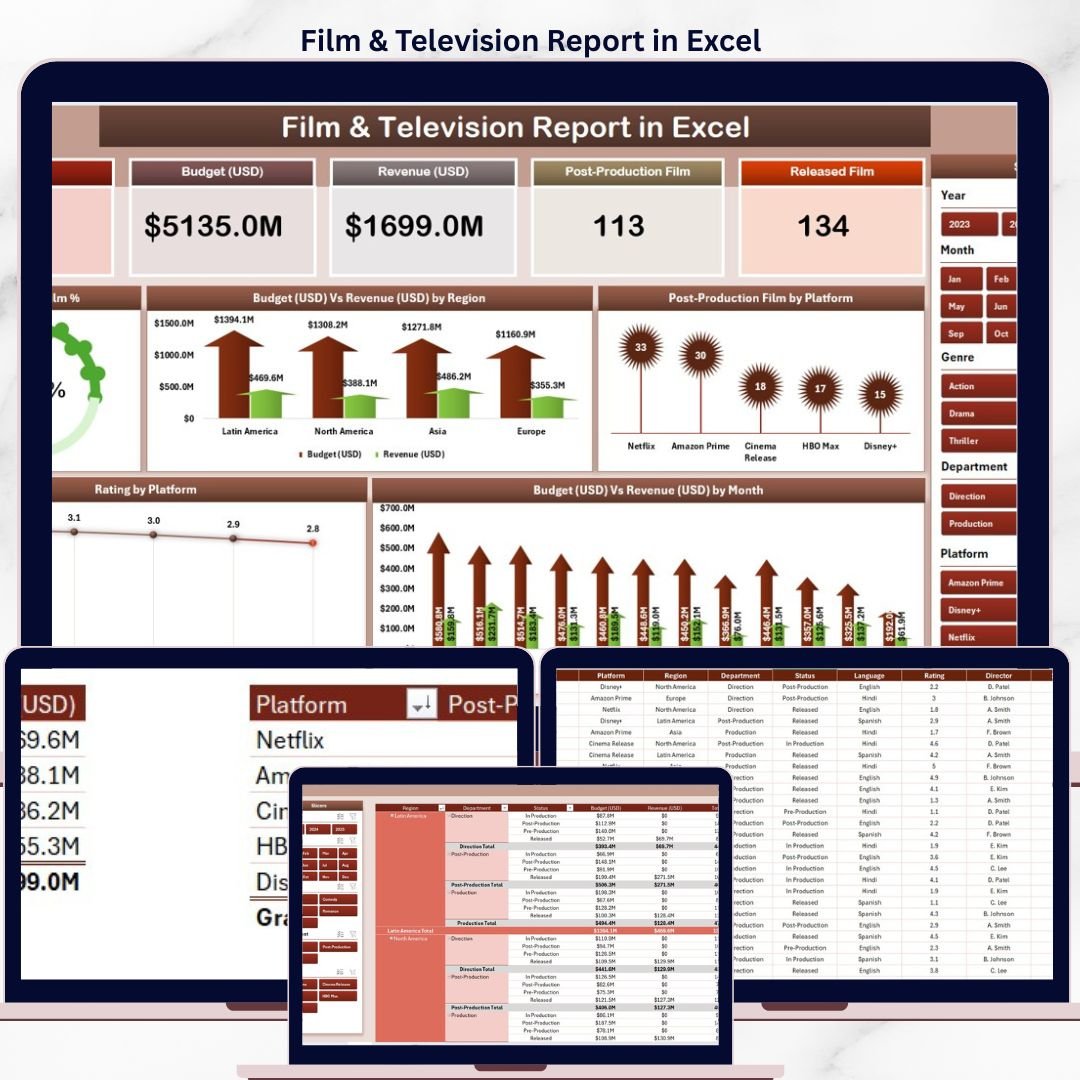
The Film & Television Report in Excel tracks 5 core entertainment metrics across 3 report pages — including Budget vs Revenue by Region, Rating by Platform, and Released Film trends — all updating automatically when you replace the sample data. With 5 interactive charts and dual-slicer filtering, this report gives producers, analysts, and media teams a clear view of film and TV performance without any paid SaaS subscription.
🌍 Join 8,400+ teams in 40+ countries using NextGenTemplates to replace expensive SaaS tools with one-time-purchase Excel, Google Sheets, Power BI, and HTML templates.
✅ Instant download · One-time payment · No subscription · No per-user fees · Lifetime access
🔑 Key Features of Film & Television Report in Excel
This Excel Report delivers a complete Film & Television analytics solution across 3 structured pages. The Summary Page displays 5 KPI cards at the top — covering total released films, budget allocation, revenue performance, average ratings, and platform distribution — alongside a right-side interactive slicer that filters all 5 charts simultaneously. The Report Page pairs a left-side slicer with a detailed Information Table, allowing row-level analysis of individual films and TV shows by region, platform, and production stage.
🎬 The 5 charts — Released Film %, Budget vs Revenue by Region, Postproduction Film by Platform, Rating by Platform, and Budget vs Revenue by Month — are pre-built and ready to populate with your real data. The Data Sheet serves as the central data entry point; update it and every chart, card, and table refreshes automatically. A Support Sheet maintains reference lists for dropdowns and data validation, ensuring consistent data entry across your team.
📊 This template is fully editable in Microsoft Excel for Desktop (Windows and Mac) and requires no add-ins, no macros to enable, and no internet connection.
📦 What’s Inside the Film & Television Report in Excel
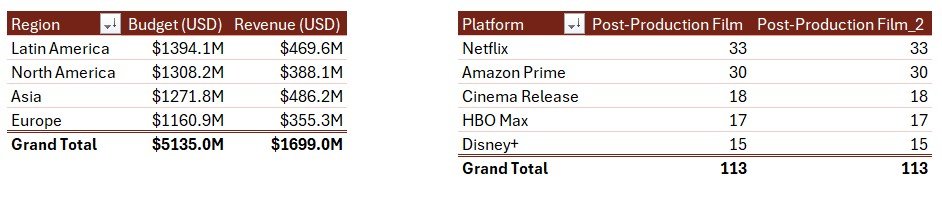
🎬 Page 1 – Summary Page: The main analytics hub featuring 5 KPI cards at the top (Released Films count, Total Budget, Total Revenue, Average Rating, Platform count), a right-side slicer panel for dynamic filtering, and 5 charts: Released Film % (donut/pie breakdown of films by status or genre), Budget vs Revenue by Region (clustered column comparing investment against returns across regions), Postproduction Film by Platform (platform-wise breakdown of films in postproduction), Rating by Platform (average audience/critic rating across streaming and broadcast platforms), and Budget vs Revenue by Month (monthly trend line showing financial performance over time).
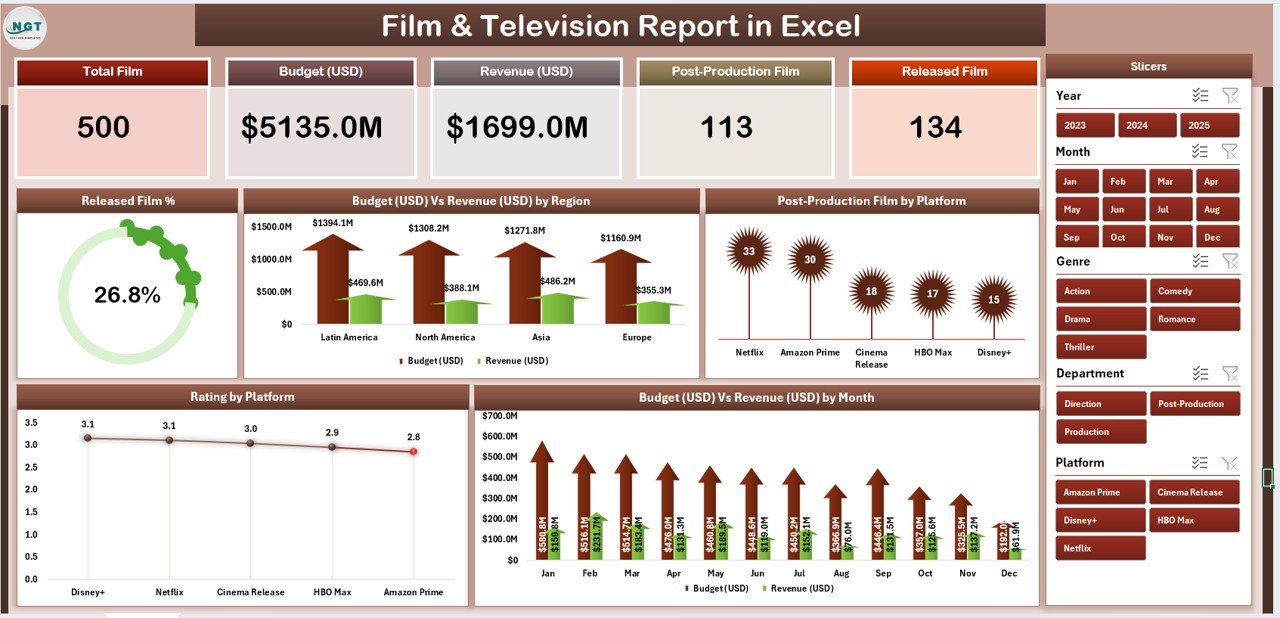
Film & Television Report in Excel – Summary Page with 5 Cards and 5 Charts
📋 Page 2 – Report Page: A clean data-driven page with a left-side slicer panel for dimension-level filtering and a comprehensive Information Table displaying individual film and TV show records — including title, region, platform, budget, revenue, postproduction status, and rating. Ideal for team presentations and stakeholder reporting.
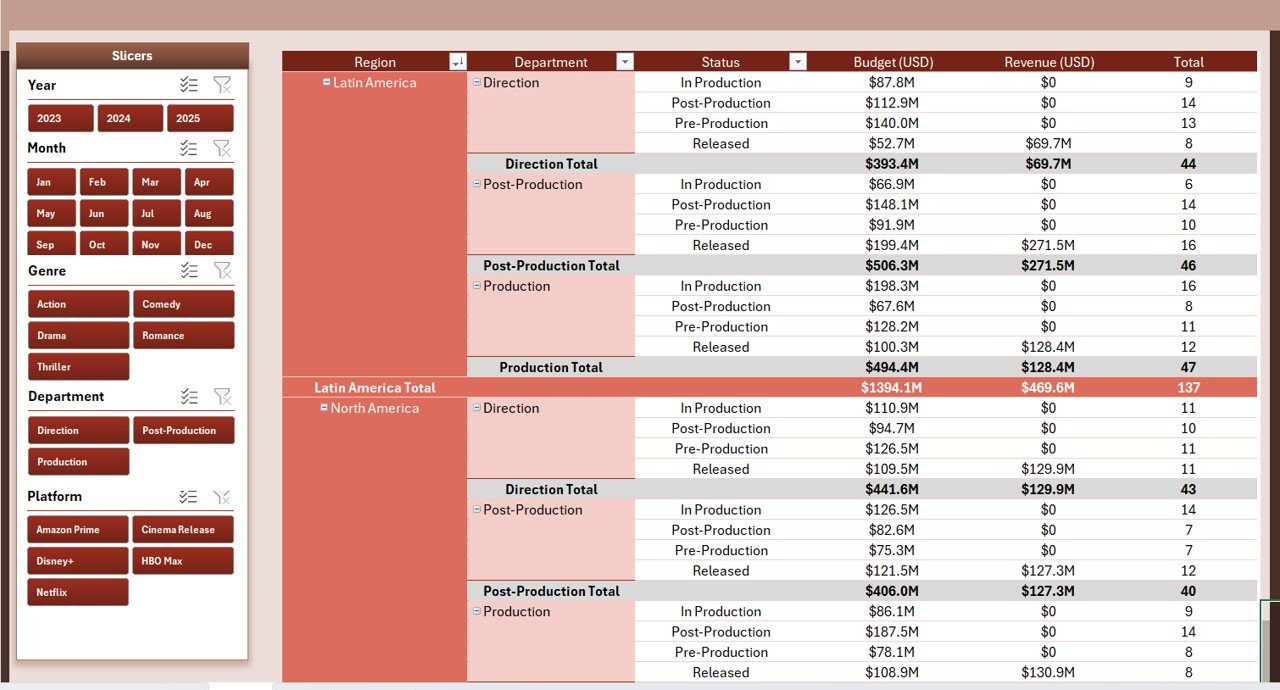
Film & Television Report in Excel – Report Page with Left Slicer and Information Table
🗂️ Data Sheet: The structured input sheet where you replace sample film and TV data with your own records. All charts, cards, and tables update automatically — no manual formula editing required.
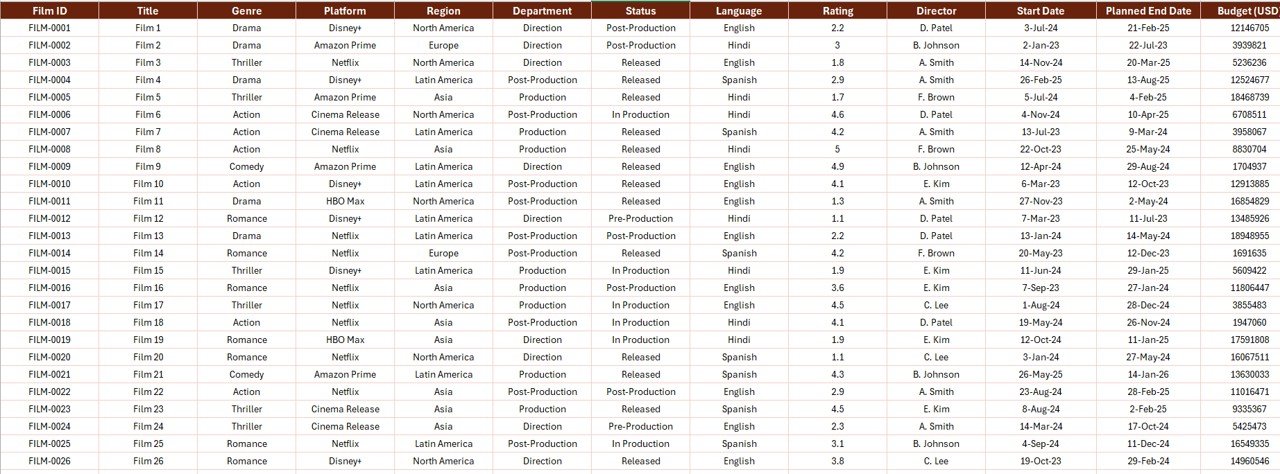
Film & Television Report in Excel – Data Entry Sheet
⚙️ Support Sheet: A pre-configured reference sheet containing dropdown lists, platform names, regional categories, and production stage values to keep your data consistent and error-free.
Film & Television Report in Excel – Support Sheet
📊 Film & Television Report in Excel vs. Google Sheets Version vs. Paid Media Analytics SaaS — Where This Fits
| Feature | Film & TV Report in Excel | Google Sheets Version | Paid SaaS (Tableau / Looker) |
|---|---|---|---|
| Cost | $7.99 one-time | Varies | $70–$150/user/month |
| Platform | ✅ Microsoft Excel Desktop | Google Sheets (browser) | Cloud only |
| Setup time | ✅ Under 10 minutes | Similar | 2–4 weeks + training |
| Works offline | ✅ Yes – no internet needed | ❌ Requires internet | ❌ Cloud-dependent |
| Interactive slicers | ✅ Dual slicers (Summary + Report) | Limited | ✅ Advanced filters |
| Customisable fields | ✅ Fully editable | ✅ Editable | Requires admin config |
| 5 pre-built charts | ✅ Ready to use | Varies | ✅ Custom dashboards |
| Year-1 cost (5 users) | $7.99 total | ~$30–50 | $4,200–$9,000 |
| No subscription | ✅ One-time payment | ✅ | ❌ Monthly recurring |
For media teams and film analysts who want structured Excel reporting without paying four-figure SaaS bills, the Film & Television Report in Excel sits in the sweet spot.
👥 Who This Template Is For — and Who It’s Not For
✅ This template is built for:
- Film producers and production managers tracking budget vs. revenue across multiple projects
- Media analysts reporting on platform performance (streaming, broadcast, OTT) for film and TV
- Entertainment company operations teams needing a quick reporting solution without SaaS costs
- Students, researchers, and freelancers analysing film industry trends in Excel
- Anyone already using Microsoft Excel who needs structured film and TV reporting
❌ This template is NOT for:
- Teams needing real-time data connections to streaming APIs or box office live feeds
- Enterprise studios requiring SOC 2 compliance, SSO, or multi-environment data pipelines
- Google Sheets users — see our Media and Entertainment Dashboard in Google Sheets instead
⚙️ How to Use the Film & Television Report in Excel
- Download and open the file in Microsoft Excel for Desktop.
- Navigate to the Data Sheet and replace the sample records with your own film and TV data (title, platform, region, budget, revenue, postproduction status, rating).
- Use the Support Sheet to review and update dropdown reference lists (platforms, regions, production stages) if needed.
- Return to the Summary Page — all 5 KPI cards and 5 charts will update automatically with your data.
- Use the right-side slicer on the Summary Page to filter charts by platform, region, or any other dimension.
- Switch to the Report Page to view row-level data in the Information Table. Use the left-side slicer to drill into specific categories.
- Share or print the Summary or Report Page for stakeholder presentations.
💼 Real-World Use Cases
Marcus manages operations for a regional film production company. Each month he pulls together budget vs. revenue data from five ongoing productions across three regions. Using the Film & Television Report in Excel, he populates the Data Sheet in under 15 minutes, then uses the Summary Page slicers to filter by region and present the Budget vs Revenue by Region chart directly in his board meeting — without paying $120/month for a Tableau licence.
Priya is a media analyst at an OTT content studio. She tracks platform performance across 30+ titles monthly. The Rating by Platform and Postproduction Film by Platform charts give her exactly the cross-platform view she needs, and the Information Table on the Report Page lets her drill into individual title records for stakeholder Q&A sessions.
Diego teaches entertainment business at a media arts university. He uses the Film & Television Report in Excel as a hands-on classroom tool — students enter real box office data and immediately see how budget allocation correlates with revenue by region and month, making the concepts tangible and data-driven.
❓ Frequently Asked Questions
What metrics does the Film & Television Report in Excel track?
The Film & Television Report in Excel tracks 5 key metrics — Released Film count, Budget, Revenue, Ratings, and Platform distribution — displayed across 5 KPI cards on the Summary Page. Five pre-built charts visualise Budget vs Revenue by Region and Month, Postproduction Film by Platform, Rating by Platform, and Released Film percentage breakdown.
How many pages does this Excel report have?
The template includes 4 sheets: a Summary Page (5 cards + 5 charts + right slicer), a Report Page (left slicer + Information Table), a Data Sheet for entering your own records, and a Support Sheet for reference lists and dropdown values.
Do I need any Excel add-ins or macros to use this template?
No add-ins or macros are required. The Film & Television Report in Excel uses native Excel features — pivot-based charts, slicers, and data validation — so it opens and runs on any standard Microsoft Excel Desktop installation on Windows or Mac.
How does this compare to Tableau or Looker for film analytics?
Tableau and Looker start at $70–$150 per user per month and require significant setup time. The Film & Television Report in Excel costs $7.99 as a one-time purchase, works offline, and is ready in under 10 minutes — making it the practical choice for small-to-mid-size media teams and individual analysts.
Can I add more films or TV shows to the Data Sheet?
Yes. The Data Sheet is fully editable — add as many rows as needed. The Summary Page charts and the Report Page Information Table will expand and update automatically as you add new records, with no formula changes required.
Is the Film & Television Report also available for Power BI?
Yes — if you prefer a Power BI version, explore our Film & Television Dashboard in Power BI for advanced interactive visuals and larger dataset support. For Excel KPI tracking, see our Film Production Houses KPI Dashboard in Excel.
What Excel version is required?
The template is built for Microsoft Excel 2016 and later (including Microsoft 365 / Excel 2019 / 2021). It works on both Windows and Mac. Excel for Web (browser) and mobile may have limited slicer support — desktop is recommended.
👤 About the Author
Built by PK — Microsoft Certified Professional with 15+ years of Excel, Google Sheets, and Power BI experience. Founder of NextGenTemplates, reaching 300K+ subscribers across YouTube channels (@PK-AnExcelExpert, @NextGenTemplates, @NeoTechNavigators). Every template is hand-built and tested before release.
🔗 Explore Related Templates
If you’re tracking entertainment and media performance, these related templates from our Excel Dashboard Templates collection will complement this report:
- 🎬 Film & Television Dashboard in Power BI — Advanced multi-page Power BI dashboard for film industry analytics
- 🎞️ Film Production Houses KPI Dashboard in Excel — KPI-focused dashboard for production house management
- 📊 Media & Entertainment KPI Dashboard in Excel — Comprehensive KPI tracking for the broader media sector
- 📱 Media and Entertainment Dashboard in Google Sheets — Cloud-based version for Google Sheets users
📖 Click here to read the Detailed Blog Post
🎥 Visit our YouTube channel for step-by-step video tutorials
👉 YouTube.com/@NextGenTemplates


Reviews
There are no reviews yet.