

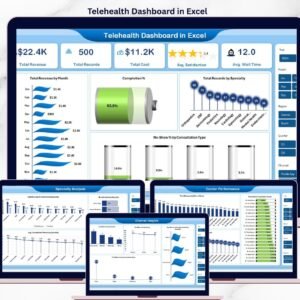
The Health Tech Dashboard Report in Excel tracks 5 core appointment KPIs across 4 interactive sheets, with 5 pre-built charts spanning department satisfaction, appointment status, and patient app engagement. Setup takes under 10 minutes — replace the sample data in the Data Sheet and every card, chart, and slicer in the report updates automatically.
🌍 Join 8,400+ teams in 40+ countries using NextGenTemplates to replace paid SaaS tools with one-time-purchase Excel, Google Sheets, Power BI, and HTML templates.
✅ Instant download · One-time payment · No subscription · No per-user fees · Lifetime access
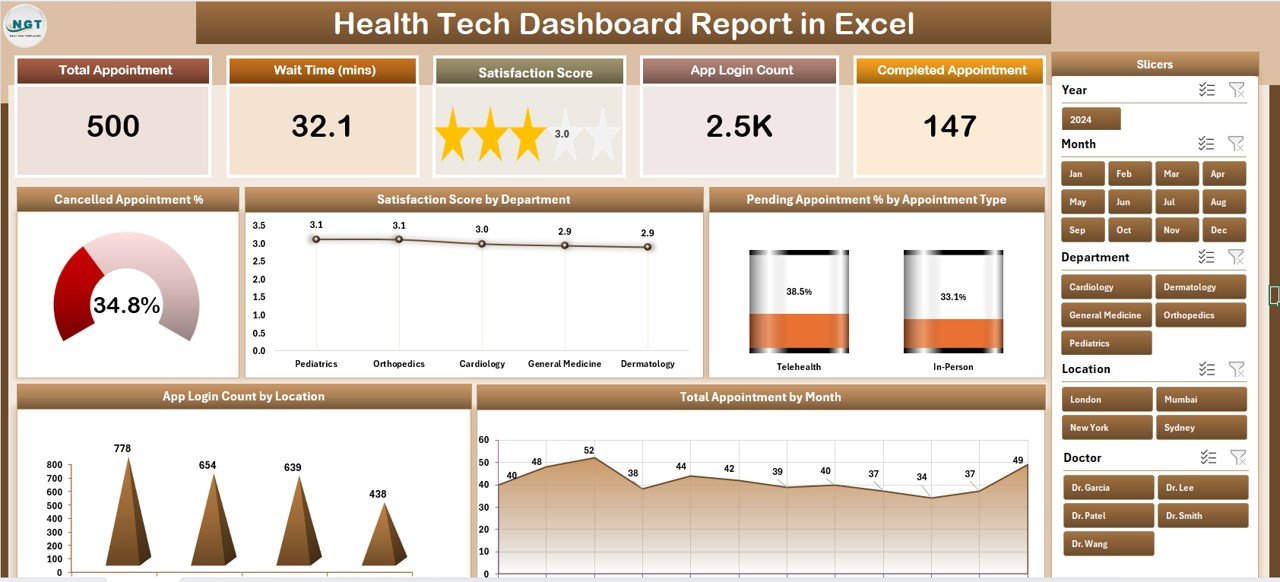
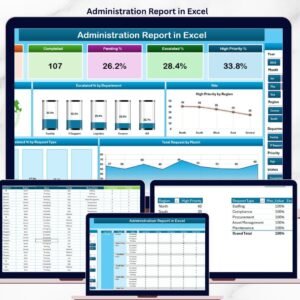
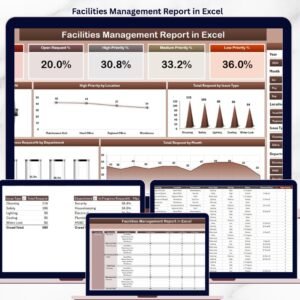
 Summary Page — 5 KPI cards, 5 charts, and a right-side slicer for instant filtering
🔑 Key Features of Health Tech Dashboard Report in Excel
This Health Tech Dashboard Report in Excel tracks 5 high-level appointment KPIs — Total Appointment, Cancelled Appointment %, Pending Appointment %, Satisfaction Score, and App Login Count — across every department, location, appointment type, and month on file. Telemedicine product managers, clinic operations leads, and health-tech founders use it to spot which departments score highest on satisfaction, which appointment types pile up in “pending” status, and which locations drive the most patient app logins.
🟢 5 KPI cards on the Summary Page — Total Appointment, Cancelled %, Pending %, Satisfaction Score, and App Login Count update in real time as new rows are added to the Data Sheet. The right-side slicer panel filters every card and chart on the page at once.
📊 5 pivot-driven charts — Cancelled Appointment %, Satisfaction Score by Department, Pending Appointment % by Appointment Type, App Login Count by Location, and Total Appointment by Month. Every chart is built from the hidden Support Sheet, so a single click on “Refresh All” updates the whole report.
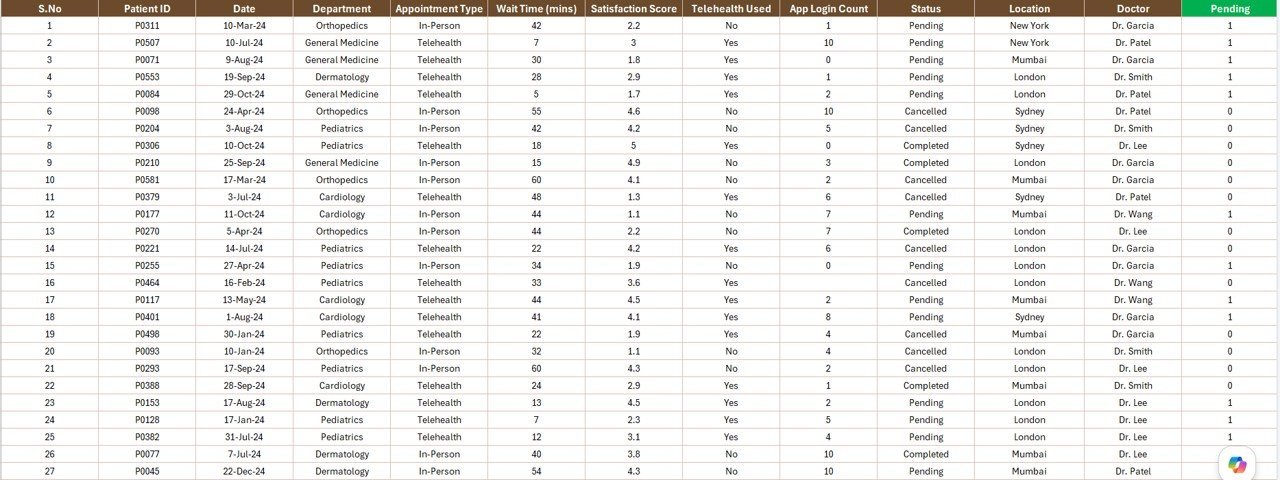
📋 Information Table on the Report Page — a row-level breakdown of every appointment record with a left-side slicer for filtering by department, location, status, or month. Use it as the audit trail behind the Summary Page numbers.
🧩 Slicer-driven filtering on every page — no formulas to edit, no macros to enable. Click a slicer button, the whole report responds. Works in Excel for desktop (Windows and Mac).
📁 Clean data structure — the Data Sheet uses a single flat table with one row per appointment, matching the structure you’d export from any EMR, scheduling system, or telehealth platform. Paste your records, hit refresh, you’re done.
📦 What’s Inside the Health Tech Dashboard Report in Excel
The workbook contains 4 sheets, designed to be used in this order:
1. Summary Page — The main reporting view. 5 KPI cards across the top (Total Appointment, Cancelled %, Pending %, Satisfaction Score, App Login Count), 5 charts in a grid layout, and a right-side slicer panel. Built for monthly leadership reviews and weekly ops standups.
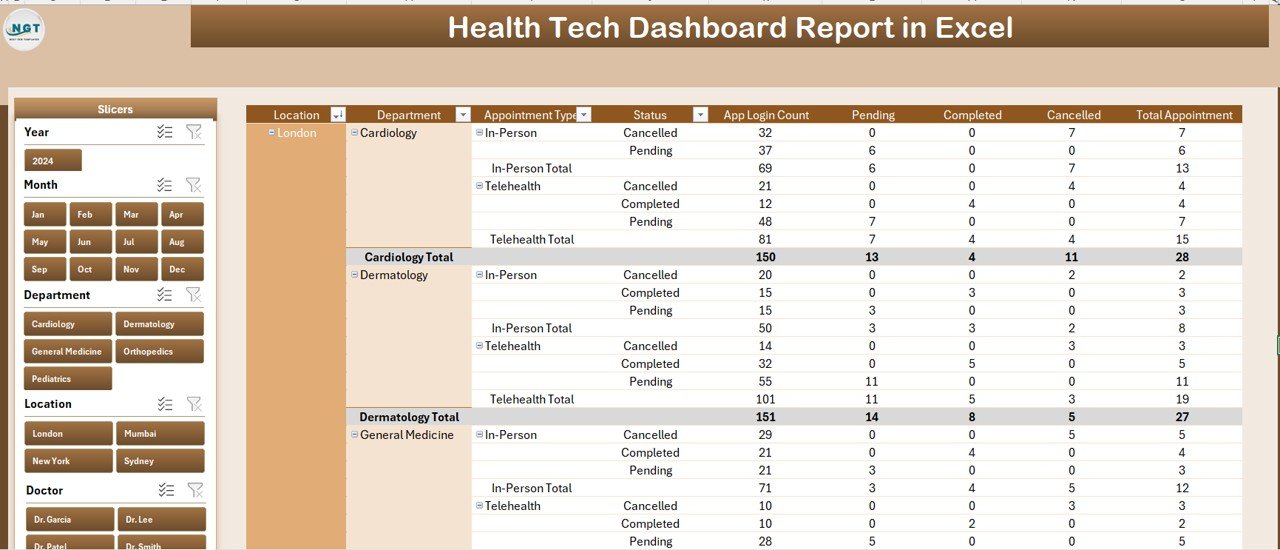 Report Page — left-side slicer and full information table for record-level audit
2. Report Page — Row-level appointment data with a left-side slicer. Use this view when leadership asks “which 12 appointments are still pending in the Cardiology department for last month” — filter, screenshot, send.
3. Data Sheet — The single source of truth. Replace the sample rows with your own appointment export and the entire report updates. Columns are pre-defined for appointment ID, date, type, department, location, status, satisfaction score, and app login flag.
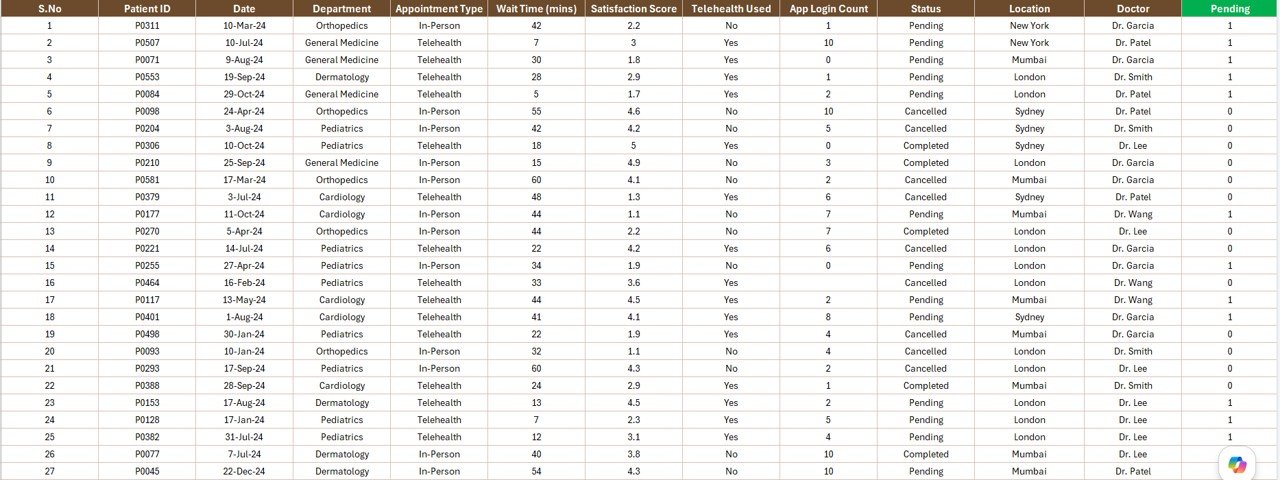 Data Sheet — paste your appointment export into the same column structure
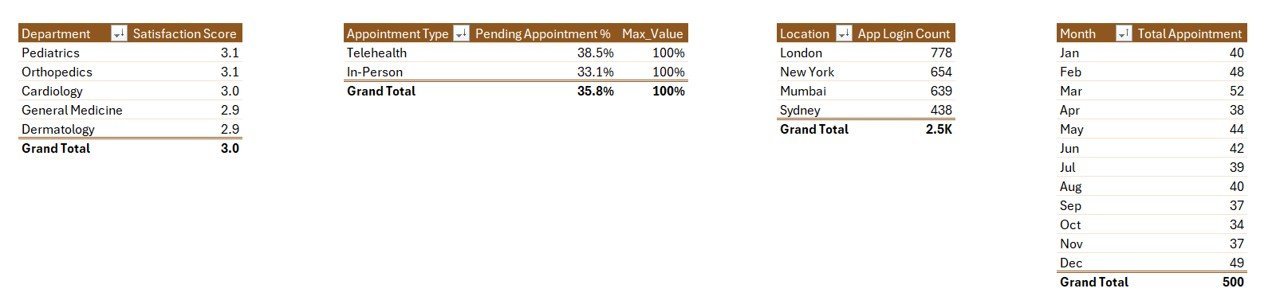
4. Support Sheet — Contains the pivot tables that power every chart and card. Hidden by default in production use. After updating the Data Sheet, click “Refresh All” on the Data ribbon and every pivot on the Support Sheet recalculates, then every chart on the Summary Page redraws.
 Support Sheet — pivot tables that drive every chart and KPI card
📊 Health Tech Dashboard Report in Excel vs. Google Sheets Equivalent vs. Paid Telemedicine BI — Where This Fits
| Feature | Health Tech Dashboard Report in Excel | Google Sheets equivalent | Athenahealth / Kareo BI module |
|---|---|---|---|
| Cost | $7.99 one-time | $9.99 one-time | $140–500 / user / month |
| Platform | Excel desktop (Windows + Mac) | Browser only | Web SaaS, vendor-hosted |
| Setup time | Under 10 minutes | Under 10 minutes | 2–8 weeks of vendor implementation |
| Works offline | ✅ Yes | ❌ No | ❌ No |
| Slicer-based filtering | ✅ Yes — right + left side | ✅ Yes | ✅ Yes |
| Per-user fees | ❌ None | ❌ None | ✅ Yes |
| Owns the data file | ✅ Yes — local .xlsx | Cloud-only | Vendor-controlled |
| Year-1 cost at 5 users | $7.99 total | $9.99 total | $8,400–30,000 |
| EMR integration | Manual CSV paste | Manual CSV paste | Native HL7/FHIR |
For health-tech teams that want clean appointment reporting without paying for a full telemedicine BI suite, the Health Tech Dashboard Report in Excel sits in the sweet spot.
👥 Who This Template Is For — and Who It’s Not For
✅ This template is built for:
- Telemedicine and health-tech startup operators tracking 50–5,000 appointments per month
- Independent clinics and group practices that want appointment KPIs without paying for full practice-management BI
- Product managers at health-tech apps tracking app login counts against appointment completion rates
- Healthcare ops analysts who need a fast, Excel-native report to share with non-technical leadership
❌ This template is NOT for:
- Hospital systems needing HIPAA-compliant cloud storage with audit logs and SSO — use a vendor BI tool instead
- Teams that need direct EMR/EHR integration over HL7 or FHIR — this is a manual-paste Excel report, not an integration
- Anyone storing identifiable patient health information (PHI) — de-identify your data before pasting into the Data Sheet
⚙️ How to Use the Health Tech Dashboard Report in Excel
- Open the downloaded
.xlsxfile in Microsoft Excel for desktop (Windows or Mac). - Go to the Data Sheet and replace the sample rows with your de-identified appointment export (one row per appointment).
- Keep the column headers exactly as they are — appointment date, type, department, location, status, satisfaction score, app login flag.
- Click any cell in the report, go to the Data ribbon, and click Refresh All — the Support Sheet pivots recalculate.
- Open the Summary Page. All 5 KPI cards and all 5 charts now reflect your data. Use the right-side slicer to filter.
- For row-level investigation, switch to the Report Page and use the left-side slicer to drill into a specific department, location, or status.
💼 Real-World Use Cases
Priya runs ops at a 40-person telemedicine startup serving 8 specialties. Every Monday she pulls last week’s appointment export from the scheduling API, pastes it into the Data Sheet, hits Refresh All, and screenshots the Summary Page for the leadership Slack channel. The whole report takes her 7 minutes — what used to take 90 minutes of Tableau dashboard fiddling.
Marcus is the founder of a behavioural-health app with 1,200 monthly active patients. He uses the Report Page to investigate why his Cancelled Appointment % jumped from 8% to 14% in the Northeast region — the left-side slicer filters by location and appointment type, and within minutes he’s identified that “Initial Consultation” cancellations spiked because of a new intake form bug.
Dr. Sara runs a 12-physician group practice. She doesn’t want to pay $140/user/month for Athenahealth’s analytics add-on for occasional reporting. Once a month she exports the appointment register from her practice-management system, pastes it into this report, and walks her partners through Satisfaction Score by Department at the monthly meeting.
❓ Frequently Asked Questions
What KPIs does the Health Tech Dashboard Report in Excel track?
The Health Tech Dashboard Report in Excel tracks 5 KPIs on the Summary Page — Total Appointment, Cancelled Appointment %, Pending Appointment %, Satisfaction Score, and App Login Count. Each updates automatically when you refresh the pivots after replacing the Data Sheet rows with your own export.
How long does setup take?
Setup takes under 10 minutes. Open the file, replace the sample rows on the Data Sheet with your appointment export, click Refresh All on the Data ribbon, and every chart, card, and slicer on the Summary Page and Report Page updates. No formulas to edit, no macros required.
Does this work in Excel for Mac and Excel Online?
The Health Tech Dashboard Report in Excel works fully in Excel for Windows and Excel for Mac desktop versions. Excel Online supports the report for viewing and basic filtering, but slicer interaction and full pivot refresh are most reliable in the desktop app.
Is it safe to load real patient data into this report?
This is a local Excel file with no cloud sync, so you control the file. However, never paste identifiable PHI into any template you didn’t build yourself — de-identify the export (remove names, MRNs, contact info) before loading. For HIPAA-regulated environments, use a vendor-certified BI tool.
How does this compare to Athenahealth or Kareo BI?
Athenahealth and Kareo bundle BI inside a $140–500 per user per month practice-management suite with native EMR integration. The Health Tech Dashboard Report in Excel is a $7.99 one-time-purchase reporting template — no integration, no per-user fees, you paste the data yourself. Different tools for different stages.
Can I add my own KPIs or charts?
Yes. The Support Sheet contains the pivot tables that drive every chart. Add a new pivot, build a chart from it, and drop it onto the Summary Page. The slicer panel will pick up the new chart automatically if it shares the same source data.
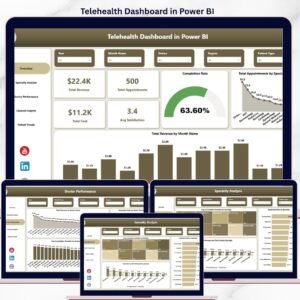
Is this the same as a Power BI Health Tech dashboard?
No. This is Excel-native — it opens in Excel for desktop, uses pivot tables and slicers, and requires no separate software. If you need a Power BI version, we publish a separate Telehealth Dashboard in Power BI with DAX measures and richer cross-filtering.
👤 About the Author
Built by PK — Microsoft Certified Professional with 15+ years of Excel, Google Sheets, and Power BI experience. Founder of NextGenTemplates, reaching 300K+ subscribers across YouTube channels (@PK-AnExcelExpert, @NextGenTemplates, @NeoTechNavigators). Every template is hand-built and tested before release.
🔗 Explore Related Templates
If the Health Tech Dashboard Report in Excel is helpful, you may also like:
- 💎 Healthcare & Hospital Management Bundle — Save 38% by getting all 8 premium healthcare templates together → View bundle
- Telehealth Dashboard in Excel — full-featured telemedicine analytics
- Healthcare Services Report in Excel — companion report for service delivery KPIs
- Mental Health Services Report in Excel — behavioural-health focused report
- Medical Practice Dashboard in Google Sheets — Google Sheets alternative
- Browse all Excel Reports and Excel Dashboard Templates.
📖 Click here to read the Detailed Blog Post
🎥 Visit our YouTube channel for step-by-step video tutorials
👉 YouTube.com/@NextGenTemplates
Watch the step-by-step video tutorial:


Reviews
There are no reviews yet.