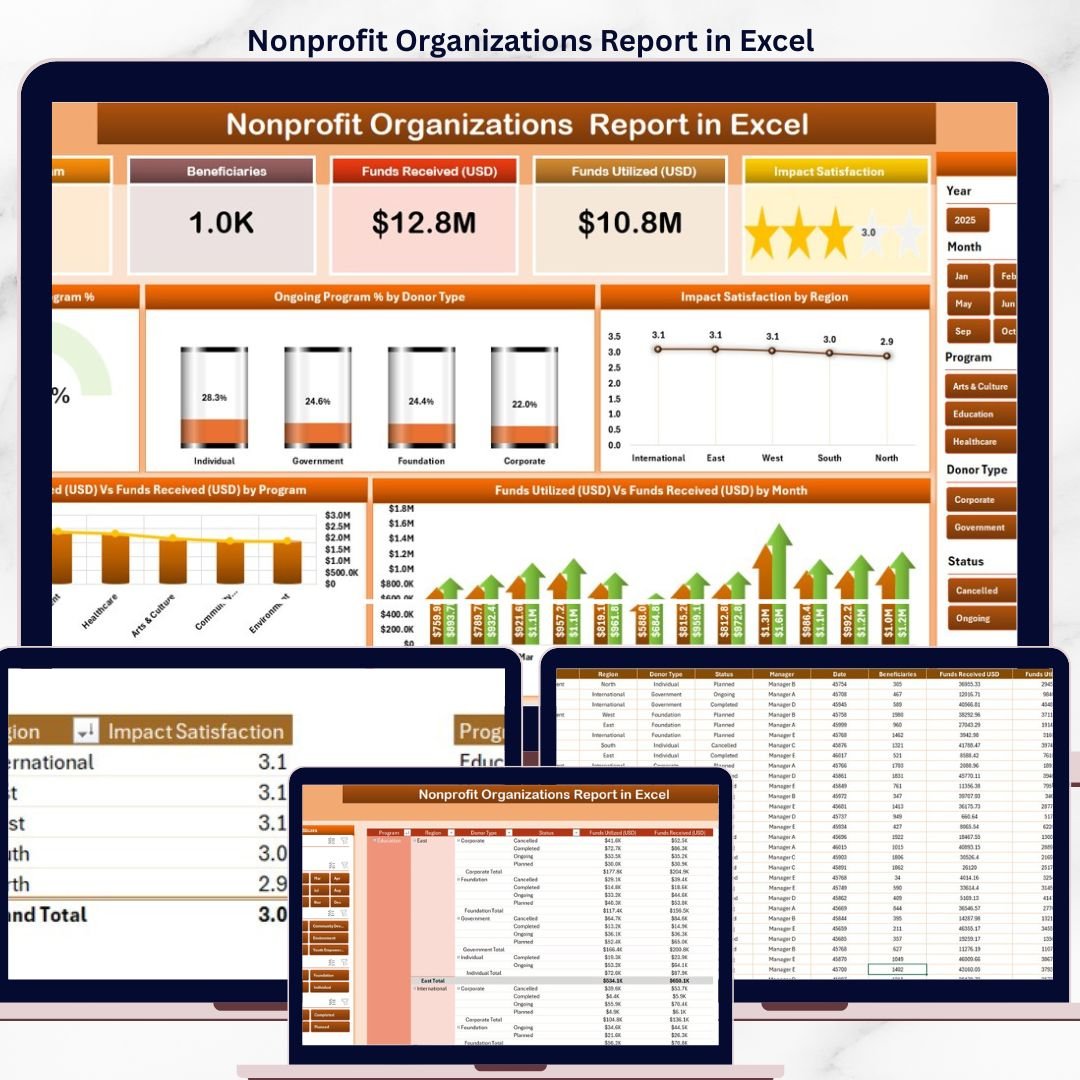

The Nonprofit Organizations Report in Excel tracks 5 headline KPIs across 3 sheets, with 5 interactive charts and right-side slicers covering donor type, region, program, and month. Setup takes under 10 minutes — paste your donor and program data into the Data sheet, and every chart, card, and table on the Summary and Report pages refreshes automatically.
🌍 Join 8,400+ teams in 40+ countries using NextGenTemplates to replace paid SaaS tools with one-time-purchase Excel, Google Sheets, Power BI, and HTML templates.
✅ Instant download · One-time payment · No subscription · No per-user fees · Lifetime access
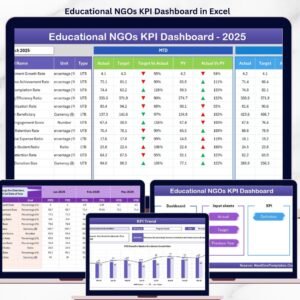
Summary Page — 5 KPI cards, right-side slicer, and 5 charts covering programs, donors, impact, and funds
🔑 Key Features of the Nonprofit Organizations Report
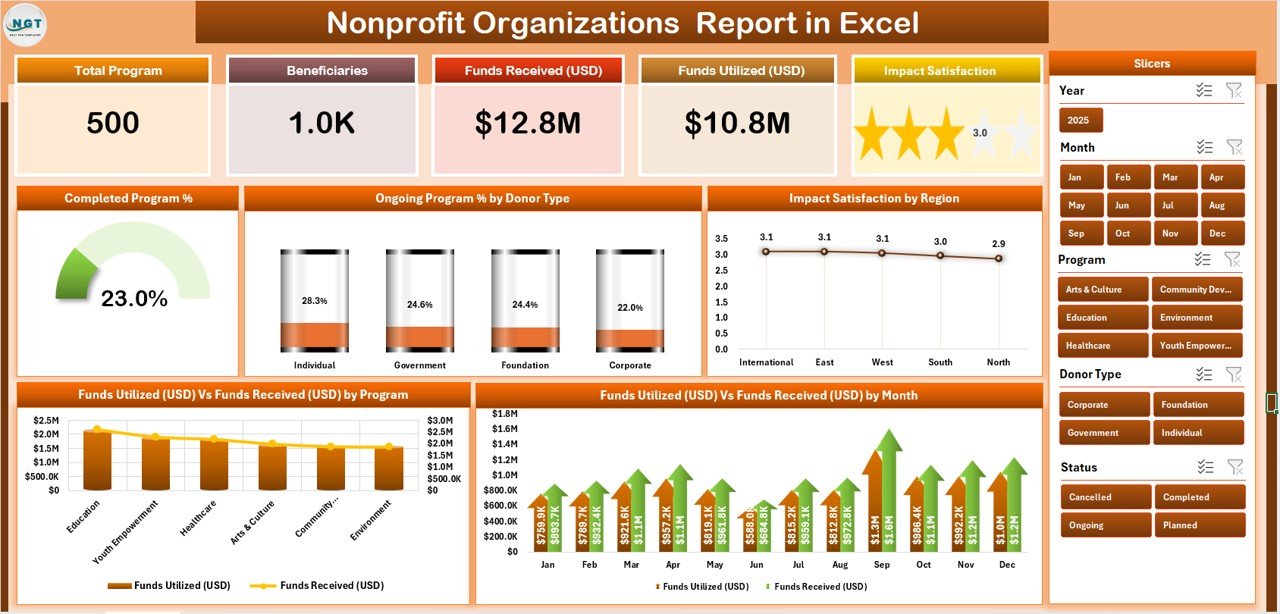
📊 5 KPI cards on the Summary Page — top-of-page indicators that capture overall completed program count, ongoing program count, average impact satisfaction, total funds received, and total funds utilized. Cards refresh the moment you change a slicer.
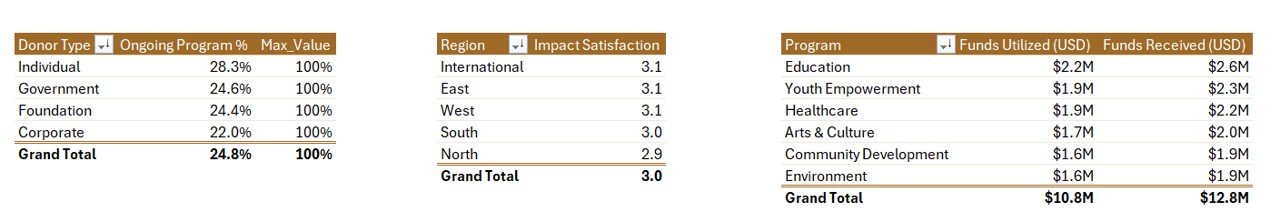
🎯 5 fully linked charts on the Summary Page — Completed Program %, Ongoing Program % by Donor Type, Impact Satisfaction by Region, Funds Utilization vs Funds Received by Program, and Funds Utilization vs Funds Received by Month. All five react to the right-side slicer in real time.
🧭 Right-side slicer for filtered analysis — slice the Summary Page by program, region, donor type, or year and watch the cards and charts redraw together. No formulas to edit.
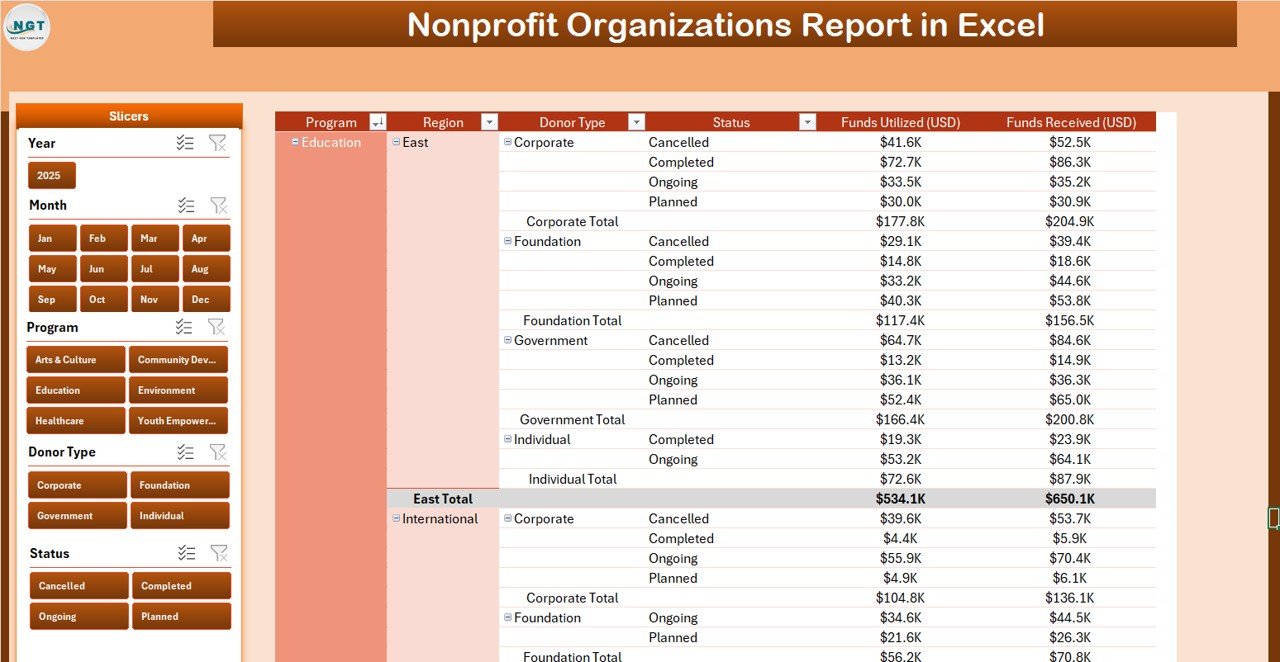
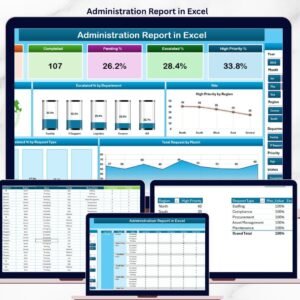
📋 Dedicated Report page with information table — a structured tabular view backed by its own left-side slicer, ideal for board packs, donor reports, and grant applications where reviewers want the underlying records, not just a chart.
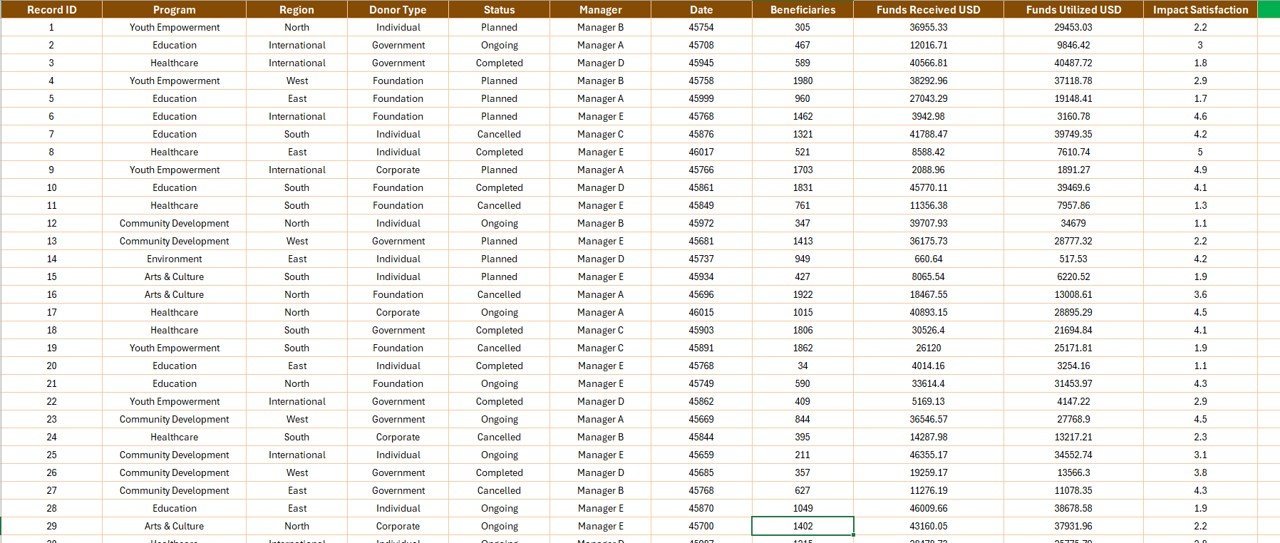
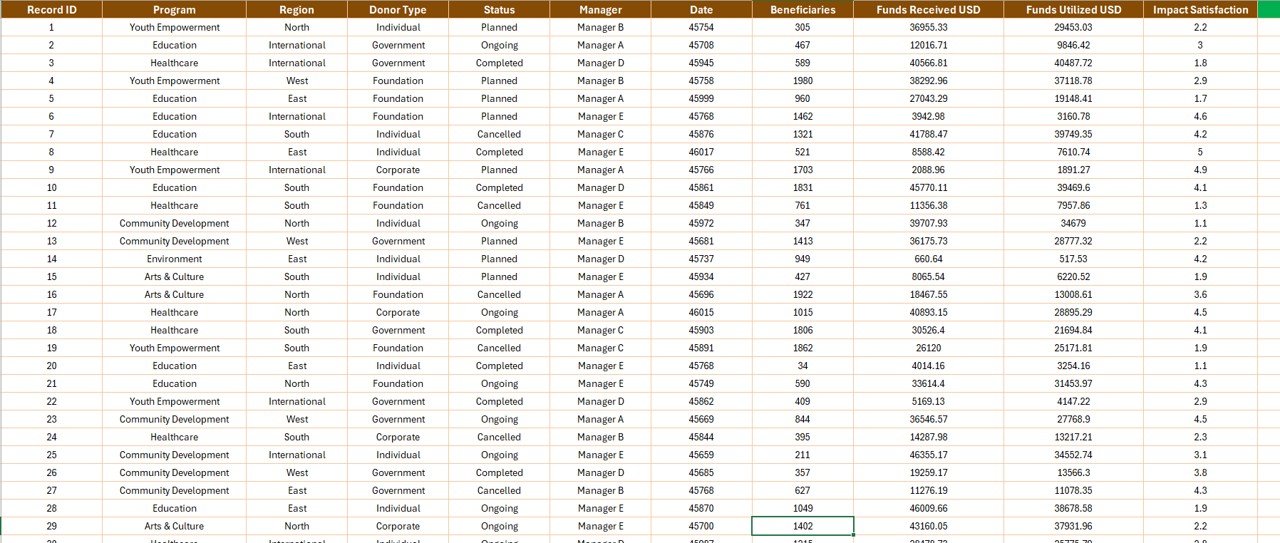
🗂️ Editable Data sheet — replace the sample 200+ rows of nonprofit transactions with your own donor, program, region, fund, and impact records. Column headers stay fixed so the formulas keep working.
⚙️ Support sheet for lookups and labels — central place to maintain dropdown lists for regions, donor types, programs, and reporting periods. Update once, and dropdowns across the workbook stay clean.
🖥️ Built for Excel desktop — works in Microsoft Excel for Windows and Mac (Microsoft 365 / Excel 2019+). No add-ins, no macros, no internet connection required.
📦 What’s Inside the Nonprofit Organizations Report
The workbook has 4 sheets:
📌 Summary Page — the main reporting page. 5 KPI cards across the top, right-side slicer, and 5 charts: Completed Program %, Ongoing Program % by Donor Type, Impact Satisfaction by Region, Funds Utilization vs Funds Received by Program, and Funds Utilization vs Funds Received by Month.
Summary Page detail — KPI cards on top, charts react to the right-side slicer
📌 Report Page — left-side slicer plus a clean information table that lists nonprofit records (program, donor type, region, funds received, funds utilized, impact rating, status). Use it to share filtered records in board reports or donor letters.
Report Page — left slicer drives a structured information table
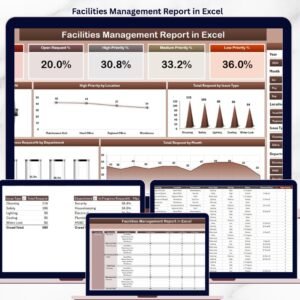
📌 Data Sheet — your editable source data. Columns include date, program name, donor name, donor type, region, country, funds received, funds utilized, beneficiaries, impact satisfaction, and status. Replace sample rows with yours and the report updates everywhere.
📌 Support Sheet — lookup tables, dropdown sources, and fixed lists for regions, donor types, and programs. Keeps the data validation tidy across the workbook.
Data Sheet — paste your own donor and program records here
📊 Nonprofit Organizations Report vs. Google Sheets Equivalent vs. Paid Nonprofit CRMs — Where This Fits
| Feature | Nonprofit Organizations Report (Excel) | Google Sheets equivalent | Salsa / Bloomerang / NeonCRM |
|---|---|---|---|
| Cost | $7.99 one-time | Free, but you build it | $99–$499 / month |
| Platform | Microsoft Excel desktop | Google Sheets (browser) | Cloud SaaS |
| Setup time | Under 10 minutes | Hours of formula building | Multi-week onboarding |
| Real-time team collaboration | Via OneDrive / SharePoint | ✅ Built in | ✅ Built in |
| Works offline | ✅ | ❌ | ❌ |
| Customizable fields | ✅ Full Excel control | ✅ | Partial — vendor schema |
| Donor data ownership | ✅ Your file, your control | ✅ | Hosted by vendor |
| Year-1 cost at 5 users | $7.99 one-time | $0 + your hours | $1,200–$6,000+ |
| Mobile access | Excel mobile app | ✅ | ✅ |
For nonprofits that want clean board-ready reports without paying $1,200+ per year for a donor CRM, the Nonprofit Organizations Report sits in the sweet spot.
👥 Who This Template Is For — and Who It’s Not For
✅ This template is built for:
- Small to mid-size nonprofits and NGOs (5–100 staff) tracking donor funds, programs, and impact
- Program managers preparing quarterly board reports and grant utilization summaries
- Founders and executive directors who need a single-file financial and impact snapshot
- Charity finance volunteers who want Excel — not a SaaS subscription — for monthly reporting
- Grant-funded teams that must report donor utilization to multiple funders separately
❌ This template is NOT for:
- Large international NGOs needing SOC 2, SSO, and audit-trail compliance — those teams need a CRM
- Organizations that have never collected donor data and need fundraising features (this is a reporting tool, not a fundraising platform)
- Teams who need Mac-only Excel without the desktop app (web-only Excel handles slicers but with limits)
⚙️ How to Use the Nonprofit Organizations Report
- Download and open the .xlsx file in Microsoft Excel (Windows or Mac, Excel 2019+ or Microsoft 365).
- Open the Data sheet and replace the sample rows with your own donor, program, region, funds, and impact records. Keep the column headers exactly as they are.
- Update the Support sheet if you have new regions, programs, or donor types. This keeps the dropdowns and slicers tidy.
- Refresh the Summary Page by pressing Ctrl+Alt+F5 (or Data → Refresh All). All 5 KPI cards and 5 charts will reflect your data.
- Filter using the right-side slicer on the Summary Page to drill down by program, region, donor type, or year.
- Open the Report Page and use the left-side slicer to filter the information table, then copy it into board decks or donor letters.
💼 Real-World Use Cases
Aisha runs operations at a 25-person education nonprofit in Nairobi. She uses the Nonprofit Organizations Report each quarter to show her board exactly how much of the $180,000 in donor funds was utilized across 6 programs, broken down by region. The Funds Utilization vs Funds Received chart has saved her from rebuilding the same pivot every quarter — and the right-side slicer lets her show one funder only their programs without exposing others.
David is the executive director of a 12-person U.S. health charity. He uses the Report Page with its left-side slicer to filter the information table by donor type and export it for individual donor stewardship reports. Replacing his old Educational NGOs KPI Dashboard in Excel with this lighter report file means his program managers can update one Data sheet and he gets a clean snapshot in minutes instead of hours.
Priya volunteers as the finance lead for a community NGO in Mumbai. She brought her team off a $99/month nonprofit CRM and now shares this Excel report on OneDrive. Five program leads paste in their monthly numbers; the Summary Page keeps the impact satisfaction by region chart up to date, and the board sees the same view as the funders.
❓ Frequently Asked Questions
What KPIs does the Nonprofit Organizations Report track?
The Nonprofit Organizations Report tracks 5 headline KPIs on cards (completed programs, ongoing programs, impact satisfaction, funds received, funds utilized) plus 5 charts covering completed program %, ongoing program % by donor type, impact satisfaction by region, and funds utilization vs received by program and by month.
Does the Nonprofit Organizations Report work in Excel for Mac?
Yes. The Nonprofit Organizations Report works in Microsoft Excel for Windows and Mac (Excel 2019, Excel 2021, and Microsoft 365). Slicers, charts, and KPI cards all function on both platforms because the file uses standard Excel features only — no macros, no add-ins, no internet required.
Can multiple staff members edit the Data sheet at the same time?
Yes — if you save the Nonprofit Organizations Report on OneDrive or SharePoint, multiple staff members can edit the Data sheet simultaneously through Excel’s co-authoring. Charts on the Summary and Report pages refresh for everyone when a record is updated, with no extra cost per user.
How does this compare to a paid nonprofit CRM like Bloomerang or NeonCRM?
Bloomerang and NeonCRM are full donor CRMs starting at roughly $99–$499 per month. The Nonprofit Organizations Report is a $7.99 one-time Excel reporting layer — perfect if you already track donors elsewhere and just need a clean board-ready report file with KPI cards, slicers, and 5 charts.
How long does setup take?
Setup of the Nonprofit Organizations Report takes under 10 minutes. Open the file, replace the sample rows on the Data sheet with your own donor and program records, refresh the workbook (Ctrl+Alt+F5), and the Summary Page and Report Page update automatically.
Can I customize the regions, donor types, and programs?
Yes. The Nonprofit Organizations Report uses a Support sheet that holds lookup lists for regions, donor types, and programs. Edit those lists once and every dropdown, slicer, and chart in the workbook reflects your nonprofit’s structure.
Do I get a refund if it doesn’t fit my workflow?
The Nonprofit Organizations Report is an instant digital download, so refunds depend on the standard NextGenTemplates policy. Because it’s a one-time $7.99 purchase with lifetime access, most teams treat it as a low-risk way to test before adopting a paid CRM.
👤 About the Author
Built by PK — Microsoft Certified Professional with 15+ years of Excel, Google Sheets, and Power BI experience. Founder of NextGenTemplates, reaching 300K+ subscribers across YouTube channels (@PK-AnExcelExpert, @NextGenTemplates, @NeoTechNavigators). Every template is hand-built and tested before release.
🔗 Explore Related Templates
📊 Educational NGOs KPI Dashboard in Excel — a fuller KPI dashboard if you need more than the 5 charts in this report.
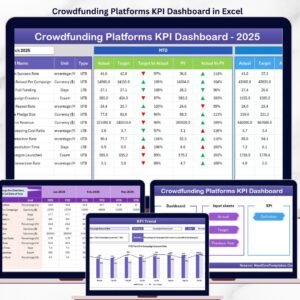
💰 Crowdfunding Platforms KPI Dashboard in Excel — pair with this report if your nonprofit also runs crowdfunding campaigns.
⛪ Church Finance Dashboard in Google Sheets — Google Sheets alternative for faith-based nonprofits.
❤️ Charity Fundraising KPI Scorecard in Google Sheets — fundraising-specific scorecard, complementary to this reporting file.
🎉 Event Management Analysis Dashboard in Excel — useful for nonprofits that run fundraisers and galas.
Browse more in Excel Reports or our full Excel Dashboard Templates library.
📖 Click here to read the Detailed Blog Post
🎥 Visit our YouTube channel for step-by-step video tutorials
👉 YouTube.com/@NextGenTemplates
📅 Last updated: April 2026
Watch the step-by-step video tutorial:


Reviews
There are no reviews yet.