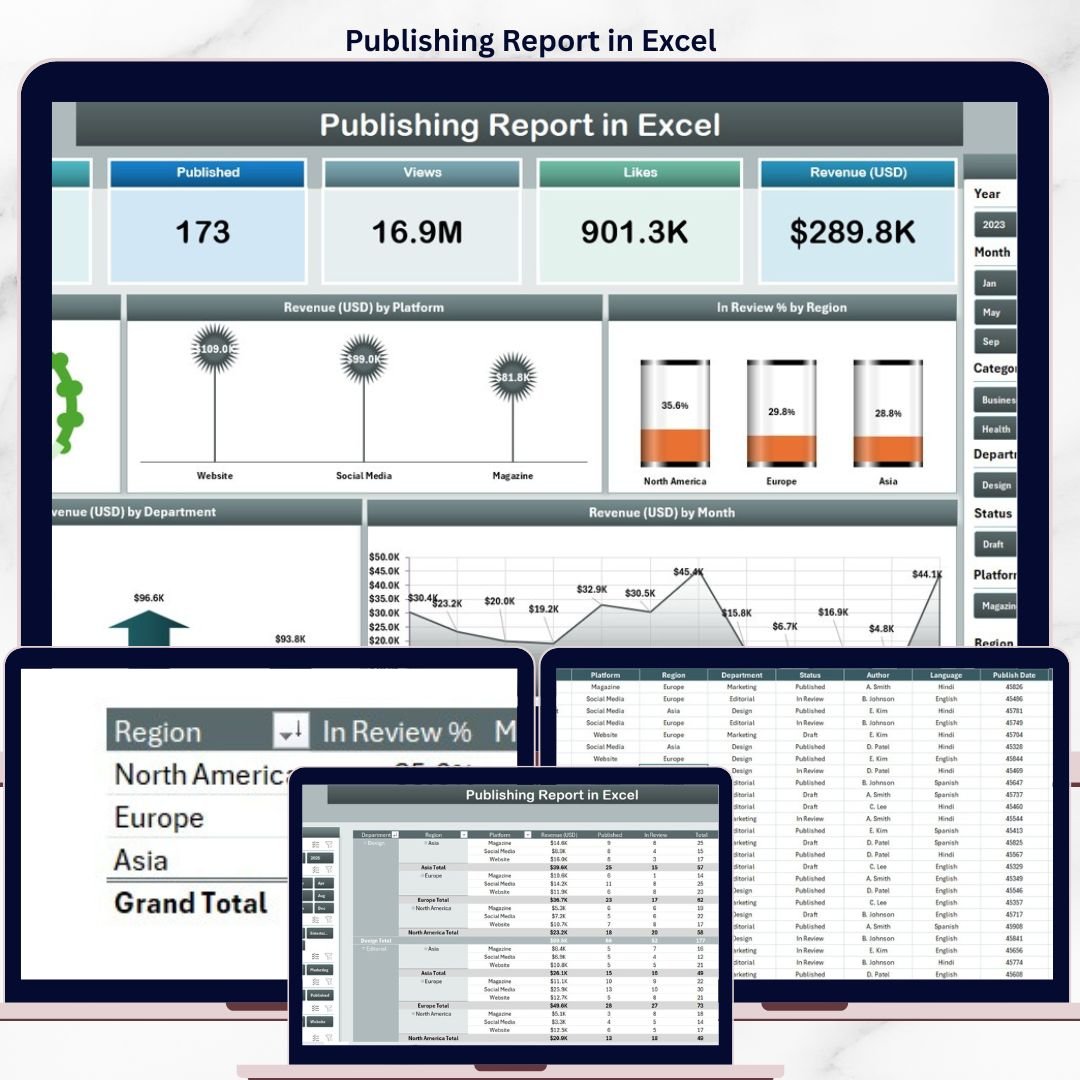
The Publishing Report in Excel tracks 5 core publishing metrics across 3 report pages — including Published %, Revenue by Platform, In Review % by Region, Revenue by Department, and Revenue by Month — all updating automatically when you replace the sample data. With 5 interactive charts and dual-slicer filtering, this report gives publishers, content managers, and media analysts a clear view of publishing performance without any paid SaaS subscription.
🌍 Join 8,400+ teams in 40+ countries using NextGenTemplates to replace expensive SaaS tools with one-time-purchase Excel Report Templates.
✅ Instant download · One-time payment · No subscription · No per-user fees · Lifetime access
🔑 Key Features of Publishing Report in Excel
🔹 3-Page Report Structure – The Summary Page, Report Page, Data Sheet, and Support Sheet are all contained in a single Excel file, giving publishing teams everything they need to track title output, revenue, and review status in one place.
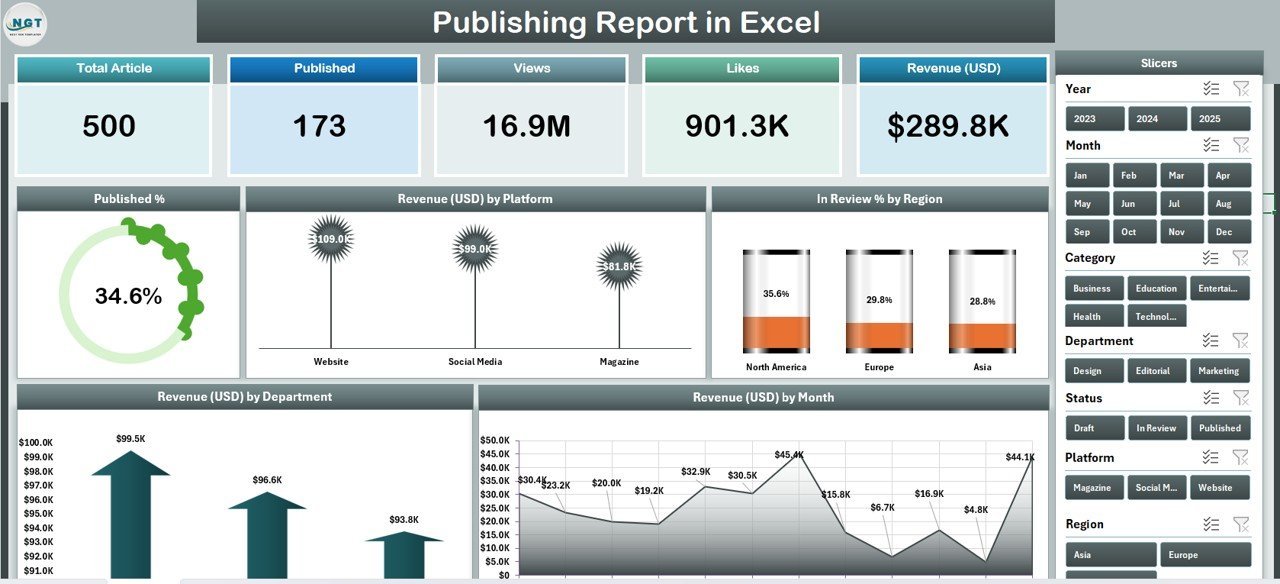
🔹 5 KPI Cards on the Summary Page – The top row of the Summary Page displays five at-a-glance cards covering total published titles, total revenue, in-review percentage, average revenue per title, and active platform count. These cards auto-update every time the Data Sheet changes.
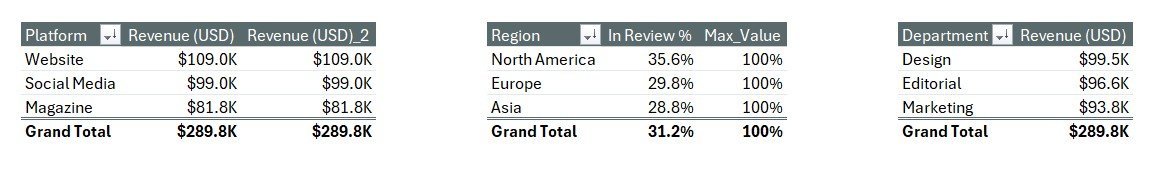
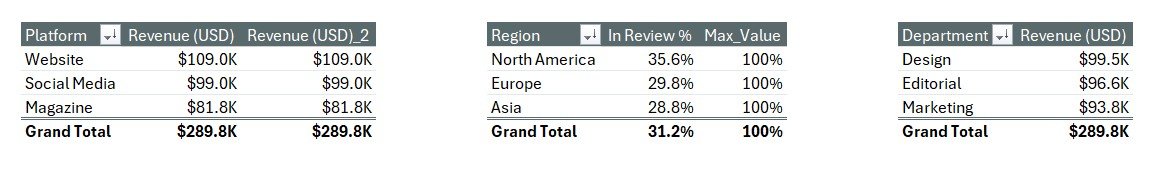
🔹 5 Pre-Built Charts – The Publishing Report in Excel includes Published % (status breakdown of titles by publication stage), Revenue by Platform (comparative revenue across distribution platforms), In Review % by Region (regional snapshot of titles currently under editorial review), Revenue by Department (revenue contribution by genre or department), and Revenue by Month (monthly revenue trend line). All five charts update instantly when new data is entered.
🔹 Dual Slicer Filtering – A right-side slicer on the Summary Page filters all five charts simultaneously. The Report Page features a dedicated left-side slicer for drilling into the Information Table by platform, region, department, or publication status.
🔹 No Add-ins or Macros Required – The Publishing Report in Excel uses native Excel features — pivot-based charts, slicers, and data validation — so it works on any standard Microsoft Excel Desktop installation on Windows or Mac.
📦 What’s Inside the Publishing Report in Excel
📑 Page 1 – Summary Page: The main analytics hub with 5 KPI cards (Published Titles, Total Revenue, In Review %, Average Revenue per Title, Platform Count), a right-side slicer panel, and 5 charts: Published %, Revenue by Platform, In Review % by Region, Revenue by Department, and Revenue by Month.
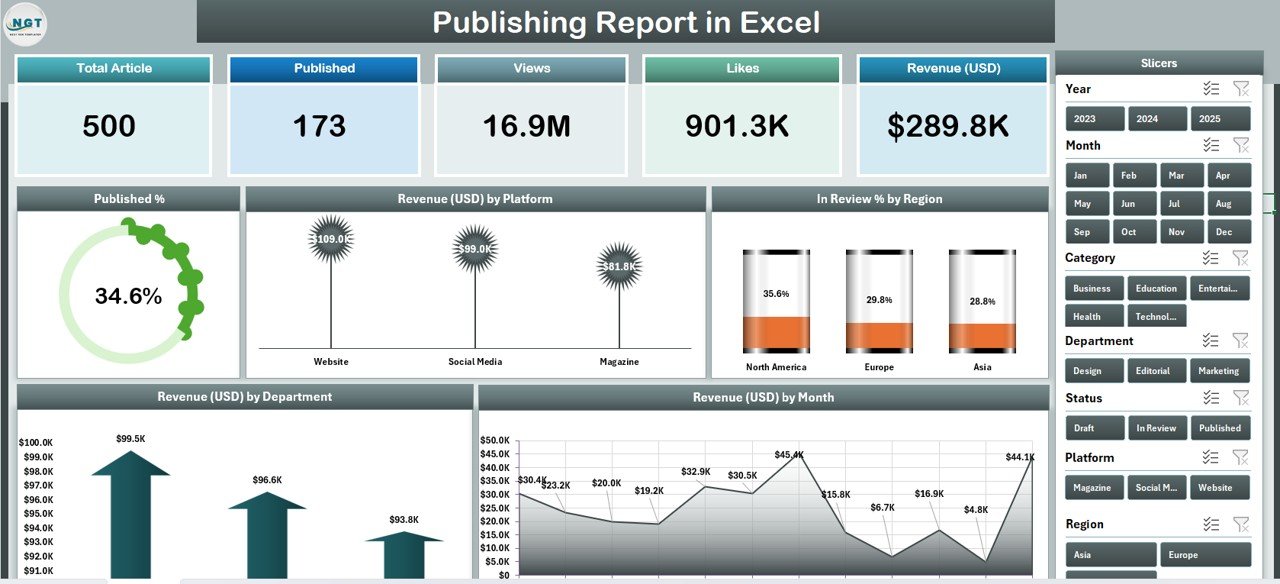
Publishing Report in Excel – Summary Page with 5 KPI Cards and 5 Charts
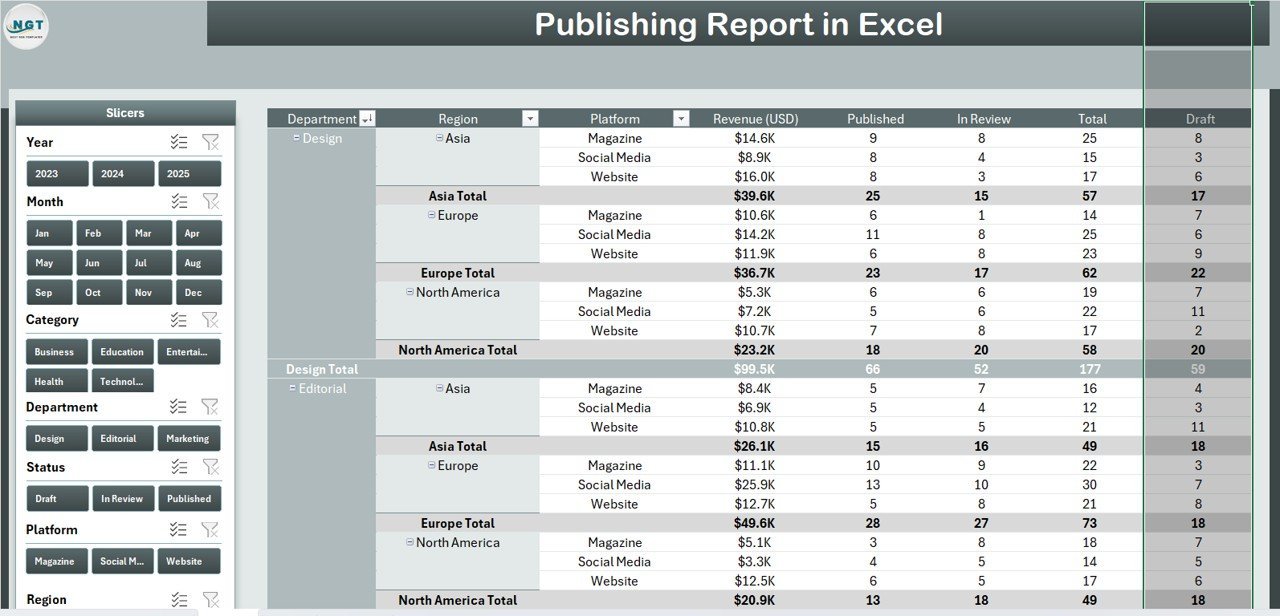
📋 Page 2 – Report Page: A clean data-driven page with a left-side slicer and a comprehensive Information Table displaying individual title records — including platform, region, department, publication status, and revenue. Ideal for editorial team reviews and stakeholder reporting.
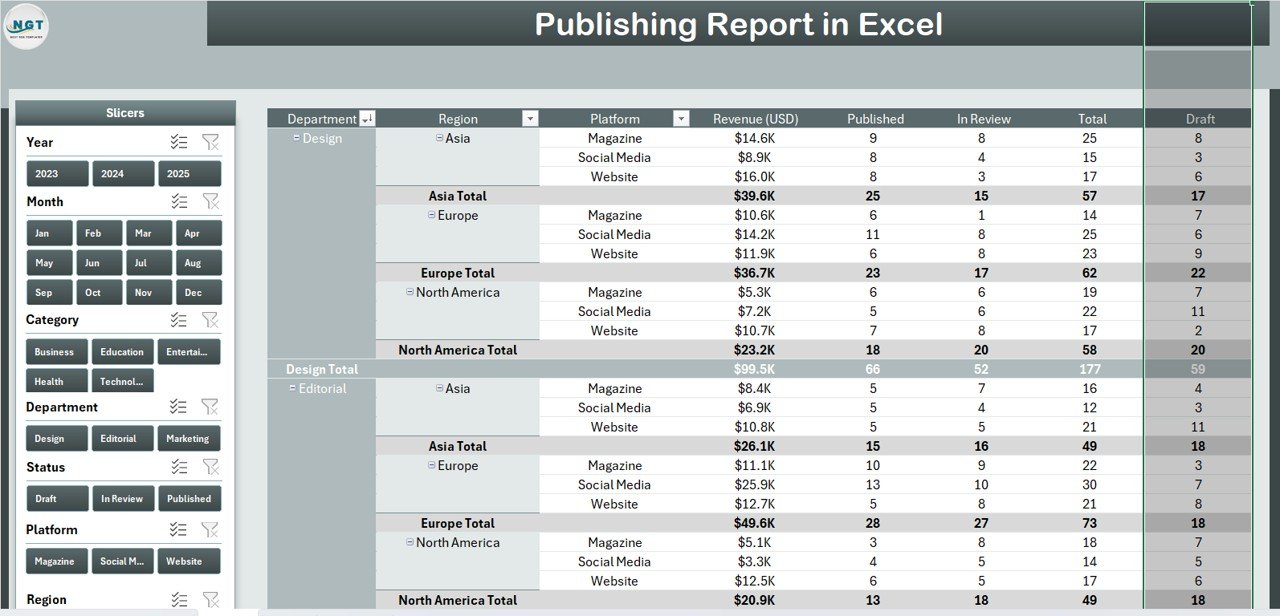
Publishing Report in Excel – Report Page with Left Slicer and Information Table
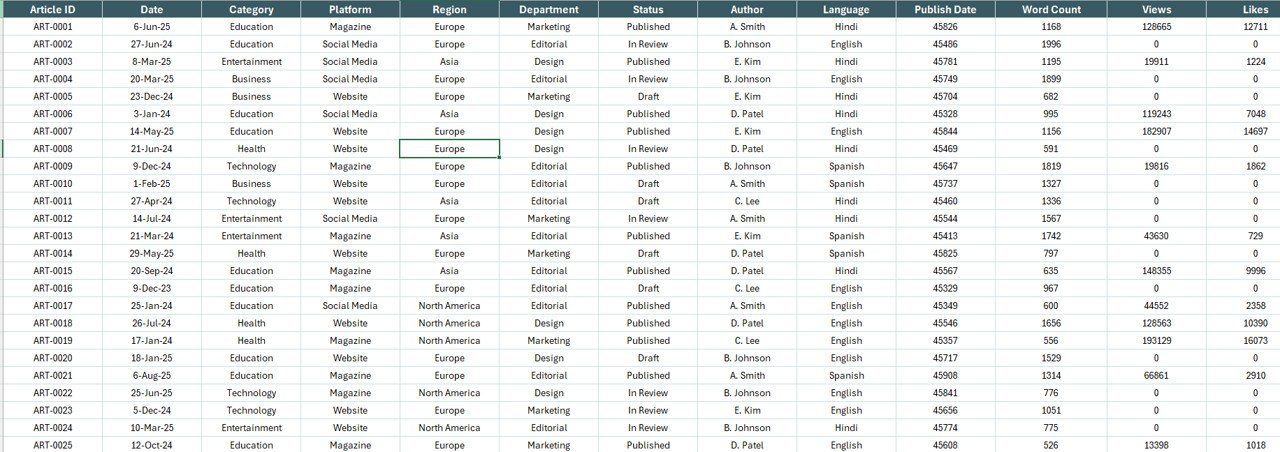
🗂️ Data Sheet: The structured input sheet where you replace sample publishing data with your own records. All charts, cards, and tables update automatically — no manual formula editing required.
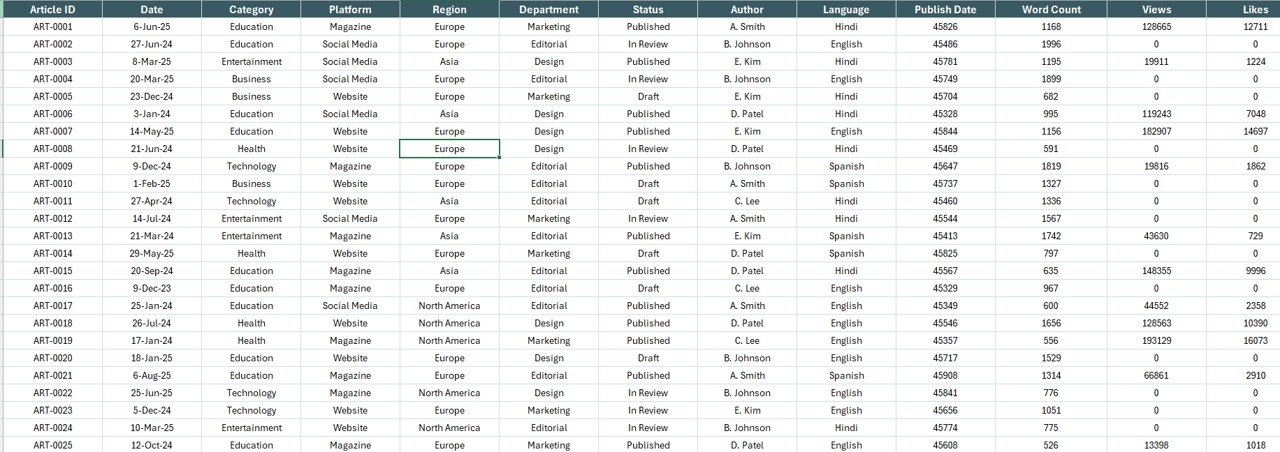
Publishing Report in Excel – Data Entry Sheet
⚙️ Support Sheet: A pre-configured reference sheet containing dropdown lists, platform names, regional categories, department values, and publication status options to keep your data consistent and error-free.
Publishing Report in Excel – Support Sheet
📊 Publishing Report in Excel vs. Google Sheets Version vs. Paid Publishing SaaS — Where This Fits
| Feature | Publishing Report in Excel | Google Sheets Version | Paid SaaS (Reedsy / PublishDrive) |
|---|---|---|---|
| Cost | $7.99 one-time | Varies | $49–$150/user/month |
| Platform | ✅ Microsoft Excel Desktop | Google Sheets (browser) | Cloud only |
| Setup time | ✅ Under 10 minutes | Similar | 1–3 weeks + training |
| Works offline | ✅ Yes – no internet needed | ❌ Requires internet | ❌ Cloud-dependent |
| Interactive slicers | ✅ Dual slicers (Summary + Report) | Limited | ✅ Advanced filters |
| Customisable fields | ✅ Fully editable | ✅ Editable | Requires admin config |
| 5 pre-built charts | ✅ Ready to use | Varies | ✅ Custom dashboards |
| Year-1 cost (5 users) | $7.99 total | ~$30–50 | $2,940–$9,000 |
| No subscription | ✅ One-time payment | ✅ | ❌ Monthly recurring |
For publishing teams that want structured Excel reporting without paying four-figure SaaS bills, the Publishing Report in Excel sits in the sweet spot.
👥 Who This Template Is For — and Who It’s Not For
✅ This template is built for:
- Publishers and editorial managers tracking title output, revenue, and review pipeline across departments
- Content strategists monitoring platform performance across Amazon, Barnes & Noble, iBooks, and regional distributors
- Self-publishers and indie imprints needing a quick revenue and publication status overview without SaaS costs
- Media analysts reporting on book and digital content performance to leadership teams
- Anyone already using Microsoft Excel who needs structured publishing analytics in one file
❌ This template is NOT for:
- Enterprise publishers needing real-time API connections to distribution platforms or live royalty feeds
- Teams requiring SOC 2 compliance, SSO, or multi-environment data pipelines
- Google Sheets users — see our Podcast Analytics Dashboard in Google Sheets for a browser-based alternative
⚙️ How to Use the Publishing Report in Excel
- Download and open the file in Microsoft Excel for Desktop.
- Navigate to the Data Sheet and replace the sample records with your own publishing data (title, platform, region, department, status, revenue).
- Use the Support Sheet to review and update dropdown reference lists (platforms, regions, departments, publication stages) if needed.
- Return to the Summary Page — all 5 KPI cards and 5 charts will update automatically with your data.
- Use the right-side slicer on the Summary Page to filter charts by platform, region, department, or status.
- Switch to the Report Page to view row-level data in the Information Table. Use the left-side slicer to drill into specific categories.
- Share or print the Summary or Report Page for editorial team reviews and stakeholder presentations.
💼 Real-World Use Cases
Amara manages editorial operations at a mid-size book publisher. Each quarter she compiles publication data from five departments — Fiction, Non-Fiction, Academic, Children’s, and Digital. Using the Publishing Report in Excel, she populates the Data Sheet in under 15 minutes, then uses the Summary Page slicers to filter Revenue by Department and present the findings to her leadership team — without paying $120/month for a publishing SaaS platform.
James is a content director at an independent digital media company. He tracks title performance across four distribution platforms monthly. The Revenue by Platform and In Review % by Region charts give him exactly the cross-platform visibility he needs, and the Information Table on the Report Page lets him drill into individual title records during team meetings.
Nina teaches publishing management at a media studies university. She uses the Publishing Report in Excel as a hands-on classroom resource — students enter real data from case studies and immediately see how platform choice correlates with revenue by region and month, making industry concepts tangible.
❓ Frequently Asked Questions
What metrics does the Publishing Report in Excel track?
The Publishing Report in Excel tracks 5 core publishing metrics — Published %, Revenue by Platform, In Review % by Region, Revenue by Department, and Revenue by Month — displayed across 5 pre-built charts on the Summary Page. Five KPI cards at the top show totals for published titles, revenue, in-review percentage, average revenue per title, and active platform count.
How many pages does this Excel report have?
The template includes 4 sheets: a Summary Page (5 KPI cards + 5 charts + right slicer), a Report Page (left slicer + Information Table), a Data Sheet for entering your own records, and a Support Sheet for reference lists and dropdown values.
Do I need any Excel add-ins or macros to use this template?
No add-ins or macros are required. The Publishing Report in Excel uses native Excel features — pivot-based charts, slicers, and data validation — so it works on any standard Microsoft Excel Desktop installation on Windows or Mac without enabling anything special.
How does this compare to publishing SaaS tools like Reedsy or PublishDrive?
Reedsy and PublishDrive start at $49–$150 per user per month and require onboarding time. The Publishing Report in Excel costs $7.99 as a one-time purchase, works offline, and is ready in under 10 minutes — making it the practical choice for small-to-mid-size publishing teams and individual analysts.
Can I add more titles or publications to the Data Sheet?
Yes. The Data Sheet is fully editable — add as many rows as needed. The Summary Page charts and the Report Page Information Table will expand and update automatically as you add new records, with no formula changes required.
What Excel version is required?
The template is built for Microsoft Excel 2016 and later (including Microsoft 365 / Excel 2019 / 2021). It works on both Windows and Mac. Excel for Web (browser) and mobile may have limited slicer support — desktop is recommended for the best experience.
Is there a Power BI version of this report available?
Currently, the Publishing Report in Excel is our primary template for this topic. For broader media industry analytics, explore our Film & Television Report in Excel which follows the same 4-sheet structure for media performance reporting.
👤 About the Author
Built by PK — Microsoft Certified Professional with 15+ years of Excel, Google Sheets, and Power BI experience. Founder of NextGenTemplates, reaching 300K+ subscribers across YouTube channels (@PK-AnExcelExpert, @NextGenTemplates, @NeoTechNavigators). Every template is hand-built and tested before release.
🔗 Explore Related Templates
If you track media and publishing performance, these related templates from our Excel Reports collection will complement this report:
- 📽️ Film & Television Report in Excel — Same 4-sheet report structure for film and TV analytics
- 🎙️ Podcast Analytics Dashboard in Google Sheets — Media content analytics for Google Sheets users
📖 Click here to read the Detailed Blog Post
🎥 Visit our YouTube channel for step-by-step video tutorials
👉 YouTube.com/@NextGenTemplates


Reviews
There are no reviews yet.