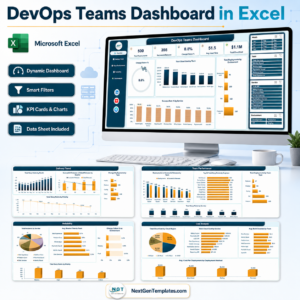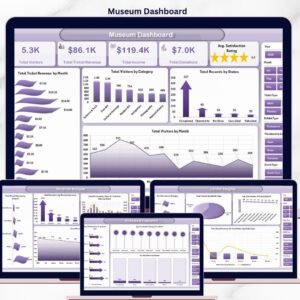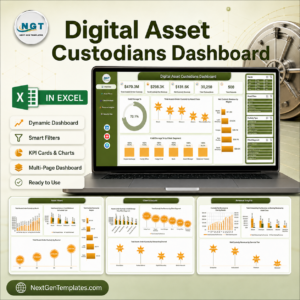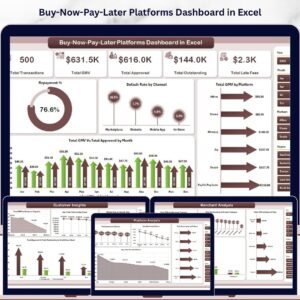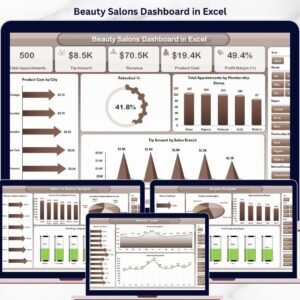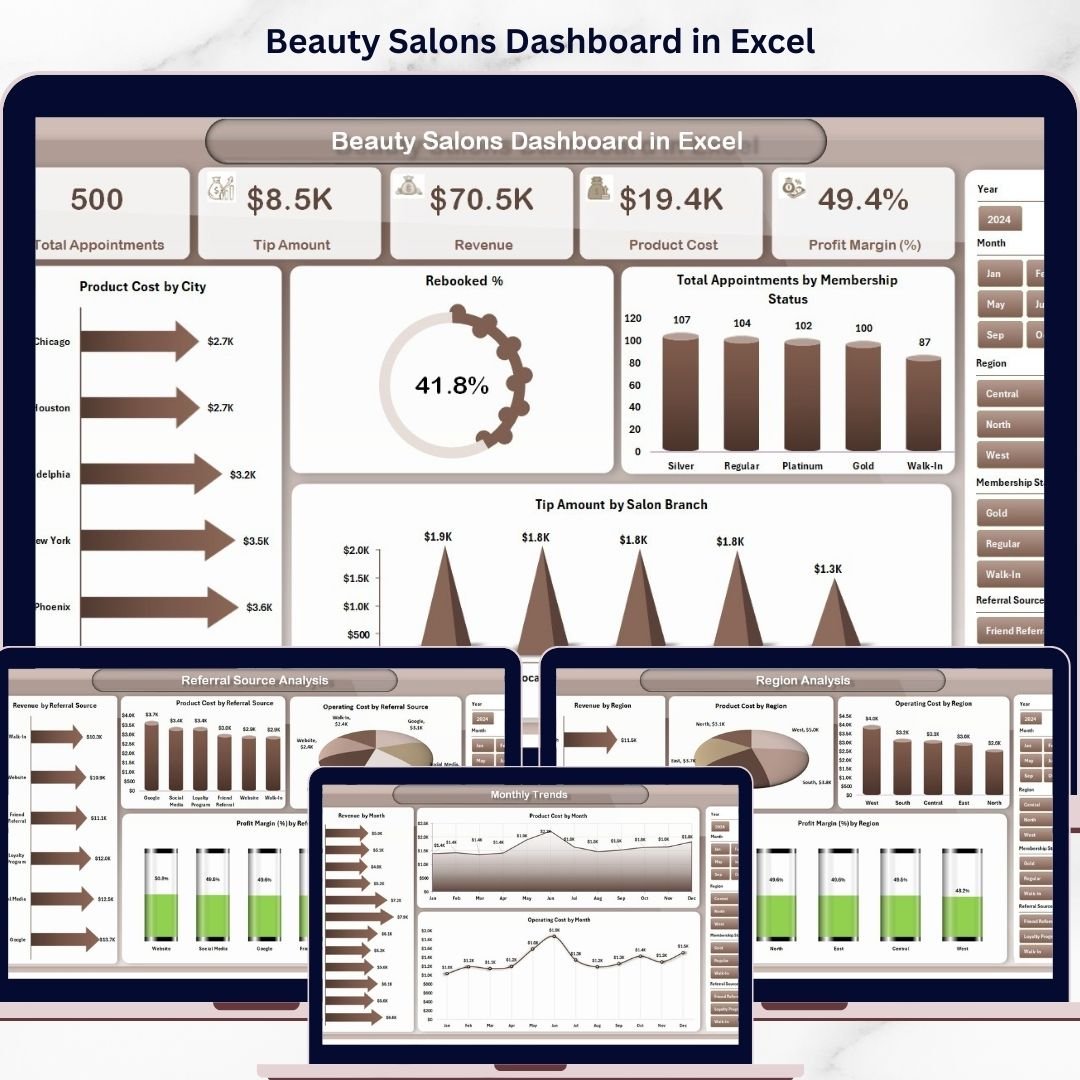



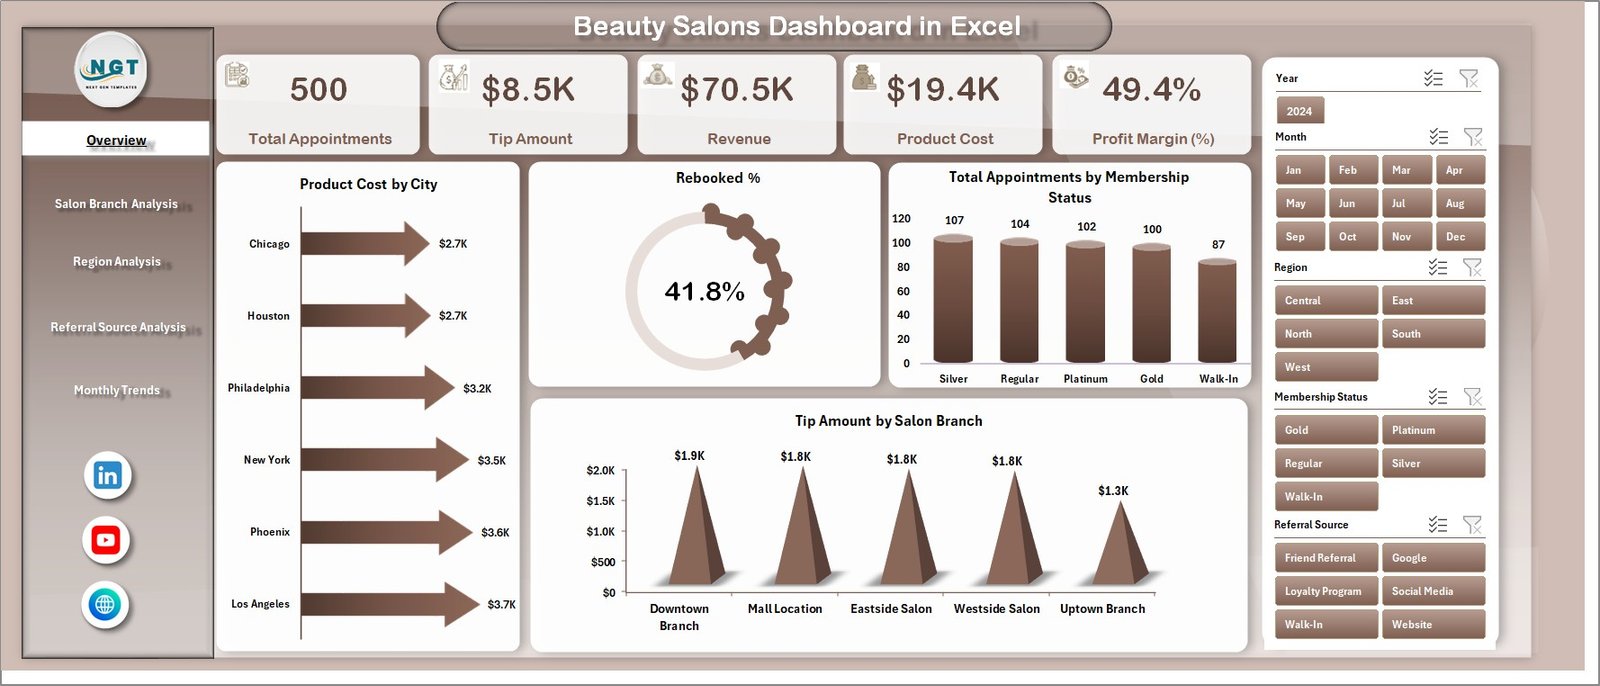
Run your salon like a pro with the Beauty Salons Dashboard in Excel 🚀. In today’s competitive beauty industry, managing appointments, revenue, costs, and customer trends can quickly become overwhelming.
However, this powerful and ready-to-use Excel dashboard simplifies everything. It converts your salon data into clear visuals, actionable insights, and structured reports—all in one place.
With this dashboard, you can track revenue, appointments, rebooking rates, product costs, and branch performance effortlessly. As a result, you can make faster, smarter, and data-driven decisions to grow your salon business.
🚀 Key Feature of Beauty Salons Dashboard in Excel
✅ 📊 Interactive Excel Dashboard
Visualize salon performance using dynamic charts and slicers.
✅ 📈 Complete KPI Tracking
Track revenue, appointments, rebooking %, and profit in one place.
✅ 📅 Multi-Page Dashboard Structure
Explore insights across 5 structured analytical pages.
✅ 🔍 Smart Filtering with Slicers
Filter data instantly for customized analysis.
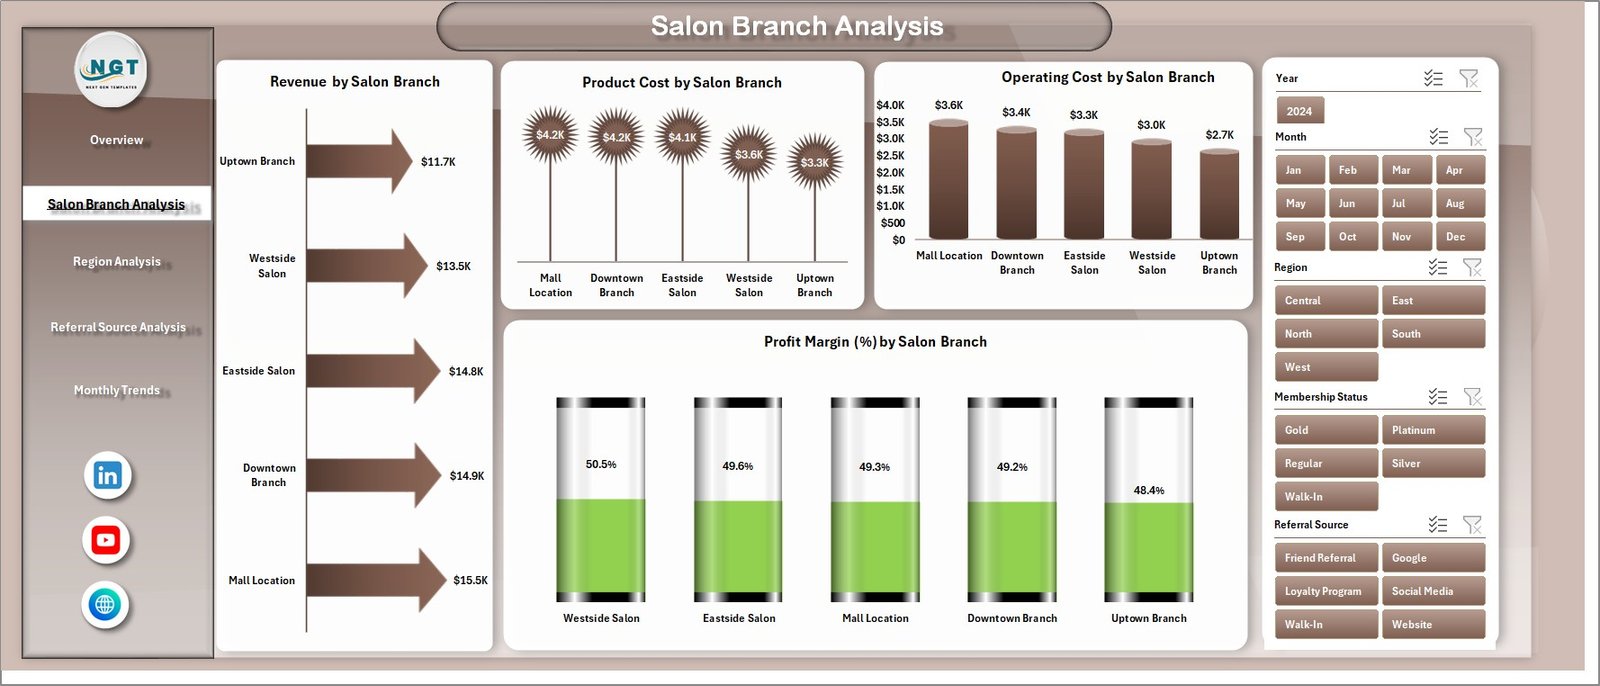
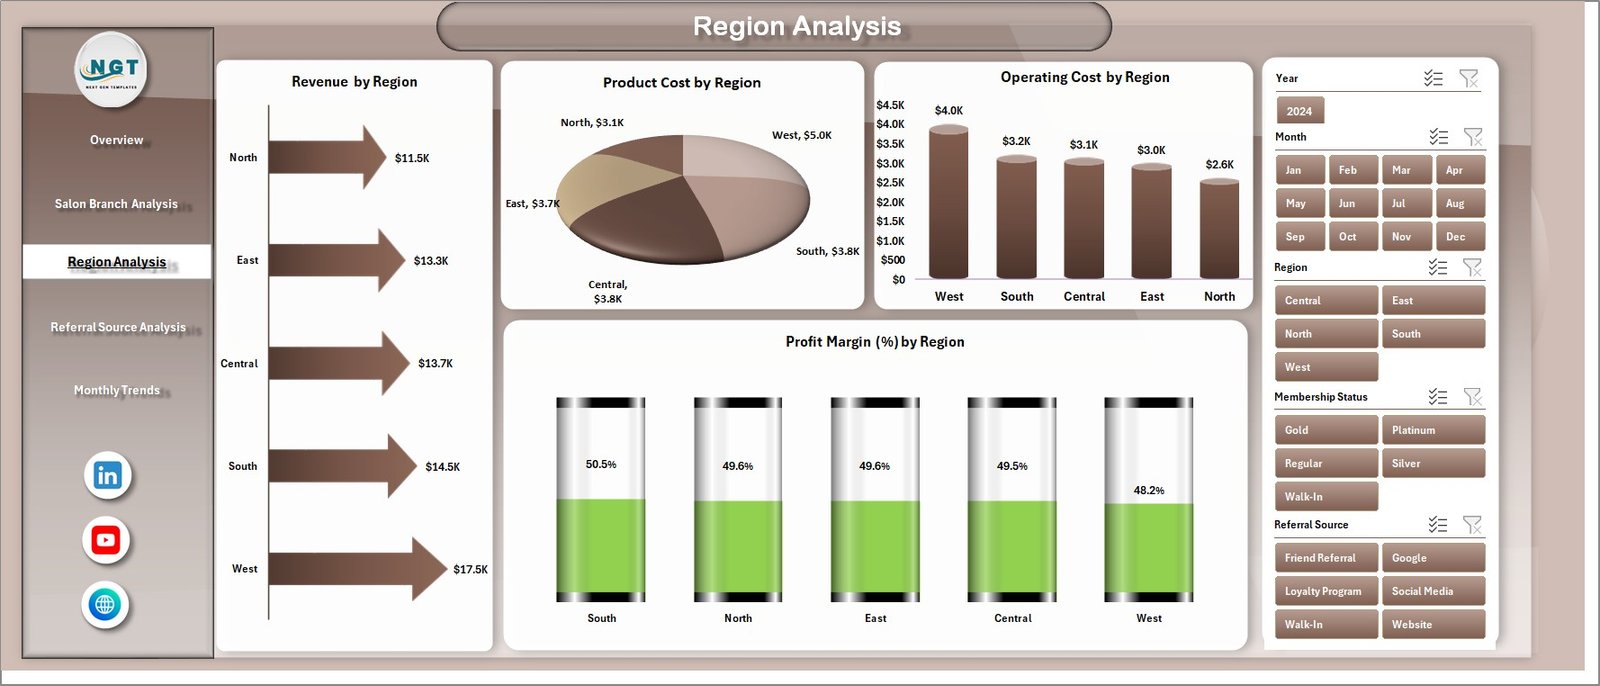
✅ 🏬 Branch & Region Insights
Analyze performance across salon branches and regions.
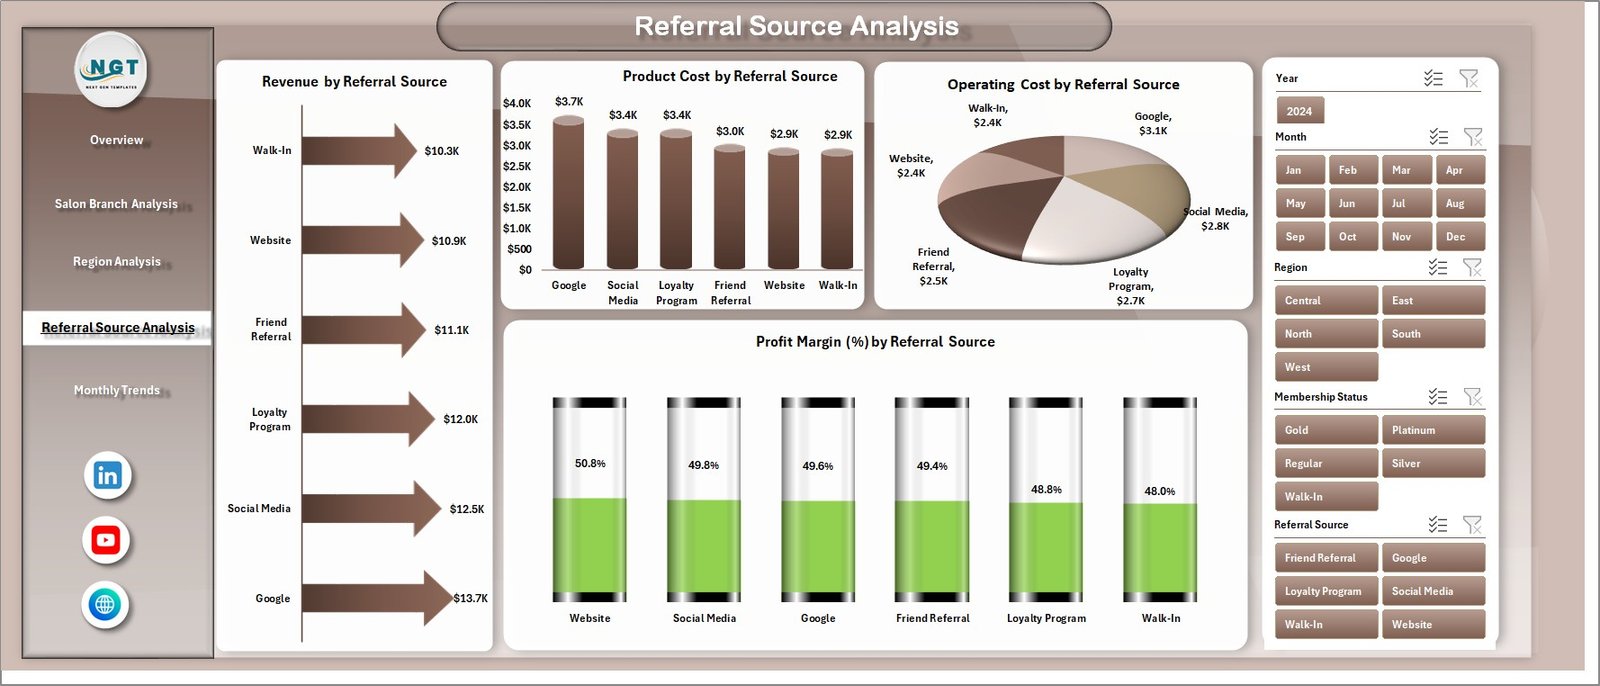
✅ 🔗 Referral Source Analysis
Understand customer acquisition and marketing effectiveness.
✅ 📂 Organized Data Structure
Separate Data and Support sheets for efficient management.
📦 What’s Inside the Beauty Salons Dashboard in Excel
This template includes 5 powerful analytical pages:
📊 Overview Page – Snapshot of salon performance with KPI cards
🏬 Salon Branch Analysis – Compare performance across branches
🌍 Region Analysis – Evaluate business across locations
🔗 Referral Source Analysis – Analyze customer acquisition channels
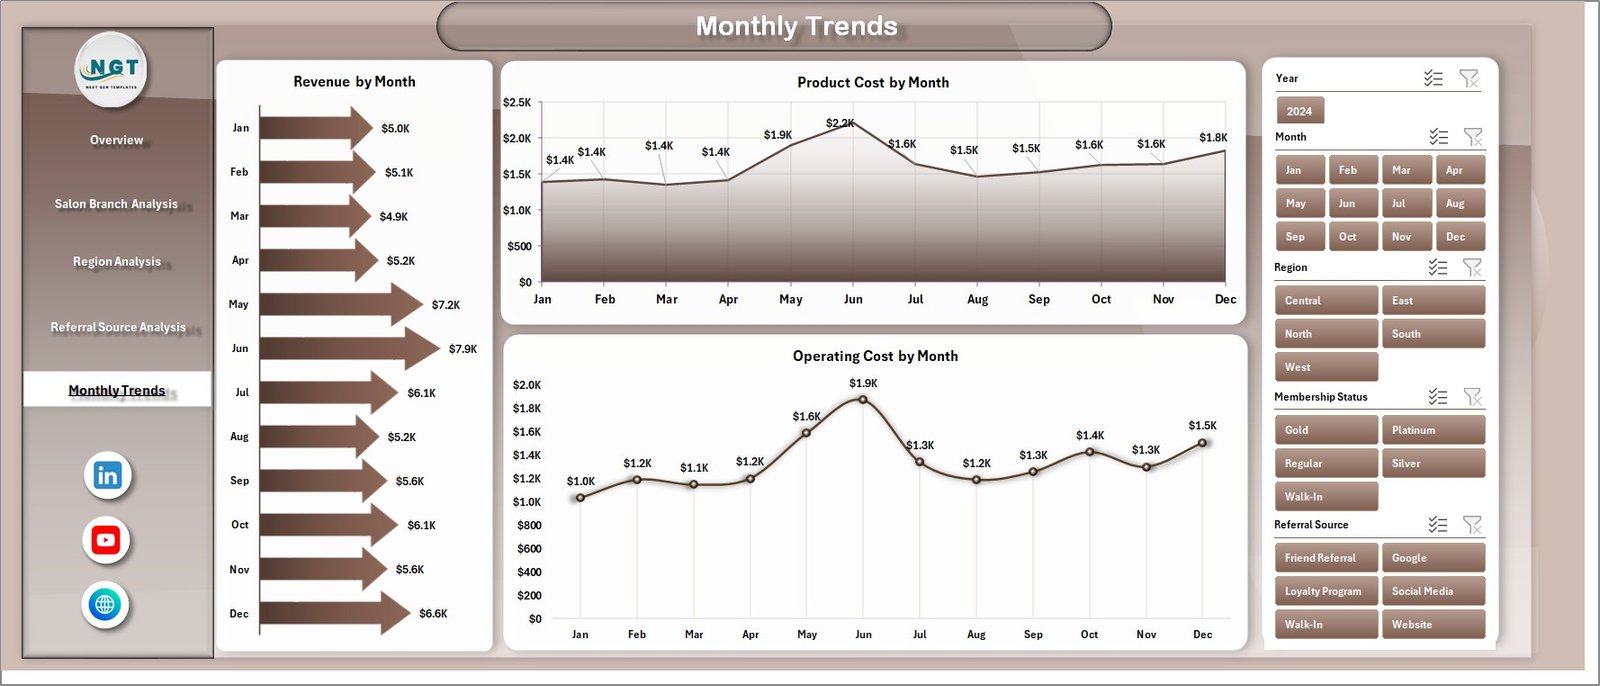
📅 Month Analysis – Track trends and growth over time
📂 Additional Sheets:
Data Sheet – Stores all raw salon data
Support Sheet – Handles calculations and backend logic
Everything is designed to give you a complete 360° salon performance view.
⚙️ How to Use the Beauty Salons Dashboard in Excel
Getting started is quick and simple:
👉 Enter your data in the Data Sheet
👉 Calculations update automatically in the Support Sheet
👉 Use slicers to filter by branch, region, or referral source
👉 Analyze KPI cards and charts
👉 Track trends and optimize performance
Within minutes, you can turn raw salon data into powerful business insights 💡.
👩💼 Who Can Benefit from This Beauty Salons Dashboard in Excel
This dashboard is perfect for:
💄 Salon Owners – Monitor overall business performance
👩💼 Salon Managers – Track operations and staff efficiency
📊 Business Analysts – Analyze trends and KPIs
📈 Marketing Teams – Evaluate referral sources and campaigns
🏬 Multi-Branch Operators – Compare branch performance
💼 Entrepreneurs – Grow and scale salon businesses
Anyone looking to improve efficiency, profitability, and customer experience will benefit from this tool.
🔗 Click hare to read the Detailed blog post
Explore the full guide with detailed features, benefits, and best practices.
👉 Visit our YouTube channel to learn step-by-step video tutorials:
https://youtube.com/@PKAnExcelExpert
Watch the step-by-step video tutorial:
Compatibility and Requirements
- Works in Microsoft Excel desktop (Excel 2016 or later, or Microsoft 365).
- Slicers filter the dashboard by branch, region and referral source. Microsoft explains them in Use slicers to filter data.
Frequently Asked Questions
How many dashboard pages does it have?
Five analytical pages: Overview, Salon Branch Analysis, Region Analysis, Referral Source Analysis and Month Analysis. It also has a Data Sheet and a Support Sheet.
Where do I enter my salon data?
Enter it in the Data Sheet. The calculations in the Support Sheet update from that data, and the dashboard pages follow.
Can I compare branches and regions?
Yes. The Salon Branch Analysis and Region Analysis pages compare performance across locations, and slicers let you filter by branch or region.
Can I see which referral sources bring in customers?
Yes. The Referral Source Analysis page shows how customers find the salon, so you can see which channels work.
Is there a Power BI or Google Sheets version?
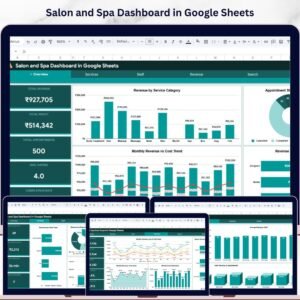
There is a Beauty Salons Dashboard in Power BI. For Google Sheets, see the Salon and Spa Dashboard in Google Sheets.
Related Salon and Beauty Templates
- Beauty Salons Dashboard in Power BI: the same dashboard in Power BI
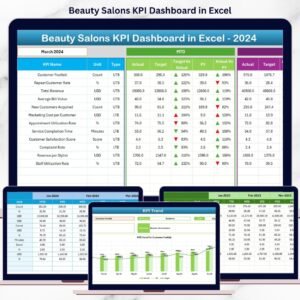
- Beauty Salons KPI Dashboard in Excel: a KPI-focused view for salons
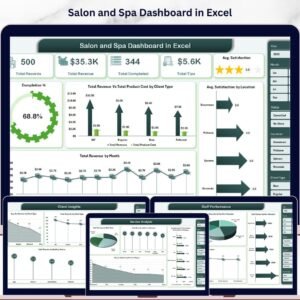
- Salon and Spa Dashboard in Excel: a dashboard for salons and spas
- Salon Appointment Data Entry System in Excel: enter appointments in a form
- Salon Product Stock Data Entry System in Excel: track product stock
Browse all Excel dashboards.