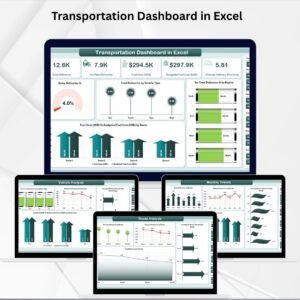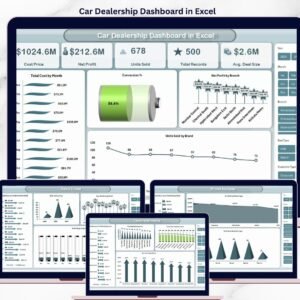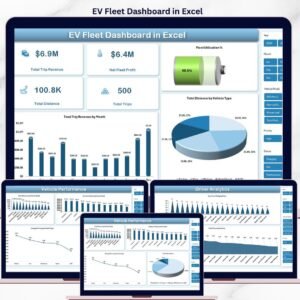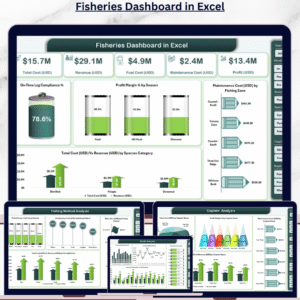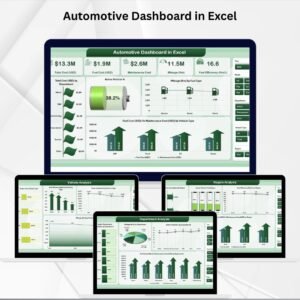
Managing automotive operations isn’t just about keeping vehicles on the road—it’s about controlling costs, optimizing performance, and making data-driven decisions. Without a clear reporting system, managers risk losing track of fuel expenses, maintenance schedules, and fleet utilization. That’s why the Automotive Dashboard in Excel is the perfect solution.
This ready-to-use dashboard transforms raw automotive data into interactive KPIs, charts, and reports. Built entirely in Excel, it provides real-time visibility into costs, performance, and trends—without the need for expensive software. From department-level cost analysis to vehicle-level fuel efficiency, this tool helps businesses stay efficient and profitable.
✨ Key Features of the Automotive Dashboard in Excel
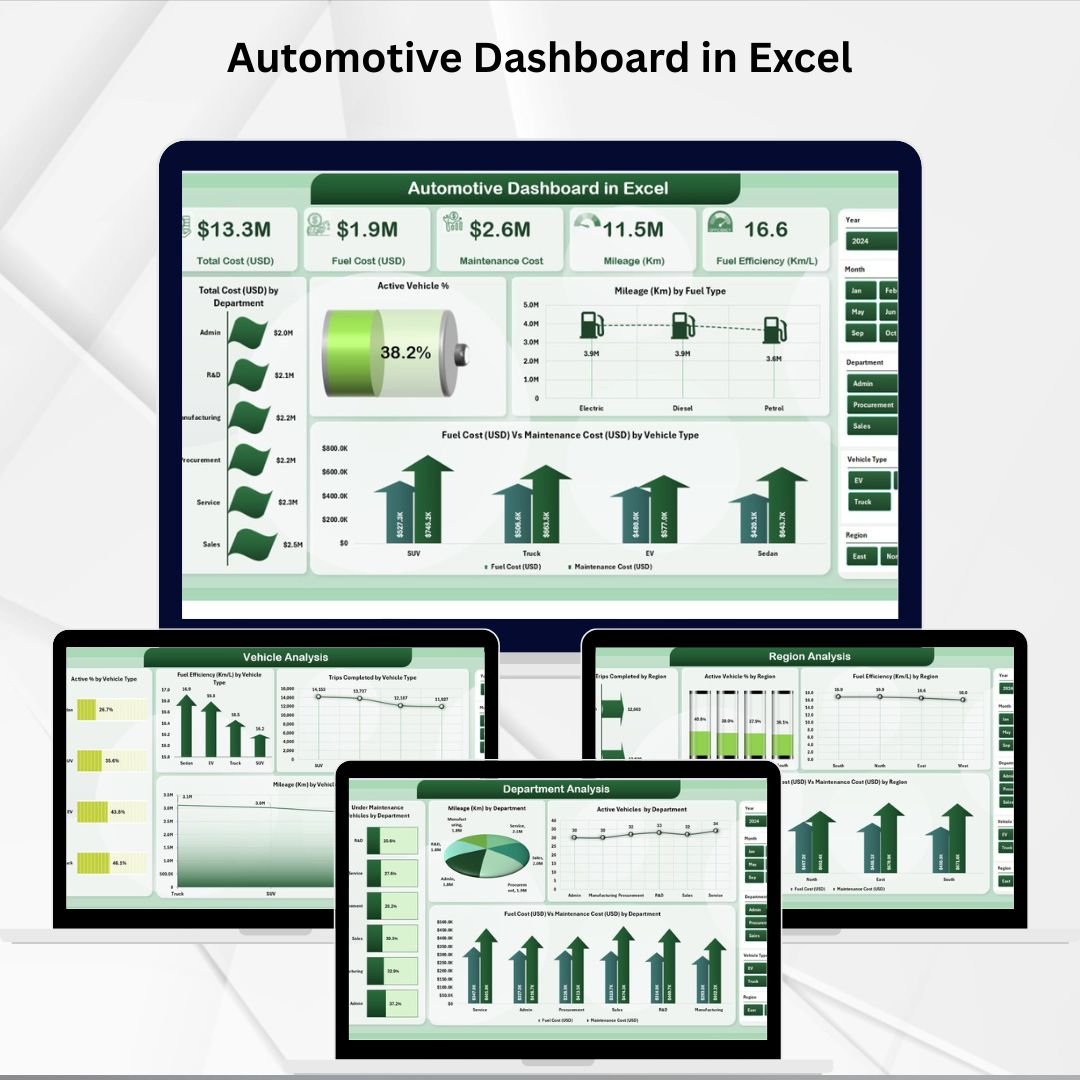
📊 Five Analytical Pages – Overview, Department Analysis, Region Analysis, Vehicle Analysis, and Monthly Trends.
📝 Data & Support Sheets – Store raw data and reference lists for accurate and consistent reporting.
⚡ KPI Cards – Quick insights on total cost, active vehicle %, maintenance vs fuel costs, and more.
📈 Interactive Charts – Compare costs, mileage, trips, and efficiency across departments, vehicles, and regions.
🎛️ Slicers & Filters – One-click insights by department, region, vehicle type, or time period.
🖥️ Excel-Based – No new software required; user-friendly and customizable.
🛠️ Pivot-Driven Automation – Update your data sheet, and all visuals refresh instantly.
📦 What’s Inside the Automotive Dashboard
This dashboard template includes five main pages supported by backend data sheets:
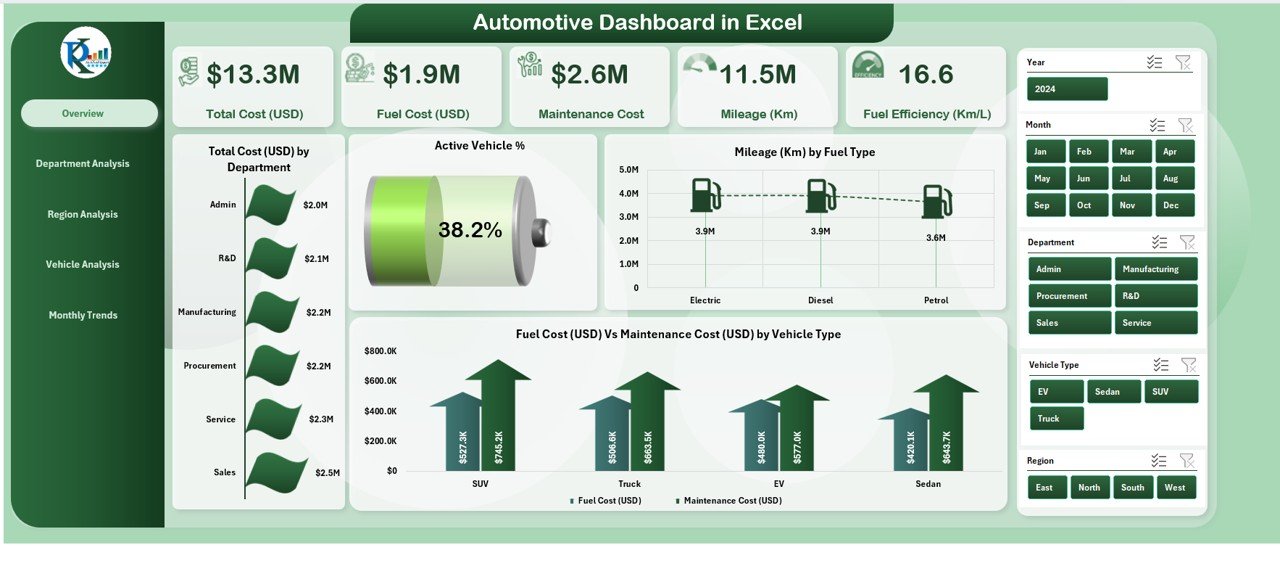
Overview Page –
5 KPI cards (e.g., total cost, active vehicles %).
Charts: Total cost by department, Active Vehicle %, Mileage by fuel type, Fuel vs Maintenance cost.
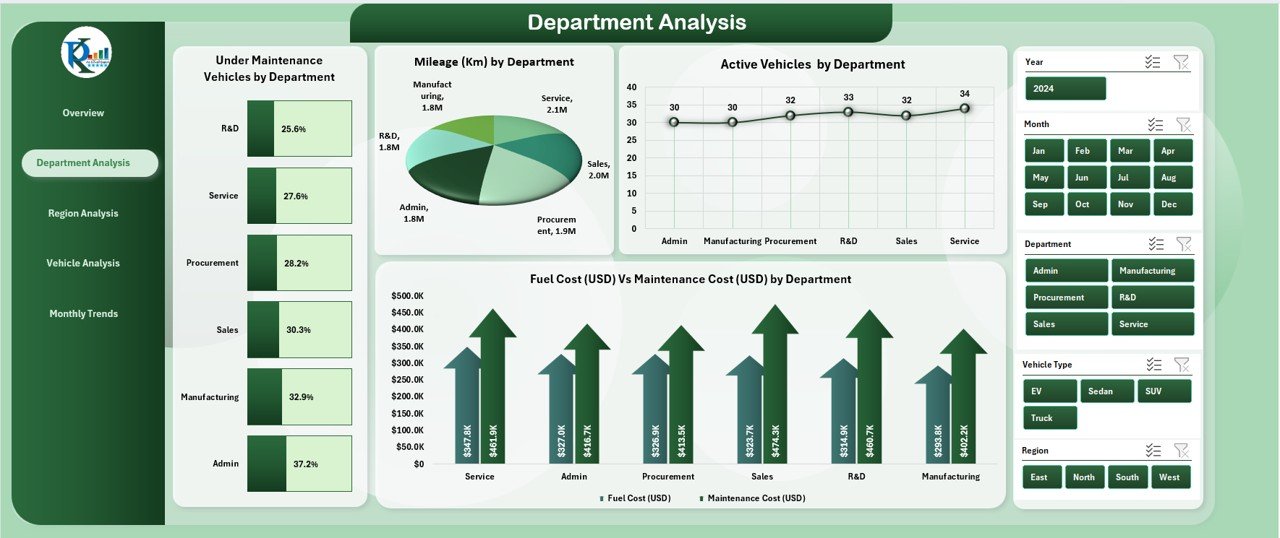
Department Analysis –
Vehicles under maintenance by department.
Mileage and costs split by department.
Identify high-performing and high-cost departments.
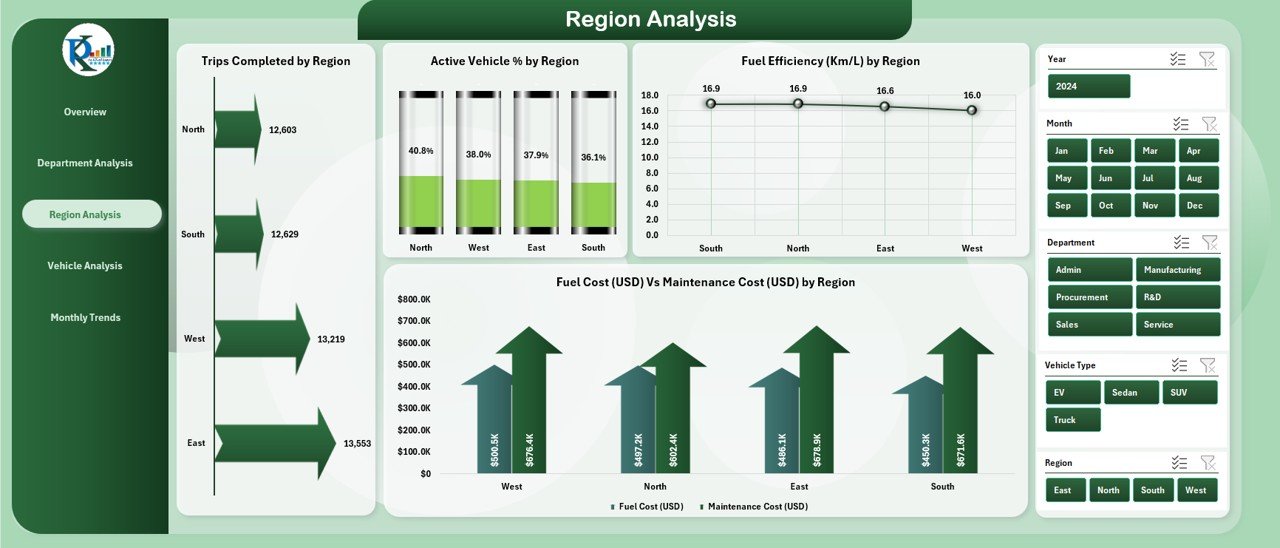
Region Analysis –
Trips completed by region.
Active vehicle % by region.
Fuel efficiency comparisons.
Fuel vs maintenance cost by region.
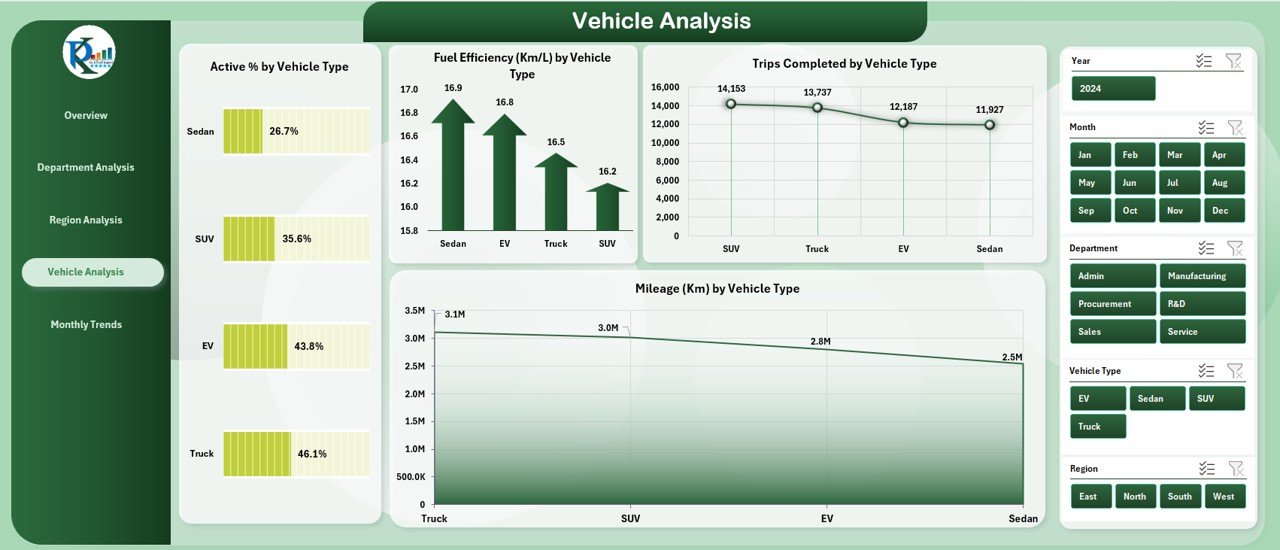
Vehicle Analysis –
Active % by vehicle type.
Trips completed by vehicle type.
Mileage and efficiency by vehicle category.
Spot underperforming vehicles quickly.
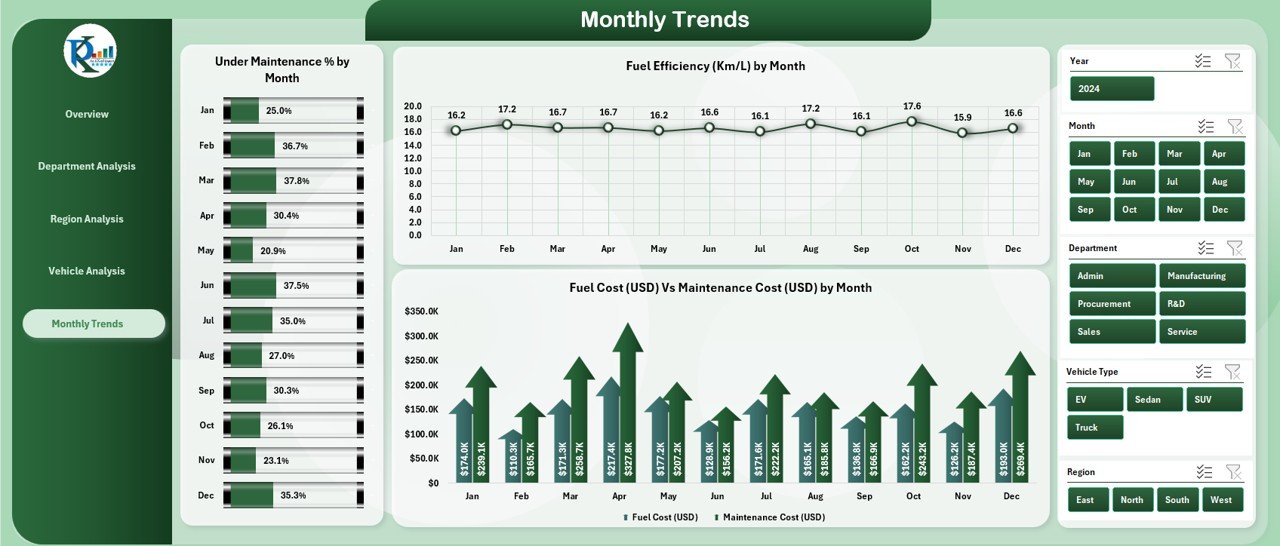
Monthly Trends –
Track fuel efficiency over months.
Compare monthly fuel vs maintenance costs.
Identify long-term patterns and forecast future needs.
Data Sheet – Input details like vehicle info, maintenance costs, fuel consumption, trips, and department/region data.
Support Sheet – Reference lists for departments, regions, and vehicle types to maintain consistency.
🛠️ How to Use the Automotive Dashboard
Enter Data – Add vehicle, fuel, cost, and trip details in the Data Sheet.
View Insights – Navigate to the Overview page for a snapshot of KPIs.
Analyze Deeply – Use Department, Region, or Vehicle pages to identify trends and issues.
Track Over Time – Explore Monthly Trends to forecast and budget.
Customize – Add your own KPIs, edit visuals, or expand with Power BI integration.
Within minutes, you’ll have actionable insights for better fleet and cost management.
👥 Who Can Benefit from This Dashboard
Fleet Managers – Monitor vehicle utilization, costs, and efficiency.
Transport & Logistics Companies – Optimize regional operations and resource allocation.
Finance Teams – Track expenses and compare maintenance vs fuel costs.
Corporate Departments – Manage departmental vehicle budgets and usage.
Small & Medium Businesses – Affordable solution without investing in complex tools.
📖 Click here to read the Detailed blog post
🎥 Visit our YouTube channel to learn step-by-step video tutorials