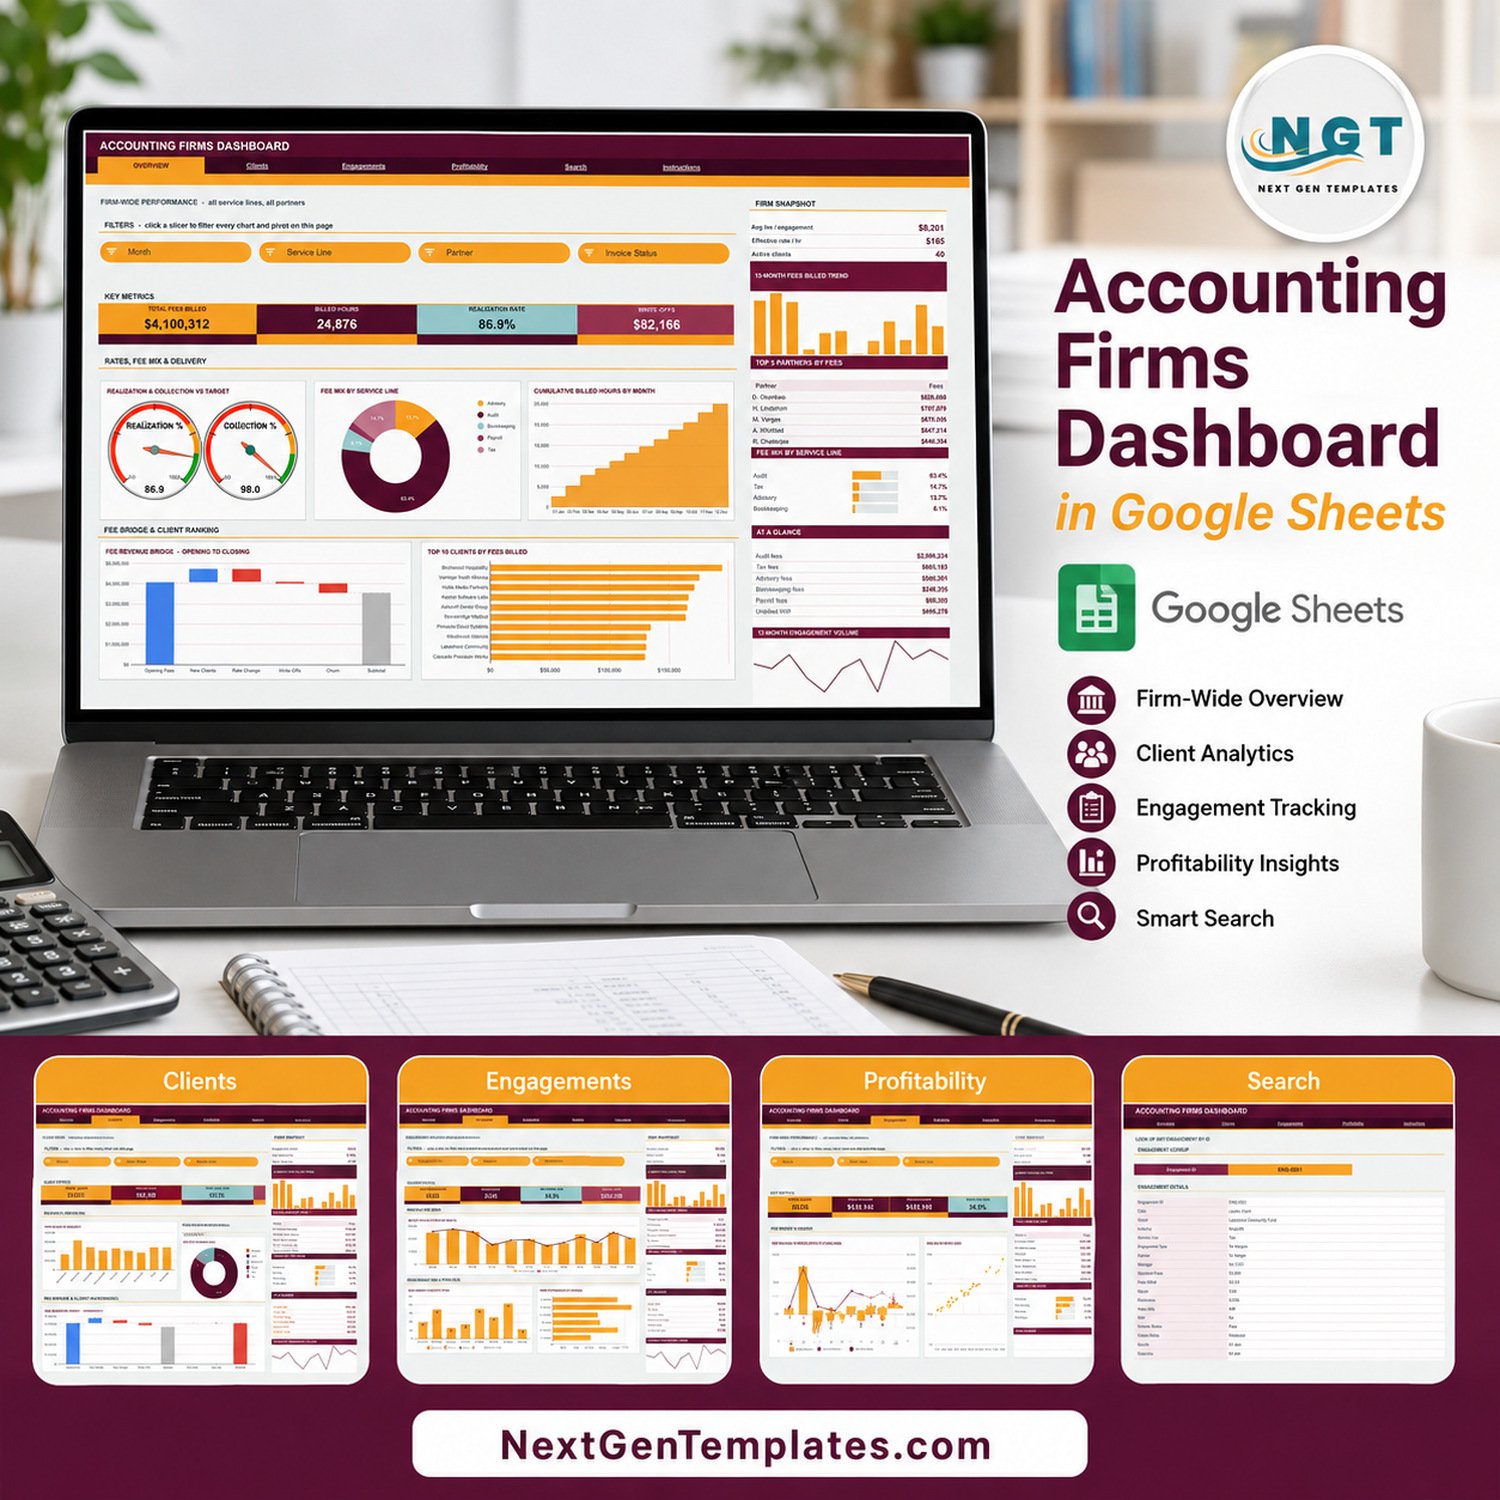
The Accounting Firms Dashboard in Google Sheets turns an engagement log into a six-page practice report: 500 sample engagements, 16 KPI cards, 17 chart panels and 15 slicers, all driven by native Google Sheets pivot tables. The sample firm covers 40 clients, 9 industries, 5 service lines, 8 engagement types and 6 partners across the 2024 calendar year, and every pivot, slicer and formula already reaches 1,000 data rows. Make your copy, paste your engagements over the sample rows and the whole workbook redraws itself.
🌍 Join 8,400+ teams in 40+ countries using NextGenTemplates to replace paid SaaS tools with one-time-purchase Excel, Google Sheets, Power BI and HTML templates.
✅ Instant download · One-time payment · No subscription · No per-user fees · Lifetime access
🔑 Key Features of the Accounting Firms Dashboard in Google Sheets
🔹 Four analysis pages, four KPI cards each. Overview reports Total Fees Billed, Billed Hours, Realization Rate and Write-Offs. Clients reports Active Clients, Fees per Client, New Client Fees and Churned Fees. Engagements reports Total Engagements, Billed Hours, Avg Hours / Job and Unbilled WIP. Profitability reports Net Fees, Effective Rate / Hr, Write-Off Rate and Realization Rate.
🔹 Realization, write-offs and WIP in one place. The three numbers a practice lives on sit side by side: realization against standard fees, write-offs by partner and service line, and unbilled work in progress by partner.
🔹 Native pivot tables and slicers, no helper formulas behind the charts. Each chart reads a pivot table parked to the right of its page, so the file stays fast as the log grows. Fifteen slicers sit in the FILTERS strips: Month, Service Line, Partner, Invoice Status, Industry, Client Status, Engagement Type and Manager, applied per page.
🔹 Honest about what the cards do. The KPI cards and the AT A GLANCE lists use SUMIFS and COUNTIFS on the Data sheet, so they always show unfiltered firm totals by design. The charts, pivots and sidebar Top 5 panels are slicer-aware and move together. The built-in Instructions page says this in plain words.
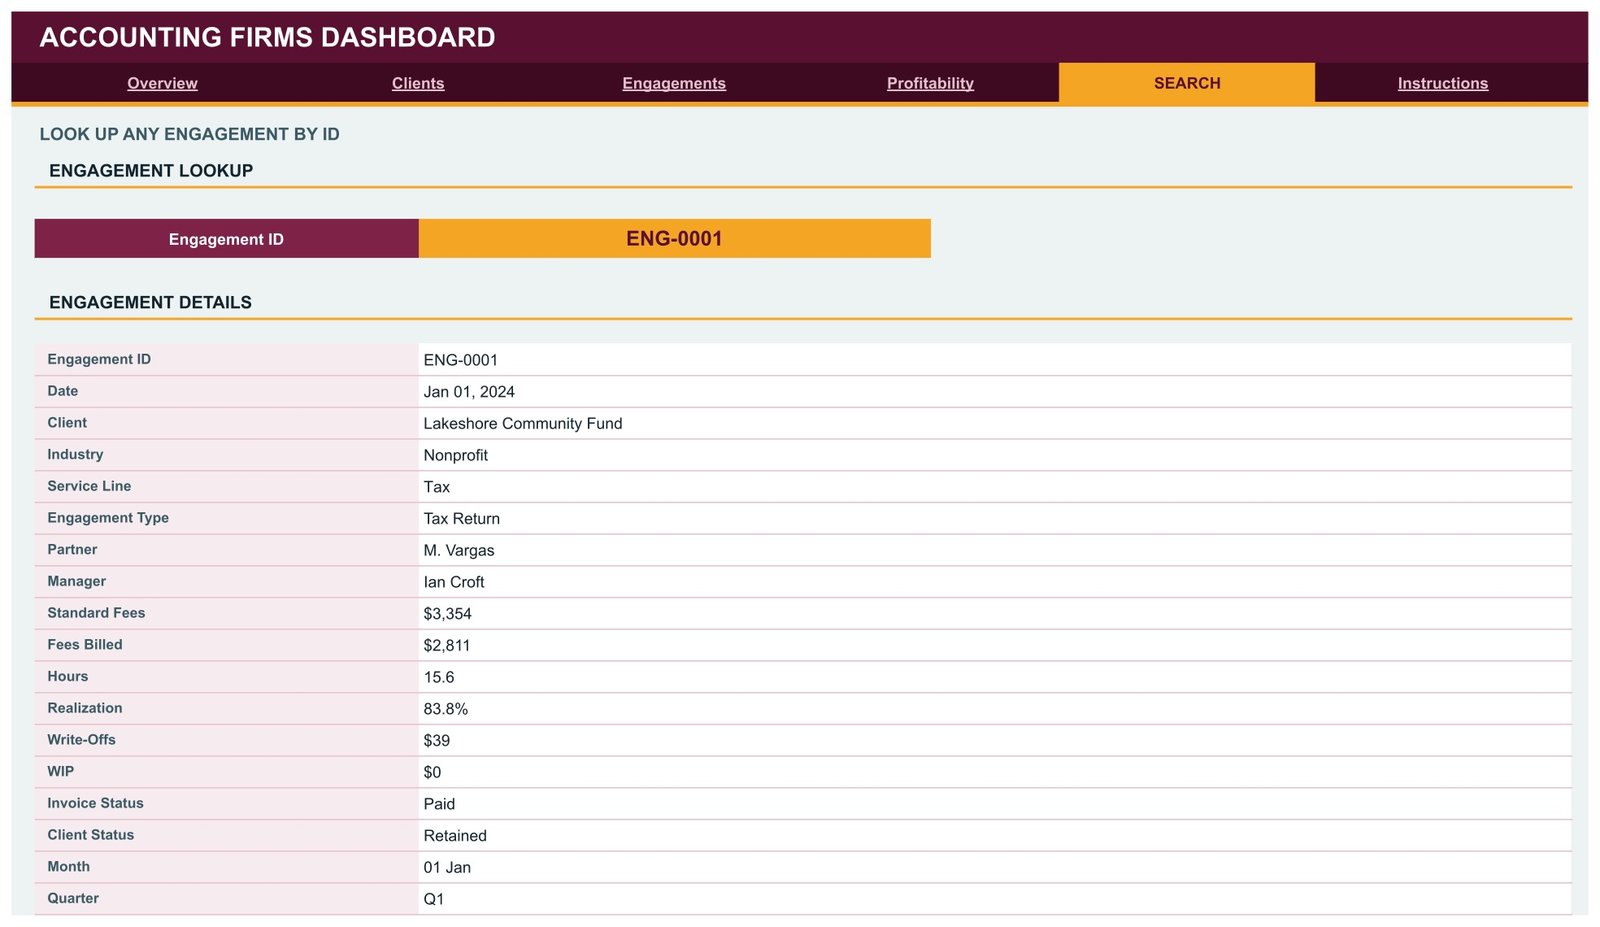
🔹 An engagement-level Search page. Pick any Engagement ID (the sample runs ENG-0001 upward) and read the full 18-field record: date, client, industry, service line, engagement type, partner, manager, standard fees, fees billed, hours, realization, write-offs, WIP, invoice status, client status, month and quarter.
🔹 Auto-expanding to 1,000 rows. Paste new engagements anywhere up to row 1001 and every pivot, slicer, chart and formula picks them up with no re-ranging.
🔹 Recolour it in one place. The build ships in a rose and amber scheme (#5A1030 with #F5A524 and a soft teal #9AD1D4 for second series). Edit the palette at the top of the bundled script and the workbook follows.
🧾 What This Template Does, and What It Deliberately Does Not Do
This is a reporting template for an accounting practice’s engagement log. It summarises fees, hours, realization, write-offs, WIP, client mix and partner workload. It is not practice-management, time-and-billing, invoicing or general-ledger software. It captures no timesheets, raises no invoices, posts nothing to your books and connects to no accounting, tax or practice system. It gives no accounting, tax or audit advice, it is not audit evidence, and it makes no claim of conformity with GAAP, IFRS, AICPA, ICAEW or any professional standard.
Mind client confidentiality before you paste real data. The Data sheet holds client names, partner initials and manager names (all fictional in the sample), and the Search page prints a named engagement record. There are no tax identifiers, bank details, addresses or financial statements anywhere in the file. If your engagement letters treat client identity as confidential, use an internal client code instead of the name. Every chart, pivot and the Search lookup work identically with codes, and a Google Sheet is only as private as your Drive sharing settings.
📦 What’s Inside the Accounting Firms Dashboard in Google Sheets
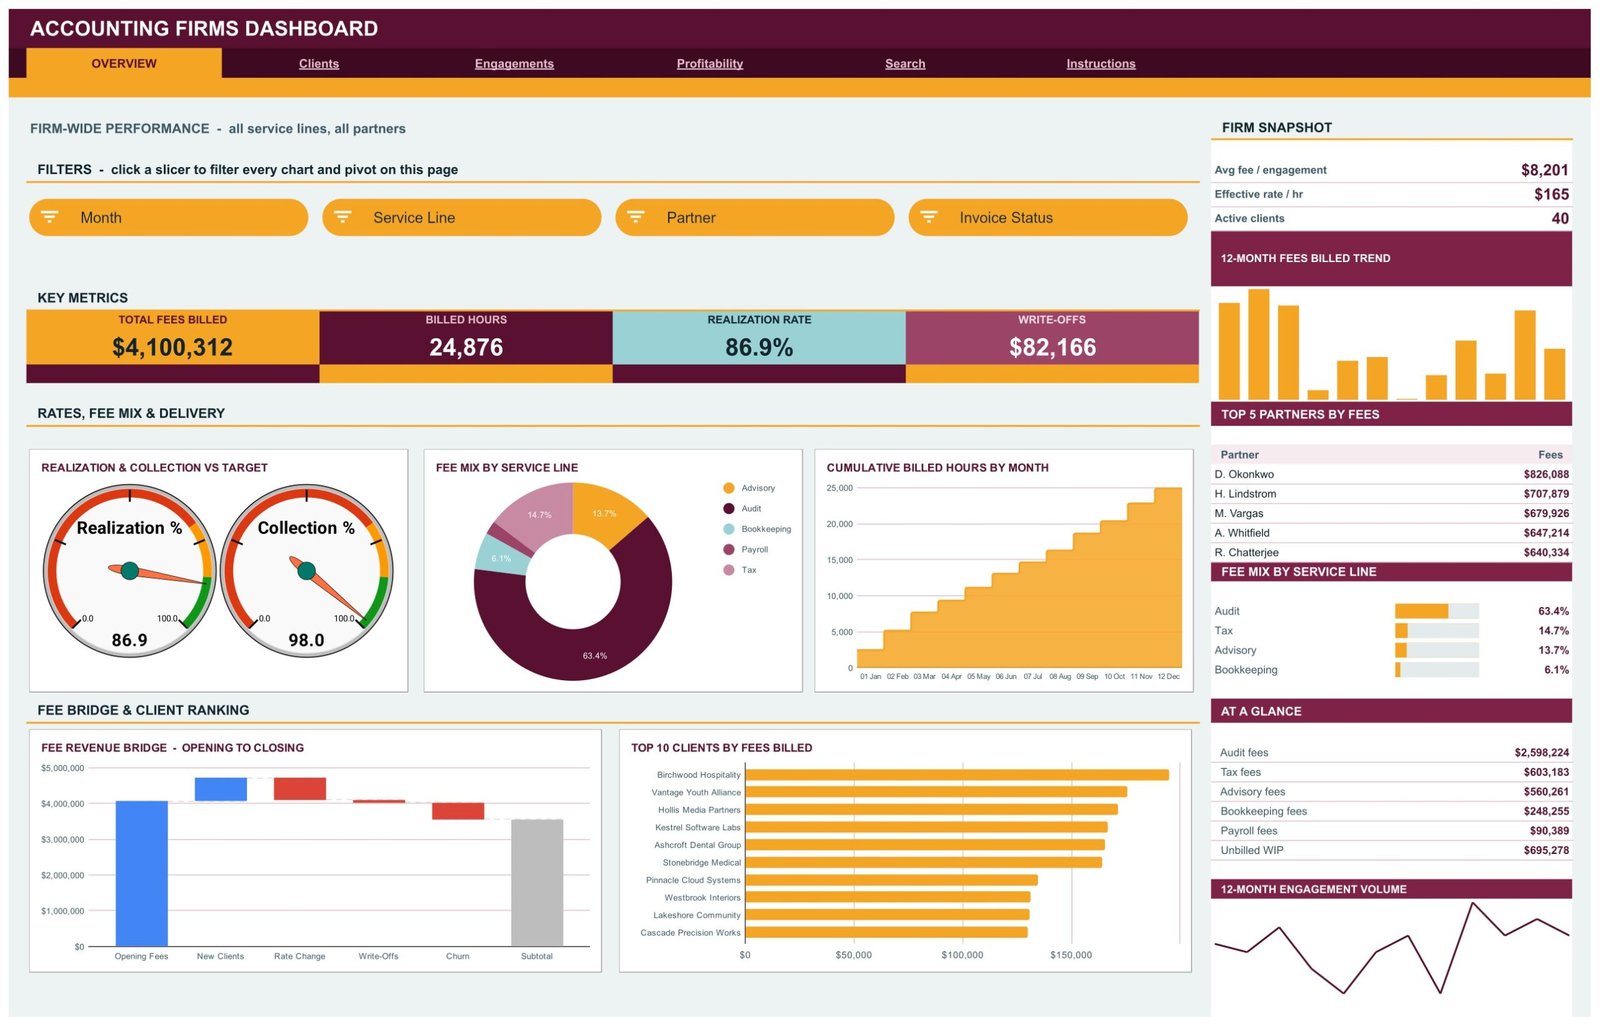
Page 1: Overview, firm-wide rates, fee mix and the fee bridge
Four KPI cards (Total Fees Billed $4,100,312, Billed Hours 24,876, Realization Rate 86.9%, Write-Offs $82,166) sit under Month, Service Line, Partner and Invoice Status slicers. Charts are Realization & Collection vs Target (two gauges reading 86.9 and 98.0), Fee Mix by Service Line, Cumulative Billed Hours by Month, Fee Revenue Bridge from opening to closing, and Top 10 Clients by Fees Billed. The sidebar carries a Firm Snapshot (average fee per engagement $8,201, effective rate $165 per hour, 40 active clients), a 12-Month Fees Billed Trend, Top 5 Partners by Fees, a service-line fee mix and an At a Glance panel.
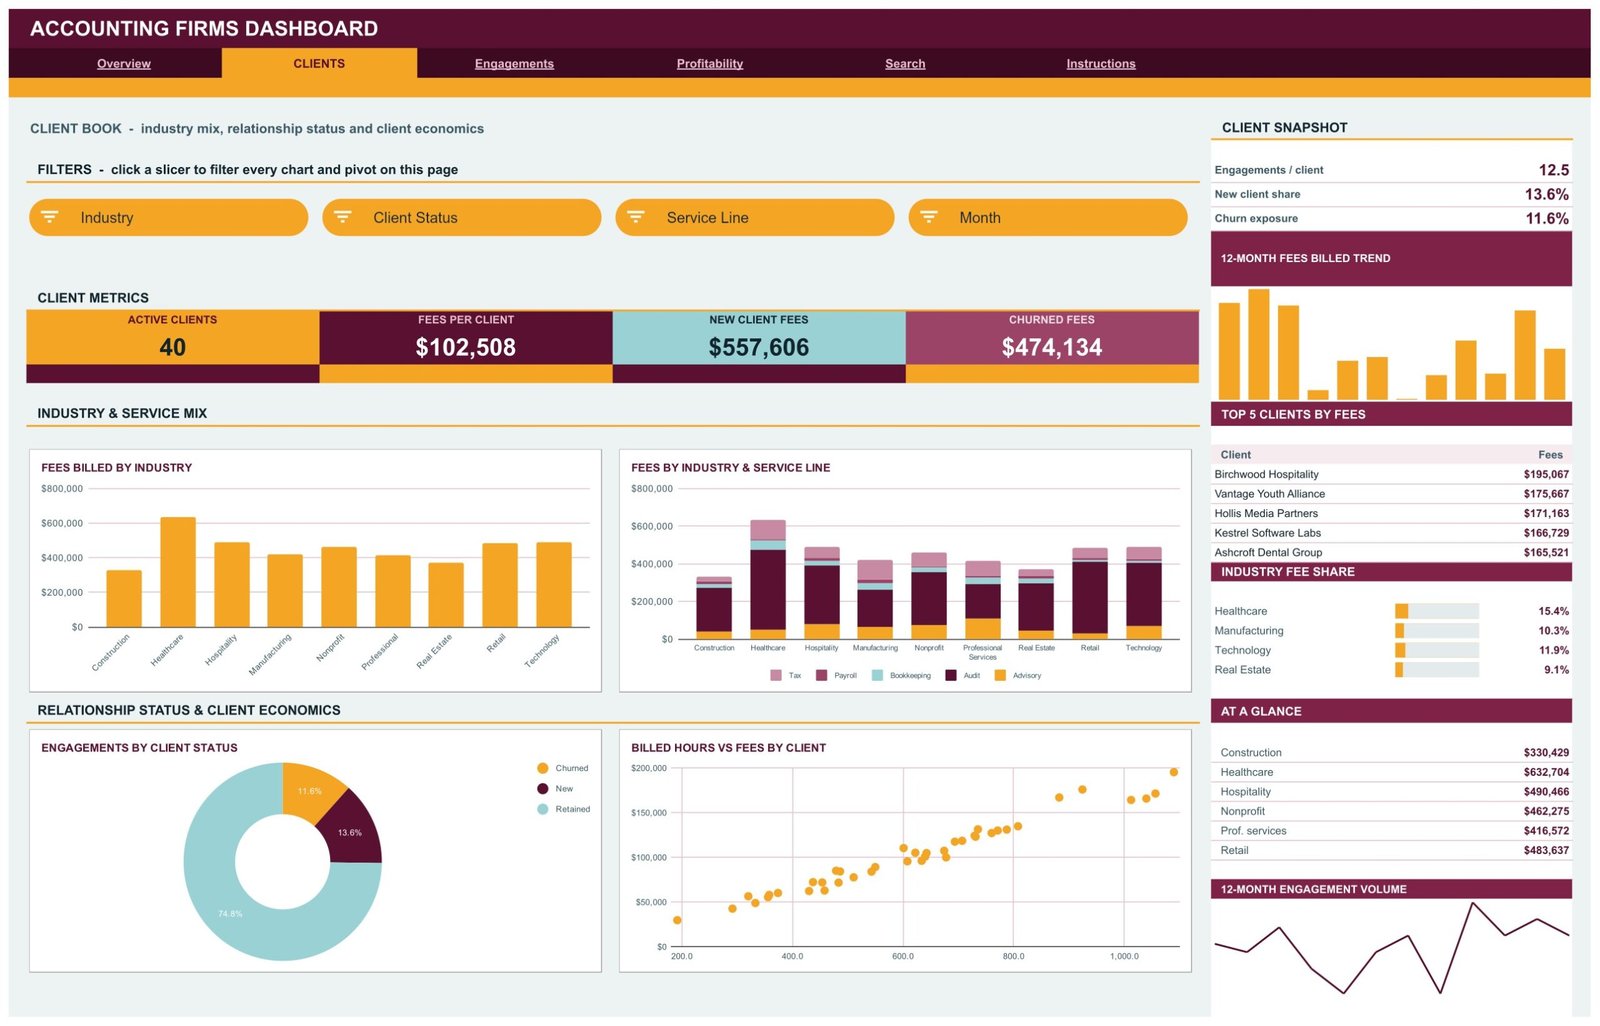
Page 2: Clients, industry mix, relationship status and client economics
KPI cards report Active Clients 40, Fees per Client $102,508, New Client Fees $557,606 and Churned Fees $474,134, filtered by Industry, Client Status, Service Line and Month. Charts are Fees Billed by Industry, Fees by Industry & Service Line, Engagements by Client Status (Retained 74.8%, New 13.6%, Churned 11.6%) and Billed Hours vs Fees by Client. The sidebar adds a Client Snapshot, Top 5 Clients by Fees and an Industry Fee Share list.
Page 3: Engagements, hours, throughput and work in progress
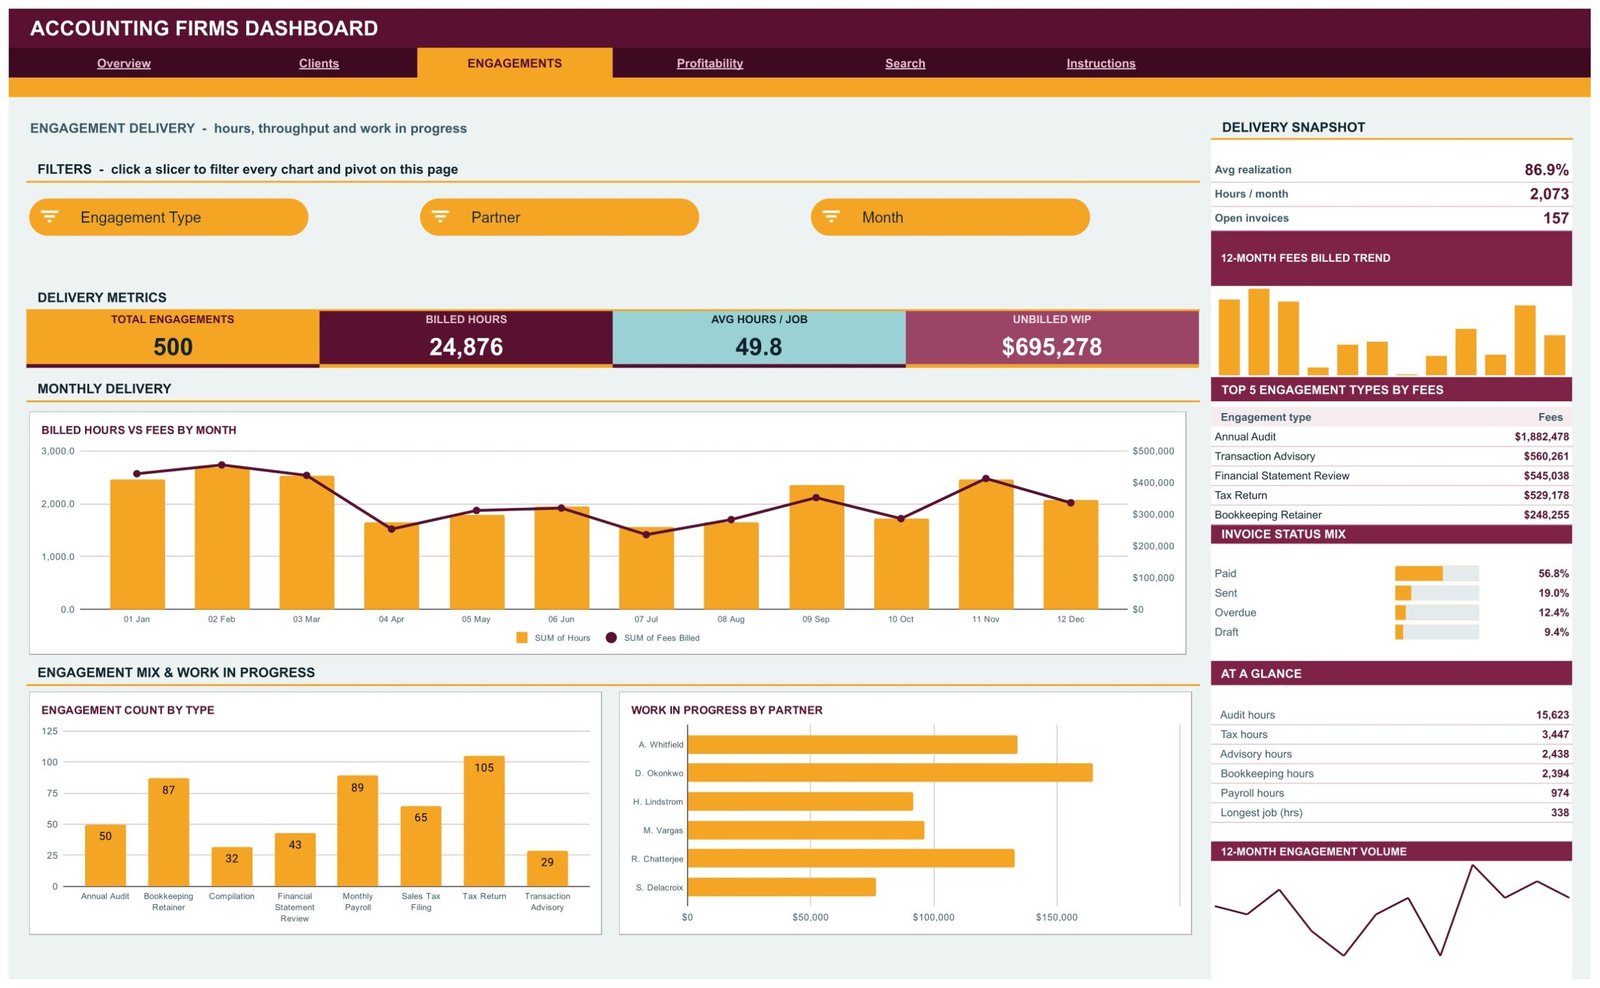
KPI cards report Total Engagements 500, Billed Hours 24,876, Avg Hours / Job 49.8 and Unbilled WIP $695,278, filtered by Engagement Type, Partner and Month. Charts are Billed Hours vs Fees by Month, Engagement Count by Type across eight types from Annual Audit to Transaction Advisory, and Work in Progress by Partner. The sidebar shows a Delivery Snapshot (157 open invoices), Top 5 Engagement Types by Fees and an Invoice Status Mix led by Paid 56.8%, Sent 19.0%, Overdue 12.4% and Draft 9.4%.
Page 4: Profitability, realization, write-offs and leakage
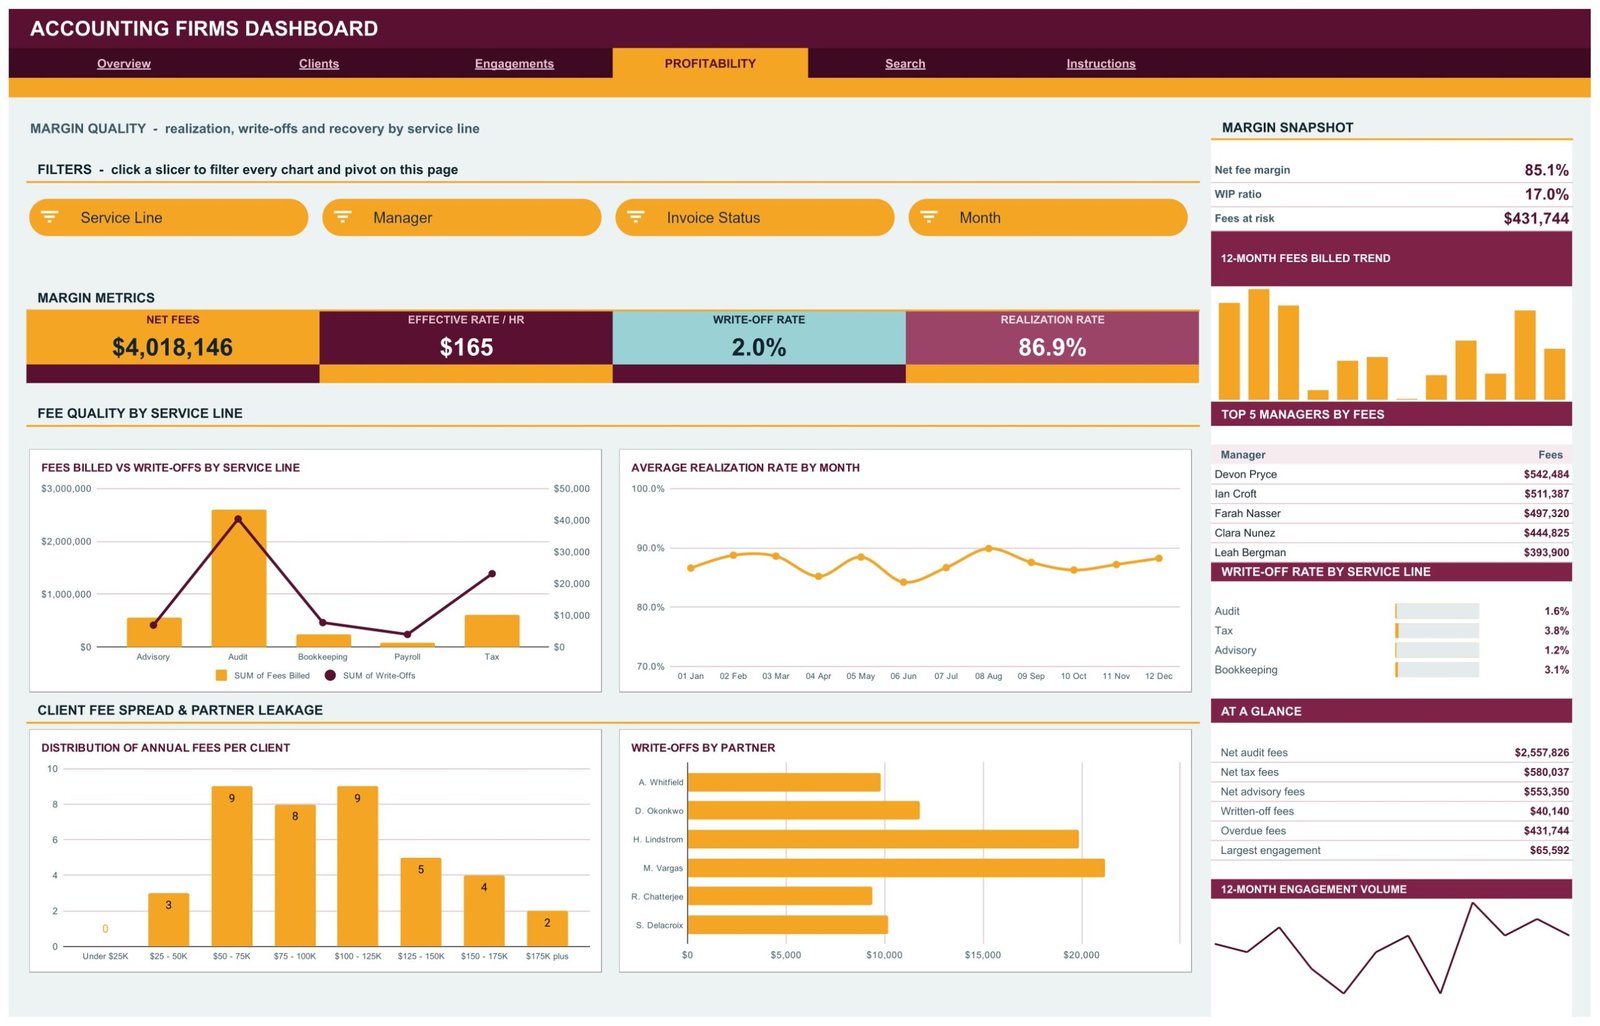
KPI cards report Net Fees $4,018,146, Effective Rate / Hr $165, Write-Off Rate 2.0% and Realization Rate 86.9%, filtered by Service Line, Manager, Invoice Status and Month. Charts are Fees Billed vs Write-Offs by Service Line, Average Realization Rate by Month, Distribution of Annual Fees per Client in $25K bands, and Write-Offs by Partner. The sidebar carries a Margin Snapshot (WIP ratio 17.0%, fees at risk $431,744), Top 5 Managers by Fees and Write-Off Rate by Service Line.
Page 5: Search, look up any engagement by ID
Enter an Engagement ID in the orange input cell and the Engagement Details table returns the whole record, field by field, straight from the Data sheet.
Page 6: Instructions, the user guide inside the file
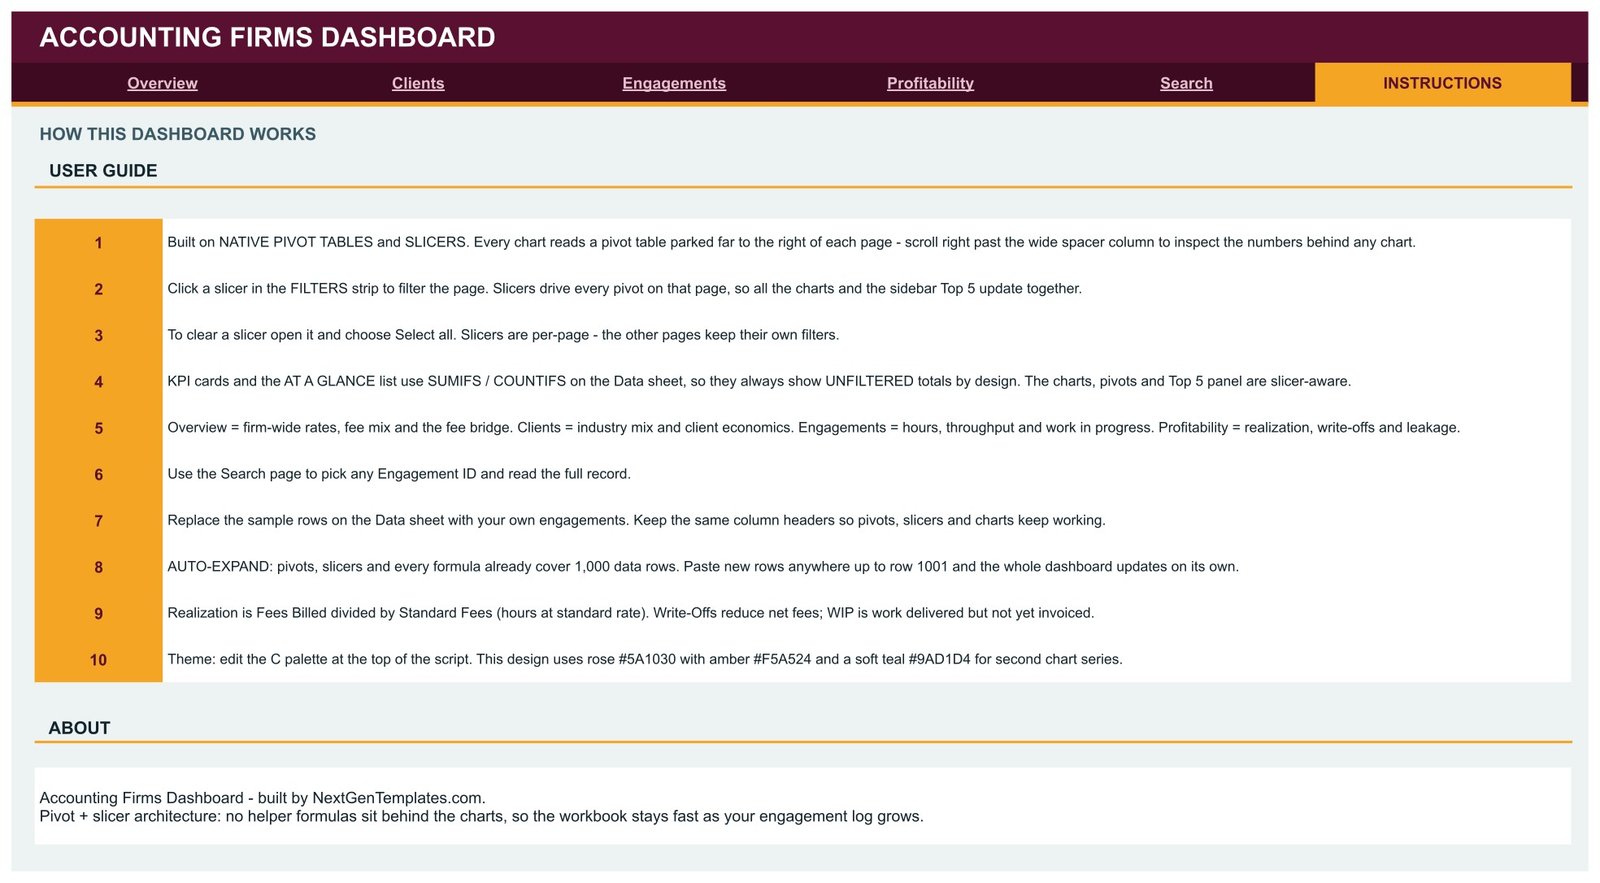
Ten numbered notes cover the pivot-and-slicer architecture, how to clear a slicer, why the KPI cards stay unfiltered, the 1,000-row auto-expand, how realization and WIP are defined, and how to re-theme the build.
📊 Google Sheets Dashboard vs. an Excel Dashboard vs. a Paid BI Suite, Where This Fits
| Feature | This Google Sheets dashboard | Microsoft Excel dashboard | Power BI Pro / Tableau Creator |
|---|---|---|---|
| Cost | $9.99 one-time ✅ | $13.99 one-time + Microsoft 365 | $14-75 / user / month |
| Platform | Google Sheets, browser only ✅ | Desktop Excel | Desktop authoring + service |
| Setup time | Under 10 minutes ✅ | Under 15 minutes | Days: model, publish, licence |
| Real-time team collaboration | Built in ✅ | Only via OneDrive co-authoring | Yes, per seat |
| Mobile access | Google Sheets app ✅ | Excel mobile, limited slicers | Vendor app, per seat |
| Realization, write-offs and WIP views | Ready-made ✅ | Build or buy separately | Build your own model |
| Share with a link | Any Google account ✅ | File send or OneDrive link | Viewers need a licence |
| Year-1 cost at 5 users | $9.99 ✅ | $13.99 + 5 Microsoft 365 seats | $840-4,500 |
| Engagement-level record lookup | Search page, no add-ons ✅ | Needs a lookup sheet | Drillthrough page |
| Row capacity out of the box | 1,000 engagements | Excel row limit | Millions ✅ |
For a practice that wants its engagement log summarised without paying per-seat BI licences, this Google Sheets dashboard sits in the sweet spot.
👥 Who This Template Is For, and Who It’s Not For
✅ Built for:
- Managing partners and practice managers at small and mid-sized accounting, CPA and bookkeeping firms who already keep an engagement log in a spreadsheet
- Partners who want realization, write-offs and unbilled WIP by partner and service line before the monthly partner meeting
- Firm administrators tracking overdue and draft invoices alongside the fees they belong to
- Multi-service practices comparing audit, tax, advisory, bookkeeping and payroll economics side by side
❌ Not for:
- Anyone looking for practice-management, time-and-billing, invoicing or general-ledger software; this reads a log, it does not run the practice
- Firms needing audit trails, SSO, data residency or access controls beyond Google Drive sharing
- Teams that want a live feed from a practice or accounting system; this is a static sheet you paste into
- Firms with well over 1,000 engagements a period
⚙️ How to Use the Dashboard
- Open the PDF in your download and click the Google Sheets copy link to create your own editable copy in Drive.
- Read the Instructions page first; it explains the pivot-and-slicer architecture in ten short notes.
- Decide whether client names can sit in the file. If not, switch the Client column to your internal client codes.
- Paste your engagements over the sample rows on the Data sheet, keeping the column headers exactly as they are.
- Click any slicer in a FILTERS strip to filter that page’s charts, pivots and Top 5 panel together.
- Open a slicer and choose Select all to clear it. Slicers are per page, so each page keeps its own filters.
- Use the Search page to pull any single engagement by its Engagement ID.
💼 Real-World Use Cases
Elena is managing partner of a 14-person CPA firm. Before each partner meeting she opens the Profitability page, filters Invoice Status to Overdue and reads Write-Offs by Partner next to Fees Billed vs Write-Offs by Service Line, so the conversation starts from numbers rather than impressions.
Rahul runs operations for a bookkeeping and payroll practice. He lives on the Engagements page: Work in Progress by Partner shows who is sitting on unbilled time, and the Invoice Status Mix shows how much has been sent but not paid.
Grace leads business development at a regional audit and tax firm. She uses the Clients page, Fees Billed by Industry and Engagements by Client Status, to see which sectors are growing and how much fee income left with churned clients last year.
❓ Frequently Asked Questions
What KPIs does the Accounting Firms Dashboard in Google Sheets track?
It carries 16 KPI cards across four pages: Total Fees Billed, Billed Hours, Realization Rate, Write-Offs, Active Clients, Fees per Client, New Client Fees, Churned Fees, Total Engagements, Avg Hours / Job, Unbilled WIP, Net Fees, Effective Rate / Hr and Write-Off Rate (Billed Hours and Realization Rate appear on two pages).
How is realization calculated?
Realization is Fees Billed divided by Standard Fees, where Standard Fees are the engagement hours at standard rate. Write-offs reduce net fees, and WIP is work delivered but not yet invoiced. The Instructions page states these definitions.
Is this practice-management or billing software?
No. It captures no time, raises no invoices, keeps no ledger and connects to no accounting or practice system. It summarises an engagement log you maintain elsewhere, and it gives no accounting, tax or audit advice.
How is it different from the Accounting Firm Revenue Dashboard in Google Sheets?
That older template is a separate build with Overview, Revenue, Workload, Clients and Search pages. This one adds a Profitability page with write-offs, realization by month and fee-per-client bands, an engagement-type view with WIP by partner, and a fee revenue bridge. Pick the one whose pages match your meetings.
Do the KPI cards follow the slicers?
No, by design. The cards and AT A GLANCE lists always show unfiltered firm totals. Charts, pivots and the Top 5 panels do follow the slicers.
How long does setup take?
Under 10 minutes: make your copy from the PDF link, paste your engagements over the sample rows keeping the headers intact, and every pivot, chart and slicer updates.
How many engagements can it hold?
Pivots, slicers and formulas cover 1,000 data rows out of the box, and the sample fills 500 of them.
👤 About the Author
Built by PK, Microsoft Certified Professional with 15+ years of Excel, Google Sheets and Power BI experience. Founder of NextGenTemplates, reaching 300K+ subscribers across YouTube channels (@PKAnExcelExpert, @NextGenTemplates, @NeoTechNavigators). Every template is hand-built and tested before release.
🔗 Explore Related Templates
Browse the full range of Google Sheets Dashboards and the wider Google Sheets template library.
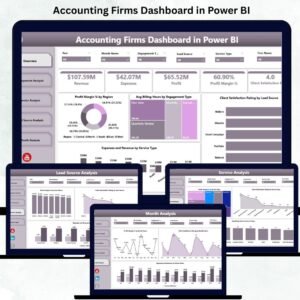
Same subject, other platforms: the Accounting Firms Dashboard in Power BI and the Accounting Firms Dashboard in Excel are separate builds with their own layouts and sample data, not ports of this file.
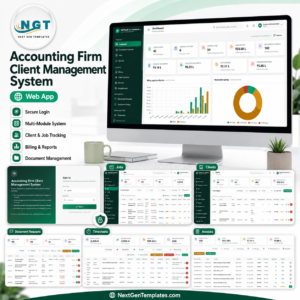
Different families, same subject: the Accounting Firms KPI Dashboard in Excel is a month-picker scorecard with traffic lights, and the Accounting Firm Client Management System Web App runs client records and workflow rather than reporting on them.
Pair it with the Billable Hours & Time Tracker in Google Sheets, the Retainer & Recurring Client Tracker in Google Sheets or the Payroll Management Dashboard in Google Sheets.
📖 Click here to read the Detailed Blog Post
🎥 Visit our YouTube channel for step-by-step video tutorials
👉 YouTube.com/@NextGenTemplates
Watch the step-by-step video Demo:
📅 Last updated: September 2026