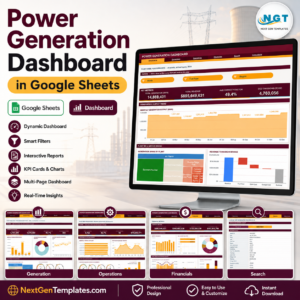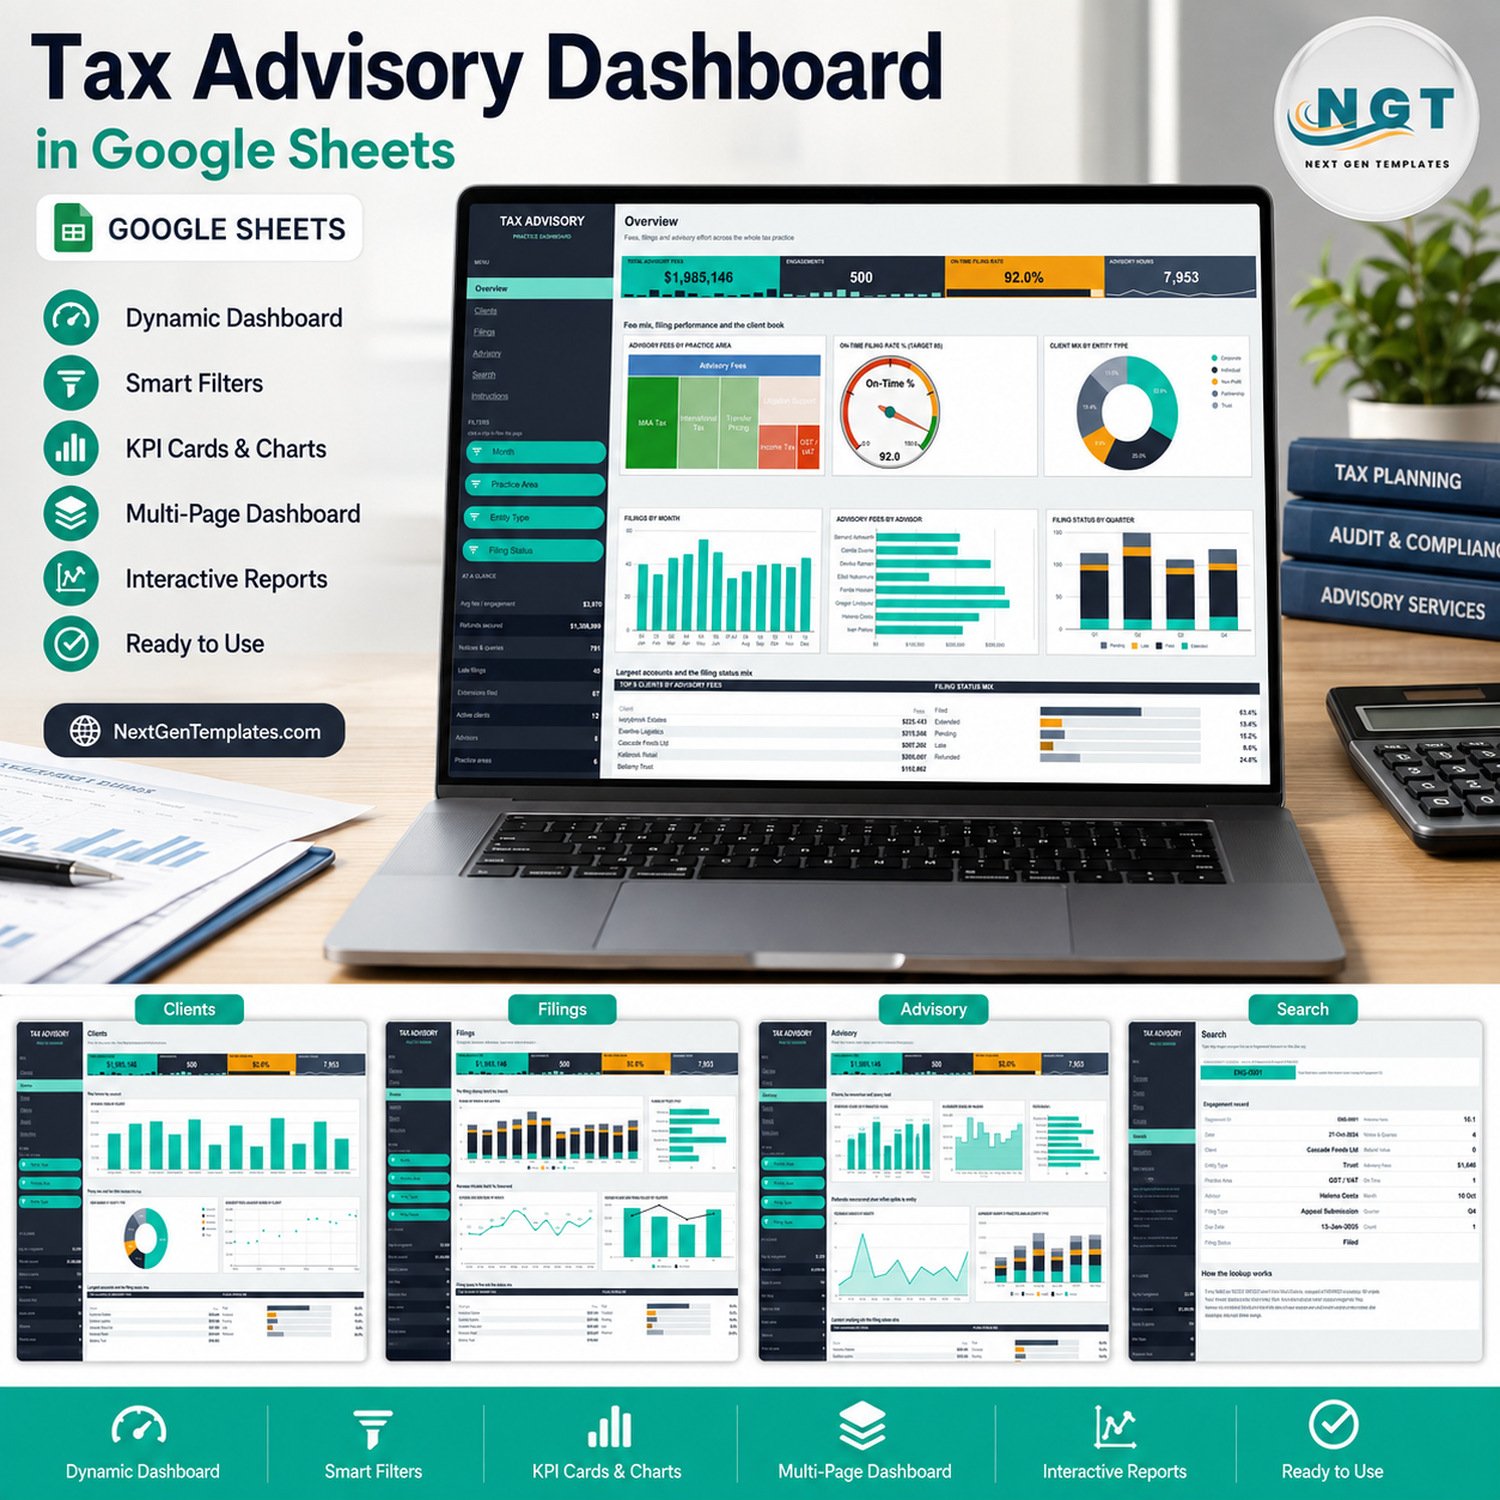
The Tax Advisory Dashboard in Google Sheets turns a tax practice’s engagement log into a six-page report: 500 sample engagements, 4 headline KPI cards, 18 chart panels and 15 filter chips, all read from native Google Sheets pivot tables. The sample practice covers 12 clients, 8 advisors, 6 practice areas, 5 entity types and 6 filing types, and the pivots already read 1,000 data rows. Make your copy, paste your engagements over the sample rows and every chart, Top 5 panel and status bar redraws.
🌍 Join 8,400+ teams in 40+ countries using NextGenTemplates to replace paid SaaS tools with one-time-purchase Excel, Google Sheets, Power BI and HTML templates.
✅ Instant download · One-time payment · No subscription · No per-user fees · Lifetime access
🔑 Key Features of the Tax Advisory Dashboard in Google Sheets
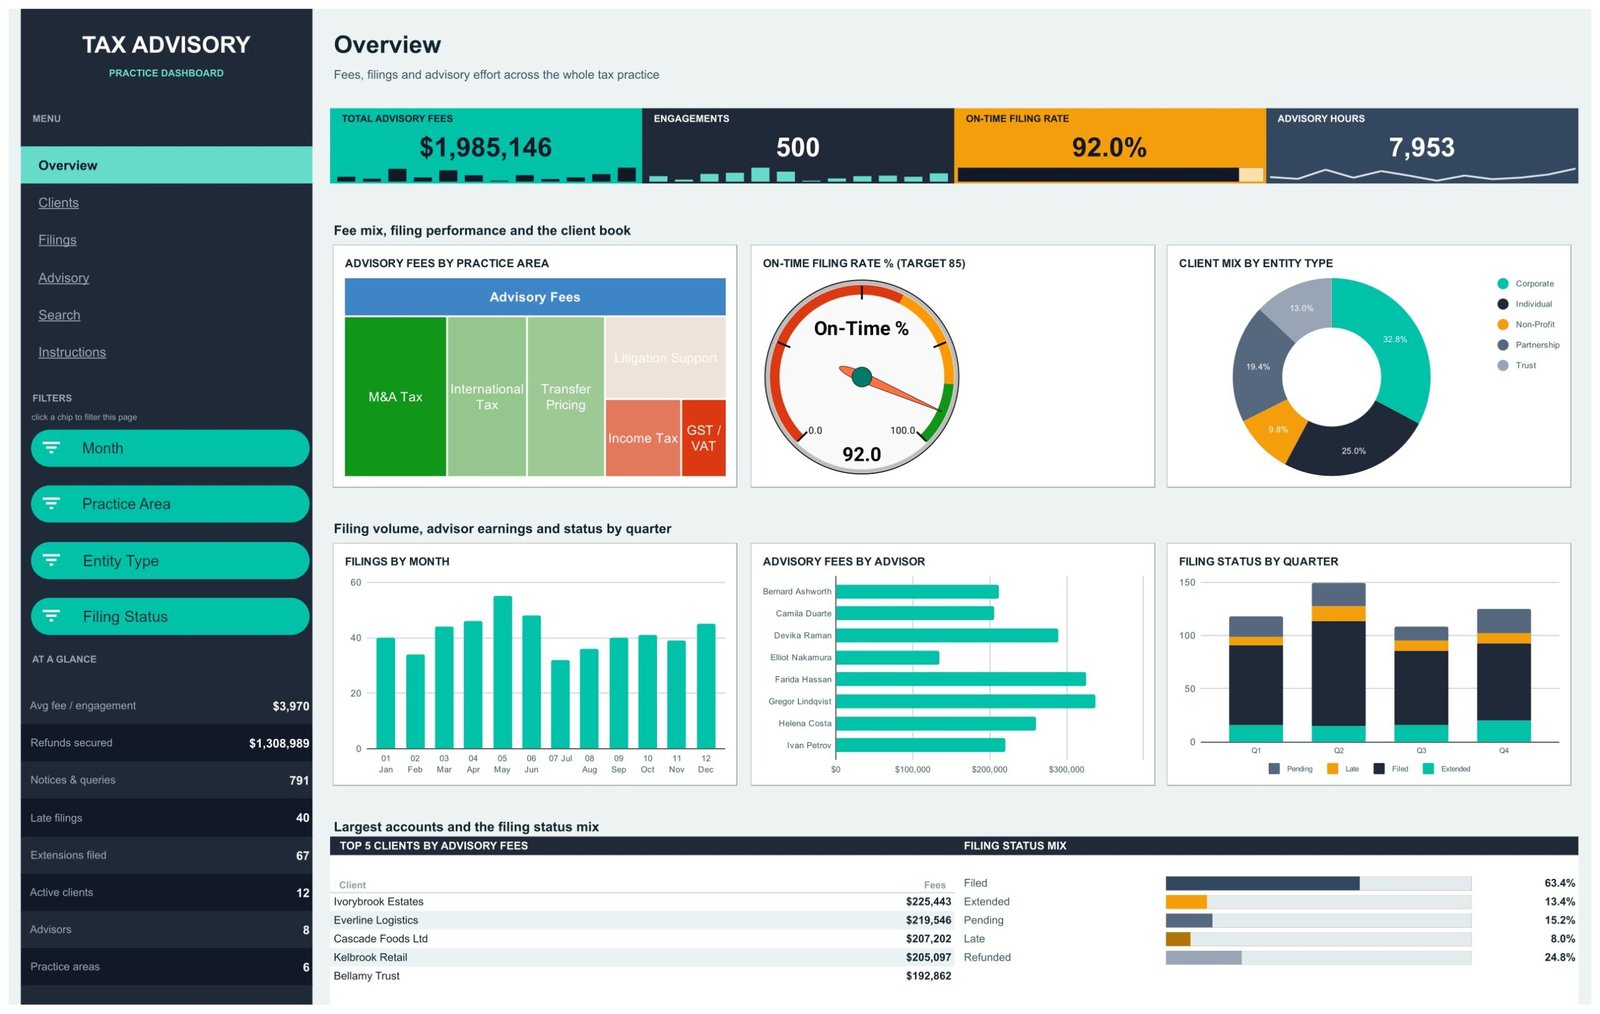
🔹 Four KPI cards on every page. Total Advisory Fees ($1,985,146 in the sample), Engagements (500), On-Time Filing Rate (92.0%) and Advisory Hours (7,953) sit in a band under each page title, each with a small in-card trend, so the headline numbers travel with you from page to page.
🔹 Fees, filings and advisory effort in one file. Four analysis pages split the practice four ways: Overview for the whole book, Clients for where fees come from, Filings for volume, status, notices and refunds, and Advisory for where hours go and what they return.
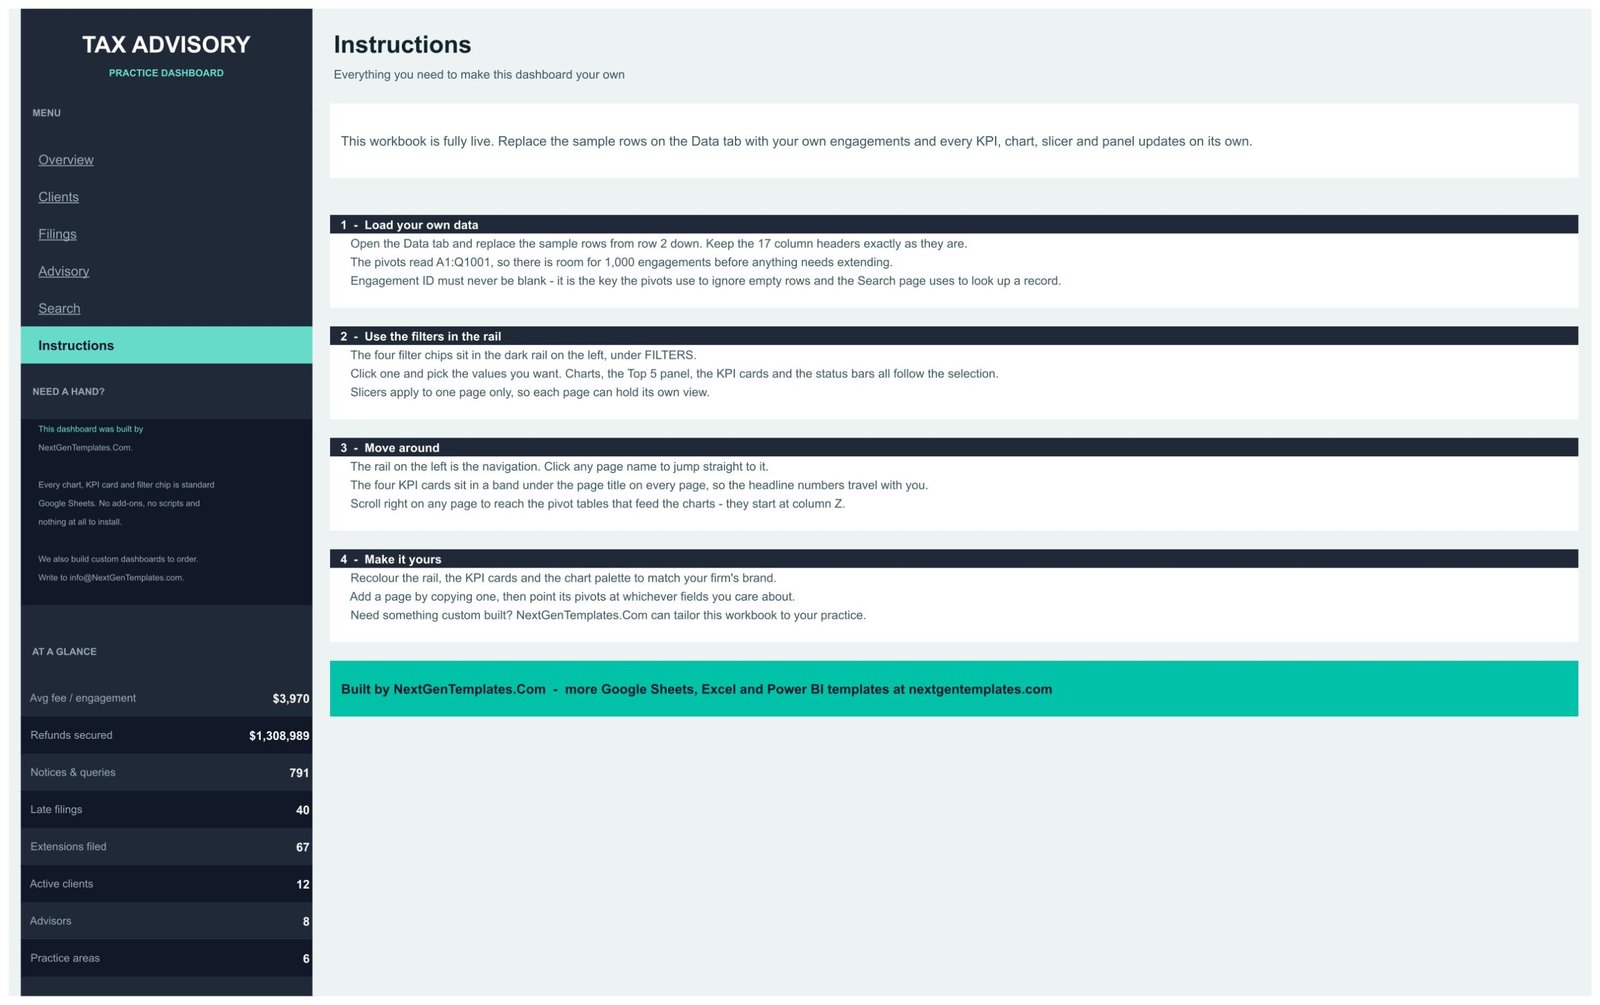
🔹 An AT A GLANCE rail beside every page. Eight running figures stay visible: average fee per engagement $3,970, refunds secured $1,308,989, notices and queries 791, late filings 40, extensions filed 67, active clients 12, advisors 8 and practice areas 6.
🔹 Native pivot tables and slicers. Each chart reads a pivot table parked to the right of its page, starting at column Z. Fifteen filter chips cover Month, Practice Area, Entity Type, Filing Status, Filing Type, Advisor and Quarter, and each slicer applies to its own page only.
🔹 An engagement-level Search page. Type an Engagement ID such as ENG-0001 and read the full 17-field record. Every field is an INDEX / MATCH wrapped in IFERROR, so an unknown ID reads “Not found” instead of an error.
🔹 Standard Google Sheets, nothing to install. Every chart, KPI card and filter chip is built from standard features. There are no add-ons and no scripts, and the built-in Instructions page walks through loading data, filtering, navigating and re-branding.
🧾 What This Template Does, and What It Deliberately Does Not Do
This is a reporting template for a tax advisory practice’s engagement log. It summarises advisory fees, filing status, on-time filing, notices and queries, refunds and advisory hours by client, advisor, practice area and entity type. It is not tax-preparation, e-filing, practice-management, time-and-billing or invoicing software. It calculates no tax, prepares or files no return, tracks no statutory deadline and connects to no tax authority or accounting system.
It gives no tax advice. The filing types (Annual Return, Quarterly Return, Advance Tax, Withholding Statement, Refund Claim, Appeal Submission), the practice areas and every due date in the sample are fictional labels for demonstration. They are not a statement of any jurisdiction’s filing deadlines, rates or rules. Always confirm obligations with the relevant tax authority or a qualified tax professional.
Mind client confidentiality before you paste real data. Each row holds a client name, entity type, advisor name, fees, hours, refund value and dates, and the Search page prints a named engagement record. There are no tax identification numbers, bank details, addresses or tax returns anywhere in the file. If client identity is confidential, use an internal client code instead of the name; the pivots and the Search lookup work identically, and a Google Sheet is only as private as your Drive sharing settings.
📦 What’s Inside the Tax Advisory Dashboard in Google Sheets
Page 1: Overview, fee mix, filing performance and the client book
Filter chips for Month, Practice Area, Entity Type and Filing Status sit in the rail. Charts are Advisory Fees by Practice Area across M&A Tax, International Tax, Transfer Pricing, Litigation Support, Income Tax and GST / VAT; On-Time Filing Rate % against a target of 85, a gauge reading 92.0; Client Mix by Entity Type (Corporate 32.8%, Individual 25.0%, Partnership 19.4%, Trust 13.0%, Non-Profit 9.8%); Filings by Month; Advisory Fees by Advisor; and Filing Status by Quarter. Below them sit Top 5 Clients by Advisory Fees, led by Ivorybrook Estates at $225,443, and a Filing Status Mix panel.
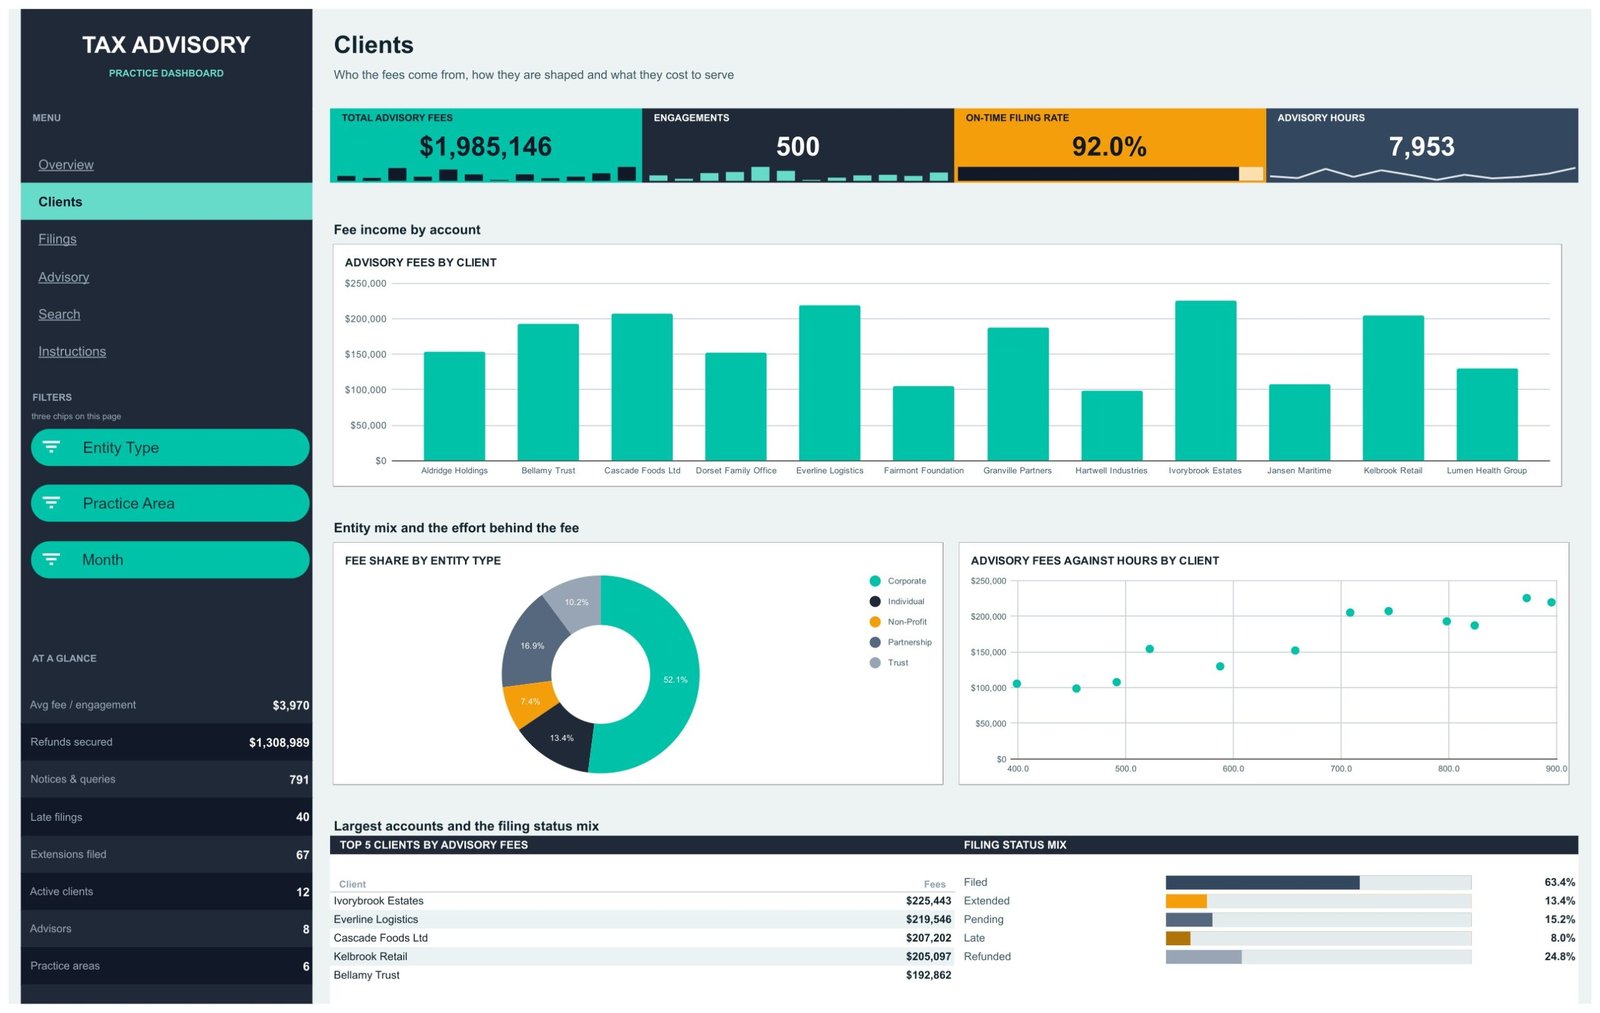
Page 2: Clients, where the fees come from and what they cost to serve
Three chips filter by Entity Type, Practice Area and Month. Advisory Fees by Client ranks all 12 sample clients from Aldridge Holdings to Lumen Health Group. Fee Share by Entity Type shows Corporate clients carrying 52.1% of fees, and Advisory Fees Against Hours by Client plots each client’s fees against the hours spent on them. Top 5 Clients by Advisory Fees and the Filing Status Mix close the page.
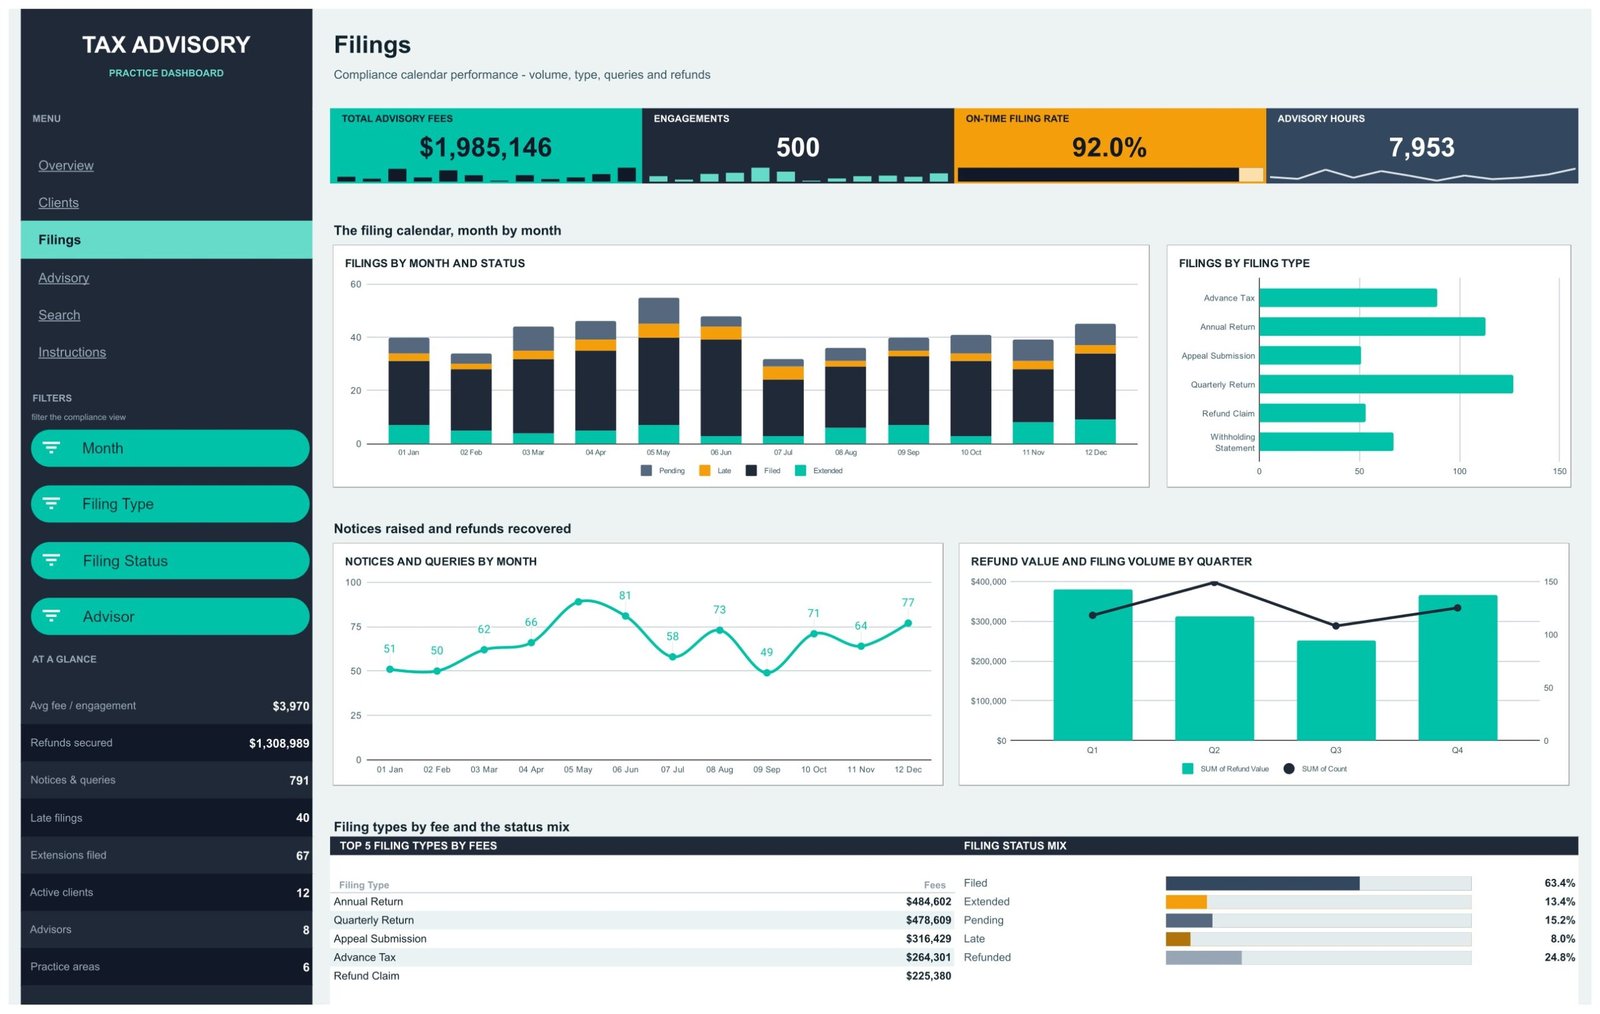
Page 3: Filings, volume, filing type, notices and refunds
Chips filter by Month, Filing Type, Filing Status and Advisor. Charts are Filings by Month and Status (Pending, Late, Filed, Extended), Filings by Filing Type across six types, Notices and Queries by Month, and Refund Value and Filing Volume by Quarter. The Top 5 Filing Types by Fees panel is led by Annual Return at $484,602 and Quarterly Return at $478,609.
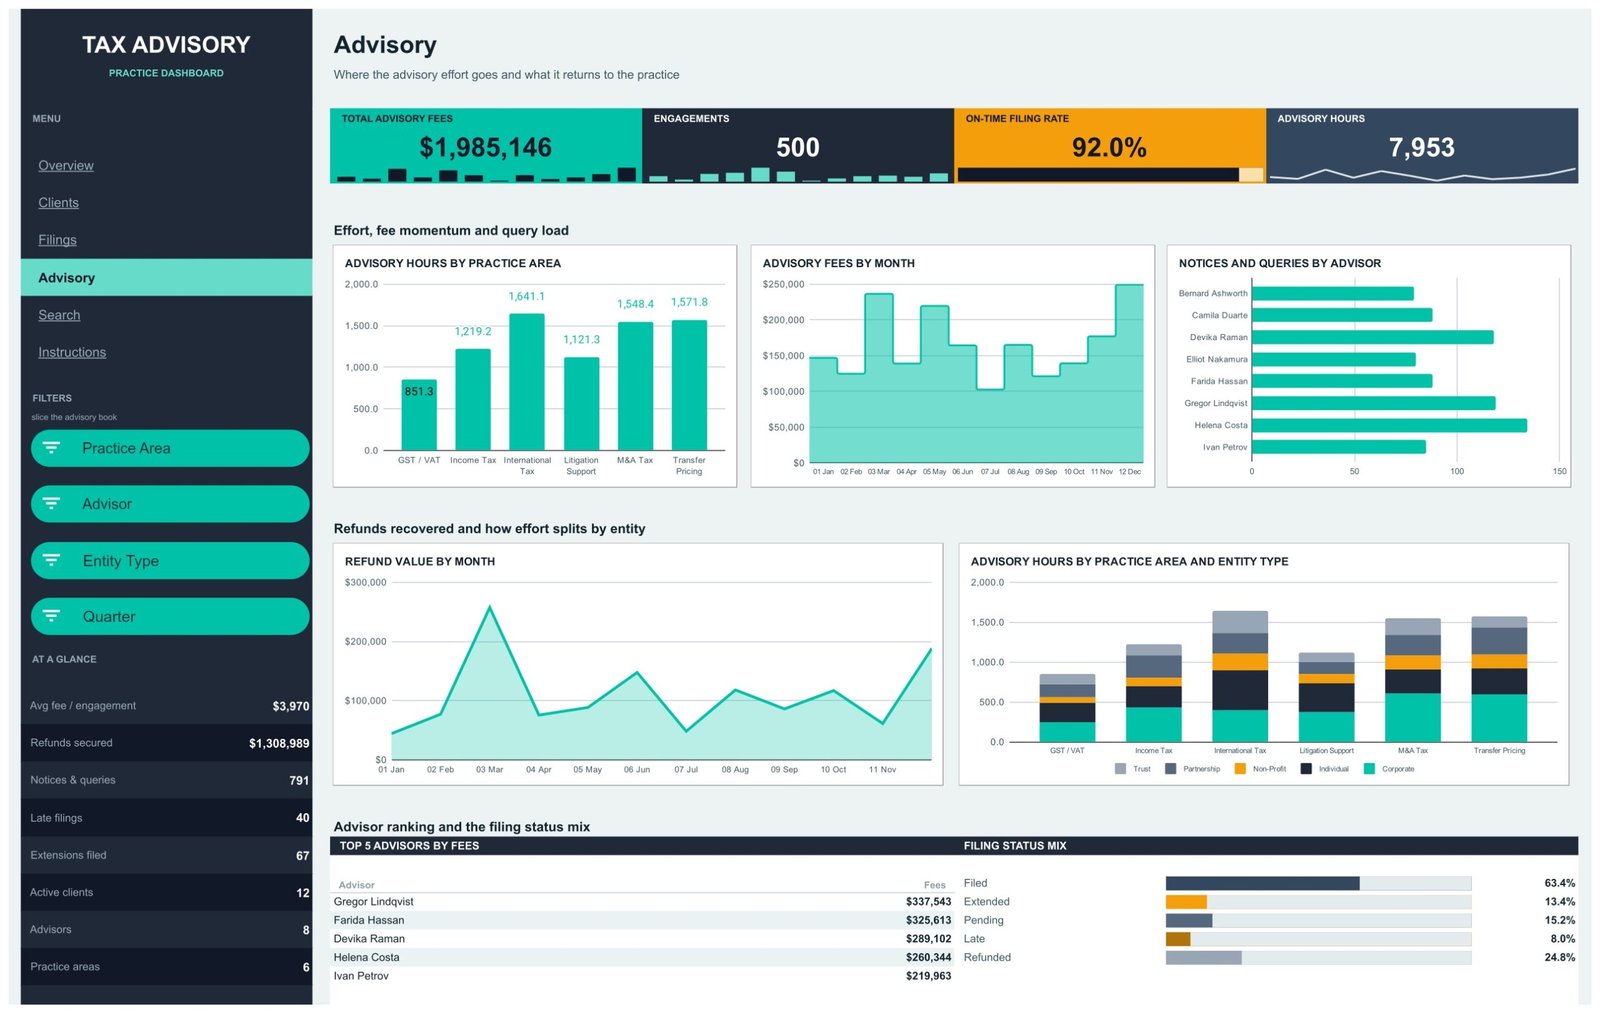
Page 4: Advisory, where the effort goes and what it returns
Chips filter by Practice Area, Advisor, Entity Type and Quarter. Charts are Advisory Hours by Practice Area (International Tax highest at 1,641.1 hours, GST / VAT lowest at 851.3), Advisory Fees by Month, Notices and Queries by Advisor, Refund Value by Month, and Advisory Hours by Practice Area and Entity Type. Top 5 Advisors by Fees is led by Gregor Lindqvist at $337,543.
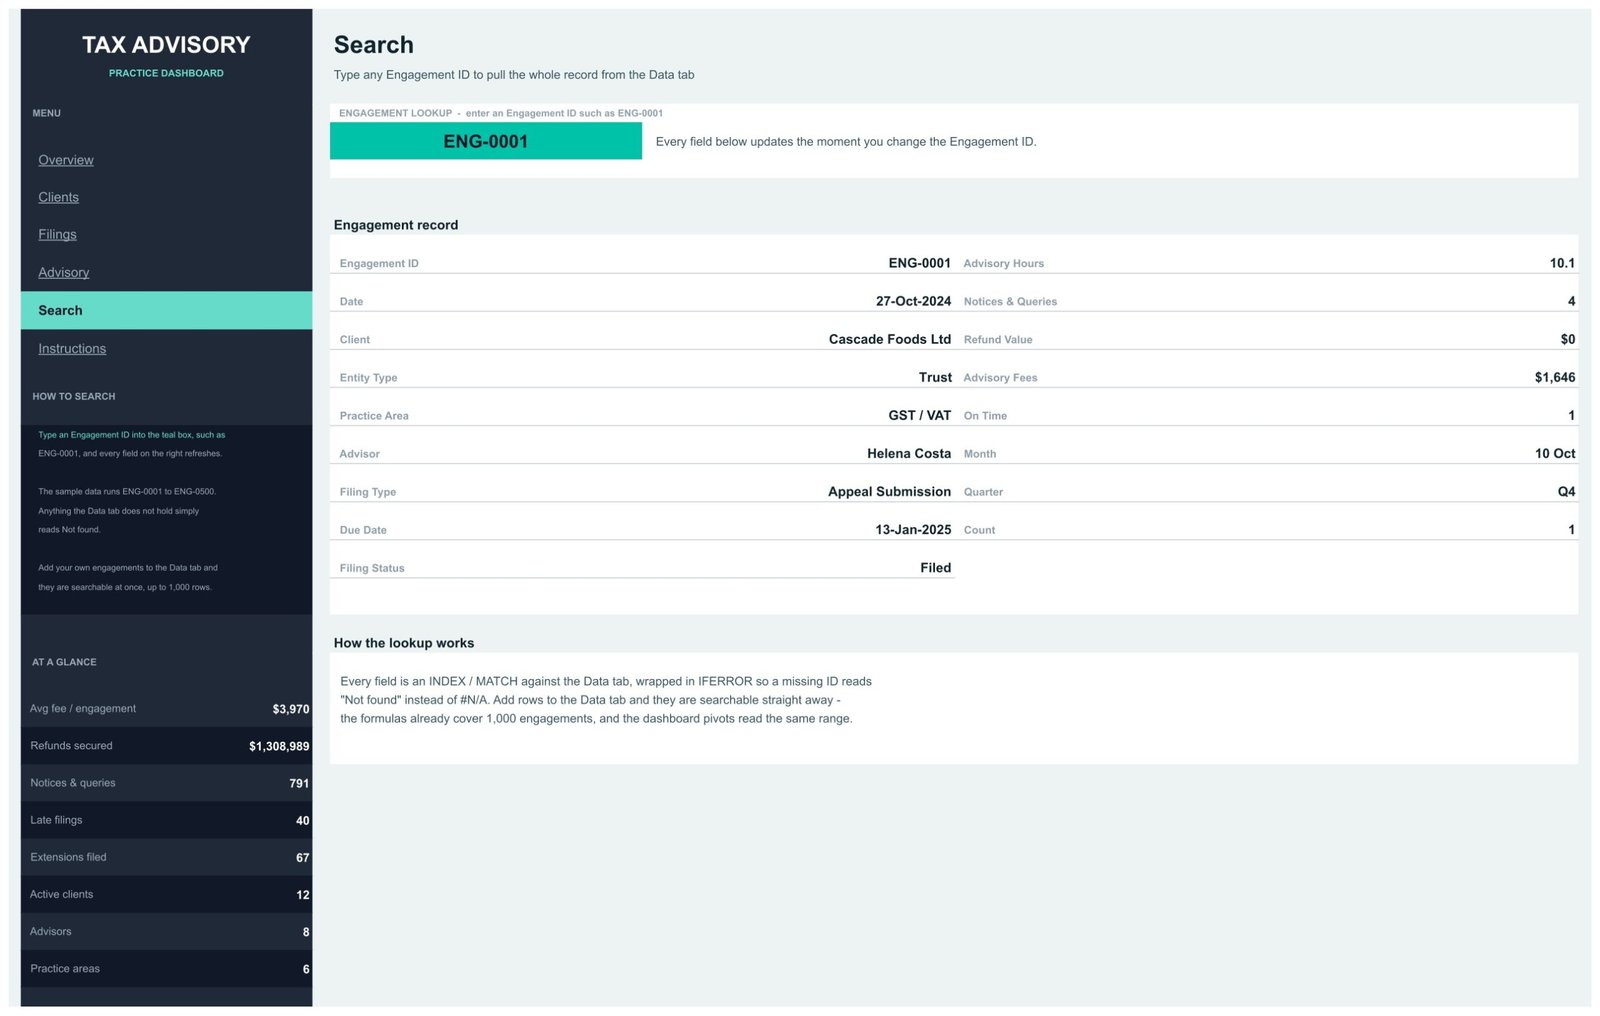
Page 5: Search, look up any engagement by ID
Enter an Engagement ID (the sample runs ENG-0001 to ENG-0500) and the Engagement record returns all 17 fields: Engagement ID, Date, Client, Entity Type, Practice Area, Advisor, Filing Type, Due Date, Filing Status, Advisory Hours, Notices & Queries, Refund Value, Advisory Fees, On Time, Month, Quarter and Count.
Page 6: Instructions, the user guide inside the file
Four numbered sections cover loading your own data (keep the 17 headers, pivots read A1:Q1001, never leave Engagement ID blank), using the filter chips, moving around the navigation rail, and recolouring or extending the workbook.
📊 Google Sheets Dashboard vs. an Excel Dashboard vs. a Paid BI Suite, Where This Fits
| Feature | This Google Sheets dashboard | Microsoft Excel dashboard | Power BI Pro / Tableau Creator |
|---|---|---|---|
| Cost | $9.99 one-time ✅ | $13.99 one-time + Microsoft 365 | $14-75 / user / month |
| Platform | Google Sheets, browser only ✅ | Desktop Excel | Desktop authoring + service |
| Setup time | Under 10 minutes ✅ | Under 15 minutes | Days: model, publish, licence |
| Real-time team collaboration | Built in ✅ | Only via OneDrive co-authoring | Yes, per seat |
| Mobile access | Google Sheets app ✅ | Excel mobile, limited slicers | Vendor app, per seat |
| Filing status, on-time rate and refund views | Ready-made ✅ | Build or buy separately | Build your own model |
| Share with a link | Any Google account ✅ | File send or OneDrive link | Viewers need a licence |
| Year-1 cost at 5 users | $9.99 ✅ | $13.99 + 5 Microsoft 365 seats | $840-4,500 |
| Engagement-level record lookup | Search page, no add-ons ✅ | Needs a lookup sheet | Drillthrough page |
| Row capacity out of the box | 1,000 engagements | Excel row limit | Millions ✅ |
For a tax practice that wants its engagement log summarised without paying per-seat BI licences, this Google Sheets dashboard sits in the sweet spot.
👥 Who This Template Is For, and Who It’s Not For
✅ Built for:
- Practice leads at small and mid-sized tax advisory firms who already keep an engagement log in a spreadsheet
- Partners who want advisory fees, hours and on-time filing by advisor and practice area before a monthly review
- Operations managers watching late, pending and extended filings next to the notices and queries they generate
- Multi-service practices comparing income tax, GST / VAT, international tax, transfer pricing, M&A tax and litigation support work side by side
❌ Not for:
- Anyone looking for tax-preparation, e-filing or deadline-calendar software; this reads a log, it does not prepare or file anything
- Anyone expecting tax advice, statutory due dates or tax rates; none are provided
- Firms needing audit trails, SSO or access controls beyond Google Drive sharing
- Practices with well over 1,000 engagements a period
⚙️ How to Use the Dashboard
- Open the PDF in your download and click the Google Sheets copy link to create your own editable copy in Drive.
- Read the Instructions page first; it explains the data, filters and navigation in four short sections.
- Decide whether client names can sit in the file. If not, switch the Client column to internal client codes.
- Paste your engagements over the sample rows on the Data tab from row 2, keeping the 17 column headers exactly as they are.
- Click a filter chip in the rail and pick the values you want; that page’s charts and panels follow.
- Use the Search page to pull any single engagement by its Engagement ID.
💼 Real-World Use Cases
Maya runs a six-advisor tax advisory boutique. Before each month-end review she opens the Advisory page, filters by Quarter and compares Advisory Hours by Practice Area with Top 5 Advisors by Fees, so staffing questions start from the hours that were actually spent.
Daniel manages operations for a corporate tax practice. He works from the Filings page: Filings by Month and Status shows how many engagements sit in Pending, Late or Extended, and Notices and Queries by Month shows whether the query load is rising.
Priya leads client relationships at a regional advisory firm. She uses the Clients page, Advisory Fees by Client beside Advisory Fees Against Hours by Client, to see which accounts earn the most for the effort they take.
❓ Frequently Asked Questions
What KPIs does the Tax Advisory Dashboard in Google Sheets track?
It shows four KPI cards on every page: Total Advisory Fees, Engagements, On-Time Filing Rate and Advisory Hours. An AT A GLANCE rail adds average fee per engagement, refunds secured, notices and queries, late filings, extensions filed, active clients, advisors and practice areas.
Is this tax-preparation or e-filing software?
No. The Tax Advisory Dashboard in Google Sheets calculates no tax, prepares or files no return and connects to no tax authority. It summarises an engagement log you keep elsewhere and gives no tax advice.
Does it include real filing deadlines or tax rates?
No. The Due Date values and filing types in the sample are fictional demonstration data. Enter the dates your practice works to, and confirm every obligation with the relevant tax authority or a qualified tax professional.
How is the On-Time Filing Rate worked out?
Each engagement row carries an On Time field of 1 or 0, and the card reports the share of engagements marked on time. In the sample, 40 of 500 filings are late, which gives the 92.0% shown against the gauge’s target of 85.
Why does the Filing Status Mix add up to more than 100%?
Filed, Extended, Pending and Late cover every engagement and total 100%. Refunded (24.8%) is shown in the same panel but overlaps them, because a filed return can also carry a refund.
How long does setup take?
Under 10 minutes: make your copy from the PDF link, paste your engagements over the sample rows with the headers intact, and every pivot, chart and filter chip updates.
How many engagements can it hold?
The pivots read A1:Q1001 and the Search formulas cover the same range, so 1,000 engagements fit out of the box; the sample fills 500.
👤 About the Author
Built by PK, Microsoft Certified Professional with 15+ years of Excel, Google Sheets and Power BI experience. Founder of NextGenTemplates, reaching 300K+ subscribers across YouTube channels (@PKAnExcelExpert, @NextGenTemplates, @NeoTechNavigators). Every template is hand-built and tested before release.
🔗 Explore Related Templates
Browse the full range of Google Sheets Dashboards and the wider Google Sheets template library. New to slicers? Google’s guide to pivot tables in Google Sheets explains the building blocks this dashboard uses.
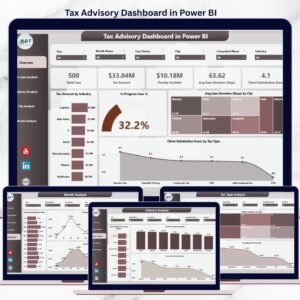
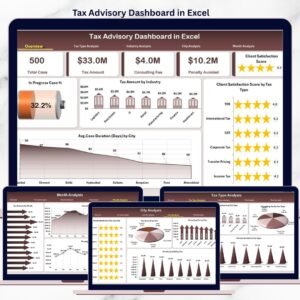
Same subject, other platforms: the Tax Advisory Dashboard in Excel and the Tax Advisory Dashboard in Power BI are separate builds with their own layouts and sample data, not ports of this file.
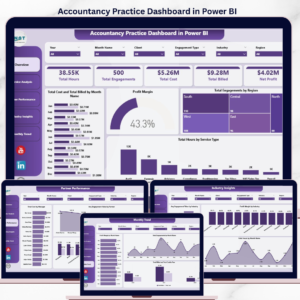
Related practice reporting: the Accounting Firm Revenue Dashboard in Google Sheets, the Accountancy Practice Dashboard in Power BI and the Tax Litigation KPI Dashboard in Excel, a month-picker KPI scorecard rather than an analytical dashboard.
Pair it with the Billable Hours & Time Tracker in Google Sheets or, to run client records rather than report on them, the Accounting Firm Client Management System Web App.
📖 Click here to read the Detailed Blog Post
🎥 Visit our YouTube channel for step-by-step video tutorials
👉 YouTube.com/@NextGenTemplates
Watch the step-by-step video Demo:
📅 Last updated: September 2026