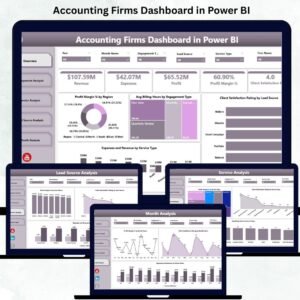


Accounting firms rely heavily on accurate financial data, clean reporting, and timely decision-making. But traditional reporting methods often involve scattered spreadsheets, manual calculations, and repetitive tasks. The Accounting Firms Dashboard in Power BI solves this problem instantly.
It brings all operational, financial, and client-related KPIs into one interactive and easy-to-understand dashboard. With dynamic slicers, drill-down features, and visual clarity, accounting teams can track profit margins, expenses, client satisfaction, lead sources, billing hours, and monthly performance with just a few clicks.
Whether you work in auditing, bookkeeping, tax filing, consulting, payroll, or financial analysis, this dashboard gives you powerful insights that help you make faster, smarter, and more profitable decisions.
📦 What’s Inside the Accounting Firms Dashboard in Power BI
This dashboard includes five professionally designed pages, each focusing on a different area of accounting operations. It gives firms 360-degree visibility into performance, profitability, and productivity.
⭐ 1. Overview Page – Your Complete Firm Performance Snapshot

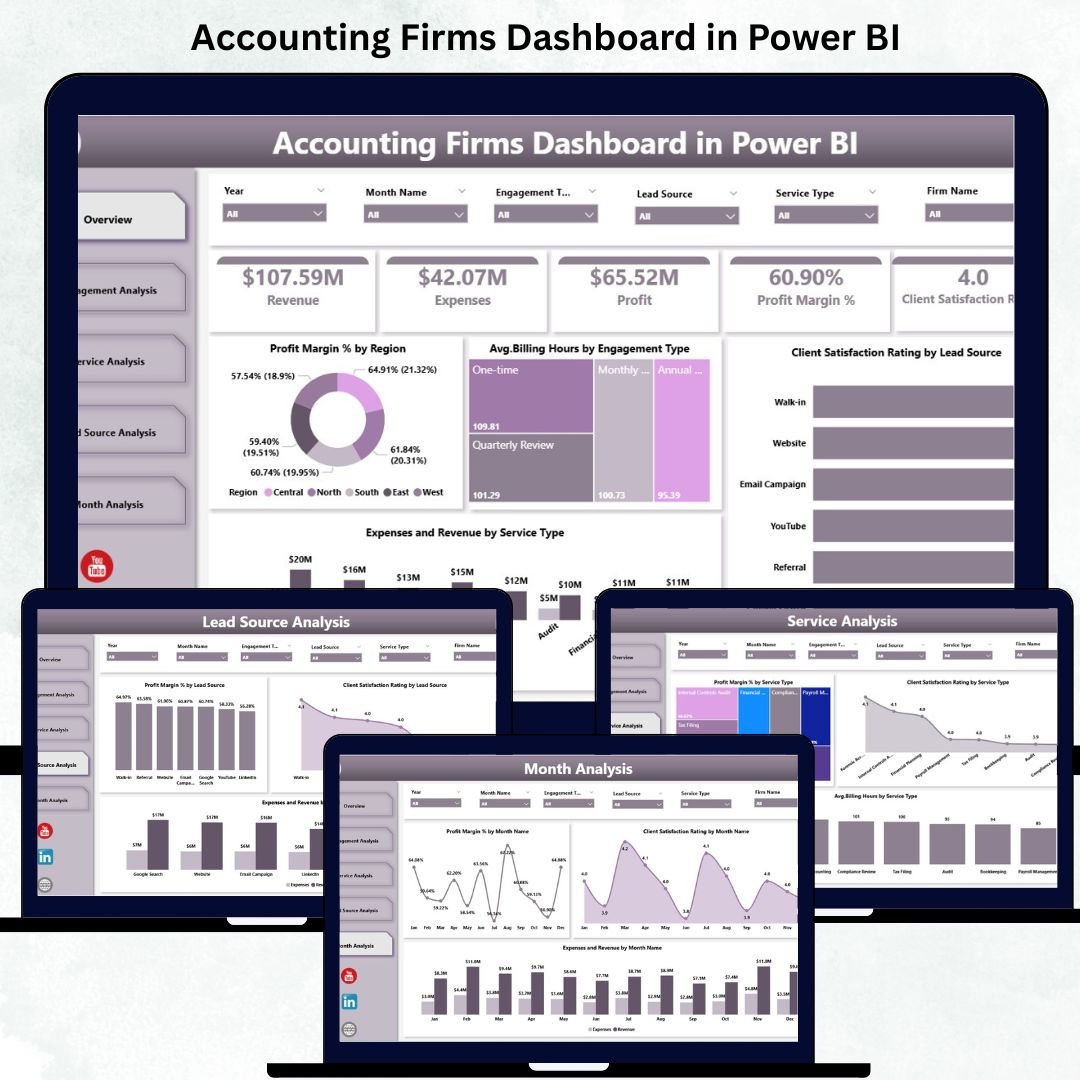
The Overview Page is the starting point of the dashboard. It summarizes financial and operational KPIs in one view, helping leaders understand the firm’s performance instantly.
This page includes:
Four Performance Cards: Total Revenue, Total Expenses, Profit Margin %, Client Satisfaction Score
Dynamic Slicers: Filter data by region, service type, engagement type, or time period
Key Charts:
Profit Margin % by Region
Avg. Billing Hours by Engagement Type
Client Satisfaction Rating by Lead Source
Expenses vs Revenue by Service Type
Why This Page Matters:
It provides a fast, high-level overview that helps managers identify opportunities, detect risks, and make accurate decisions quickly.
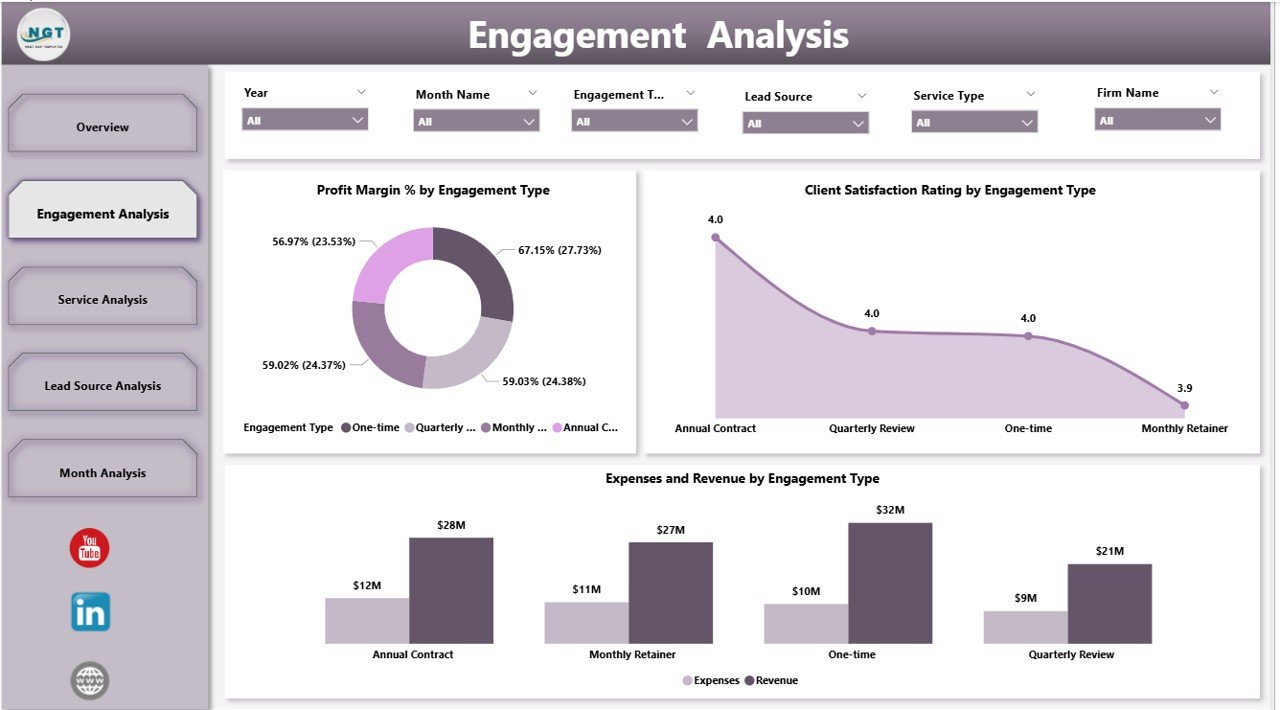
⭐ 2. Engagement Analysis Page – Deep Dive into Engagement Types
Every engagement type—Audit, Tax Advisory, Payroll, Bookkeeping, Consulting—impacts profitability differently. The Engagement Analysis Page helps firms understand which engagements deliver strong results.
Charts include:
Profit Margin % by Engagement Type
Client Satisfaction Rating by Engagement Type
Expenses and Revenue by Engagement Type
How It Helps:
Firms can identify high-value engagements, improve low-performing ones, refine pricing strategies, and optimize resource allocation.
⭐ 3. Service Analysis Page – Evaluate Service-Level Performance
Accounting firms usually offer a variety of services. This page helps compare all services side by side.
Key Visuals:
Profit Margin % by Service Type
Client Satisfaction Rating by Service Type
Avg. Billing Hours by Service Type
What You Gain:
You can understand which services bring the highest profitability, which require more time, and which need performance improvements.
⭐ 4. Lead Source Analysis Page – Identify Your Most Valuable Clients
Lead sources influence profitability, retention, and client satisfaction. This page compares different lead sources to show where your best clients come from.
Charts include:
Profit Margin % by Lead Source
Client Satisfaction Rating by Lead Source
Expenses vs Revenue by Lead Source
Why It’s Important:
Firms can optimize marketing spend, improve lead quality, and focus on channels that drive long-term profitable clients.
⭐ 5. Monthly Trends Page – Track Performance Across the Year
Accounting activity changes from month to month. The Monthly Trends Page helps firms spot financial patterns and performance movements throughout the year.
Charts include:
Profit Margin % by Month
Client Satisfaction Rating by Month
Expenses vs Revenue by Month
Why It Helps:
Firms can forecast better, plan budgeting cycles, and identify high-growth or low-performing periods.
👥 Who Can Benefit from This Accounting Firms Dashboard in Power BI
This dashboard is perfect for:
🧾 Accounting Firms
💼 Audit Teams
📊 Financial Analysts
👨💼 Partners & Directors
🧮 Bookkeeping Teams
📈 Consulting Teams
🧑💻 Tax Filing Departments
🏢 CA / CPA Firms
Anyone who manages financial or operational performance can use this dashboard to improve productivity and decision-making.
### 📘 Click here to read the Detailed Blog Post
### 📺 Visit our YouTube channel to learn step-by-step video tutorials:
👉 Youtube.com/@PKAnExcelExpert