

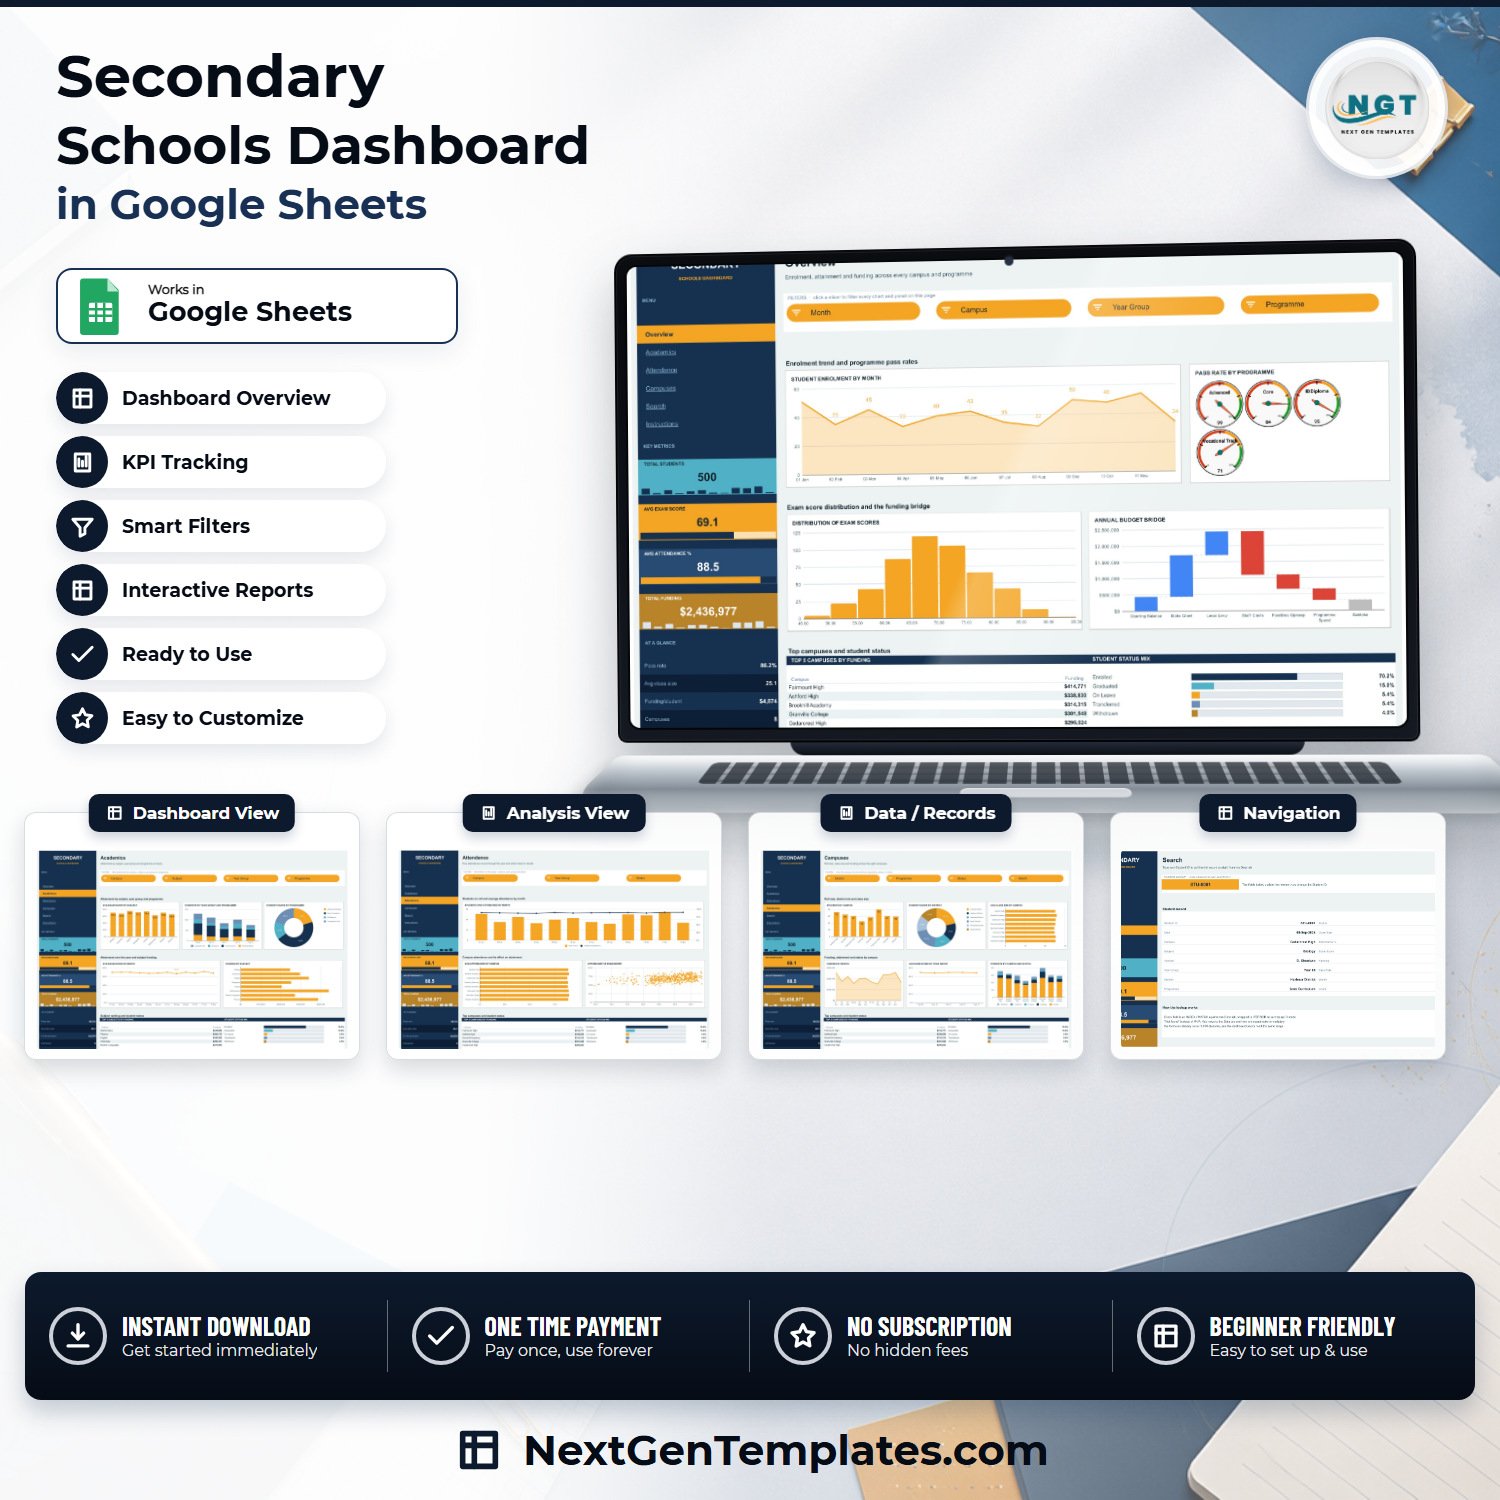
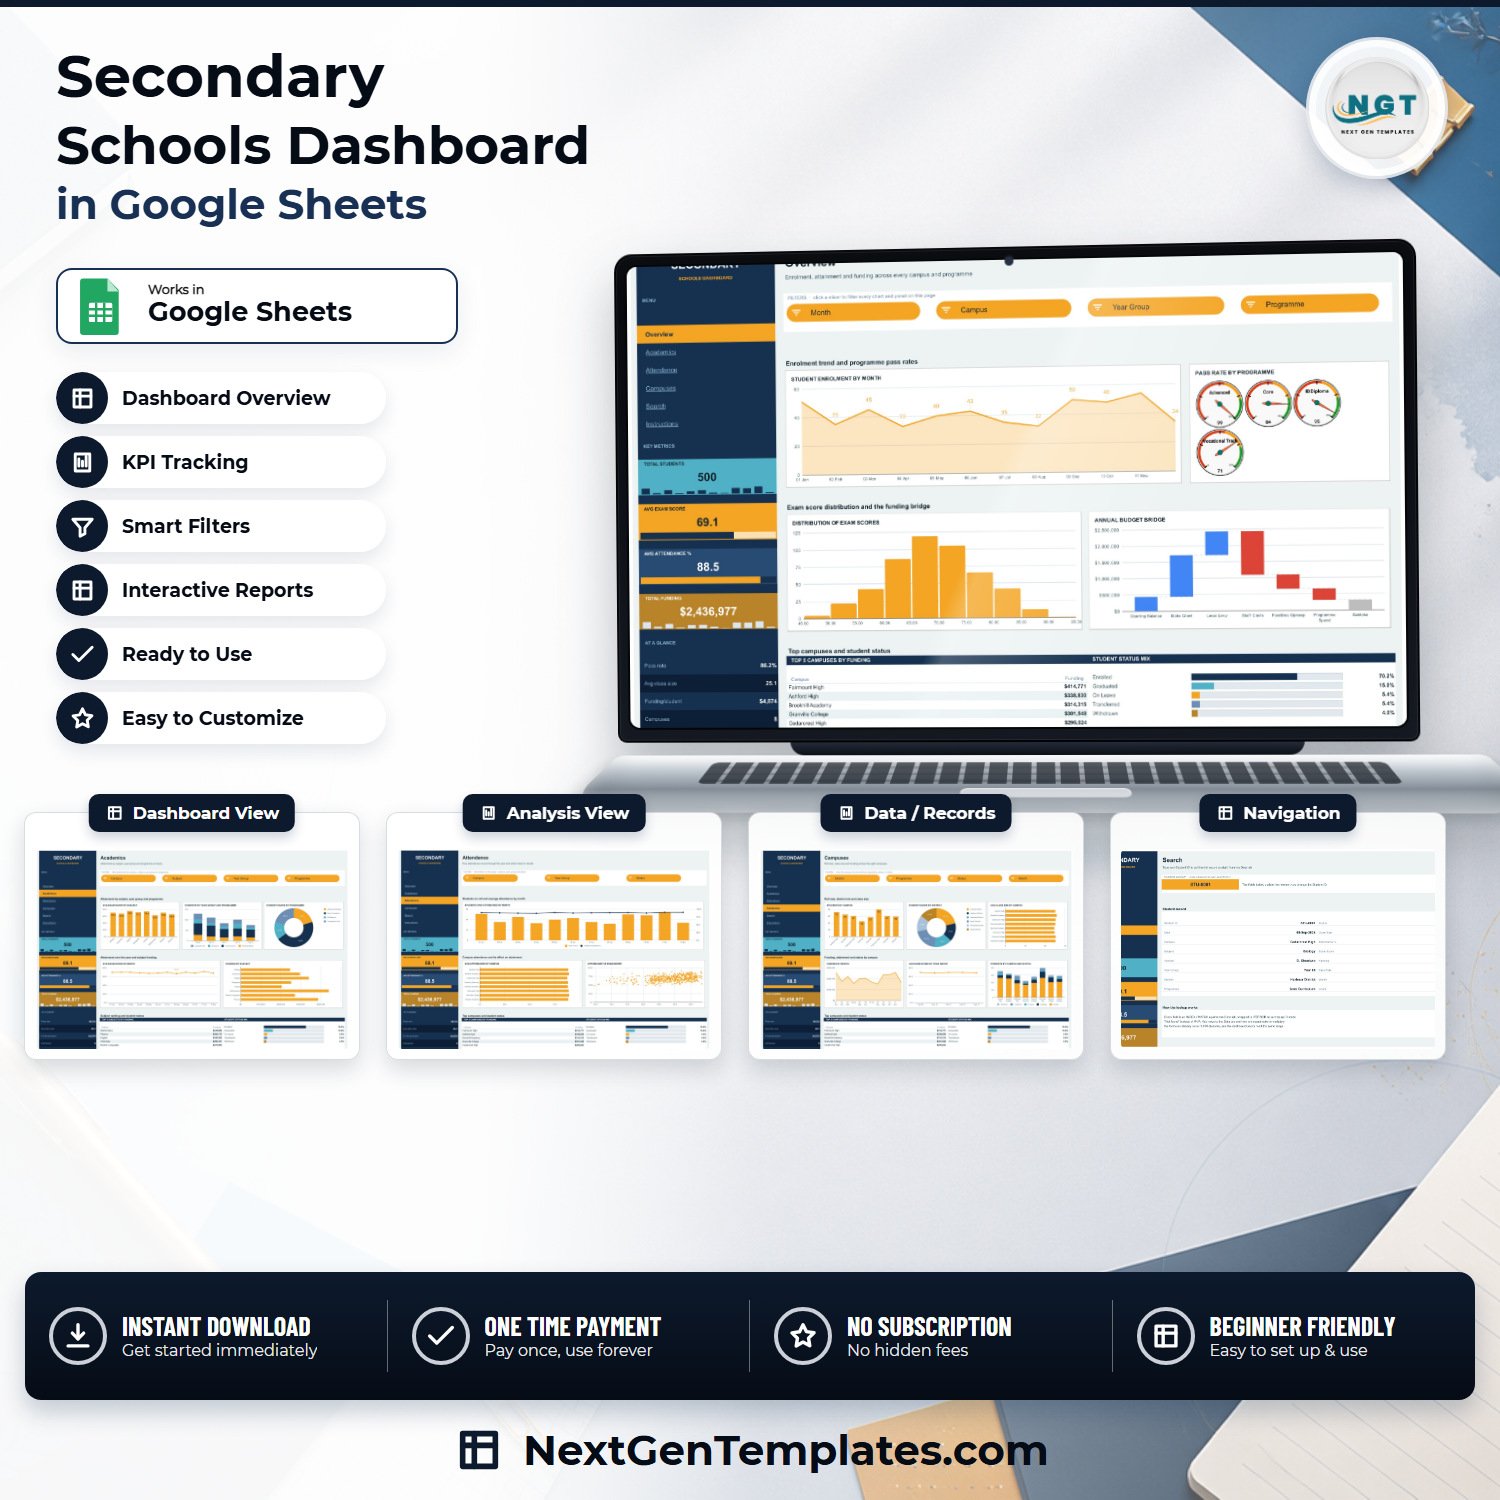

The Secondary Schools Dashboard in Google Sheets turns one flat table of 500 sample student records into five linked reporting pages – Overview, Academics, Attendance, Campuses and a Student ID lookup – with 18 charts, 15 slicers and four headline KPI cards that sit in the navigation rail on every page. It is a finished, formula-driven Google Sheets workbook: no add-ons, no Apps Script, no macros. Buy once at $9.99 (regular $16.99), open the PDF in your download, click the copy link, and the whole file lands in your own Google Drive in about a minute. If anything does not work as described, our team will help you fix it within 72 hours.
What this workbook holds about students – read this first
This is a business reporting template for a secondary school or a small multi-campus trust. Because it reports on children, here is exactly what the sample file contains, checked column by column across all 16 headers and all 500 rows.
Students appear only as a coded ID. The Student ID column holds 500 unique codes in the form STU-0001. There is no pupil name, no date of birth, no address, no phone number or email, no parent or guardian field, no SEN or safeguarding flag, no free-school-meal status, no behaviour or exclusion record, and no medical or ethnicity column anywhere in the file.
But every row is still a pupil-level record. One coded ID carries that student’s attendance percentage, exam score, class size, funding figure and enrolment status. If your school maps those codes back to real children in a key you hold elsewhere, this file becomes personal data about minors and your normal data-protection duties apply to it in full. Keep the code, keep the key out of the workbook, and do not paste pupil names into the Student ID column. The Teacher column is the same point for staff: the sample holds 12 initial-plus-surname codes, and real names typed there are staff personal data.
Google Sheets is a general-purpose spreadsheet. It is not designed for storing sensitive records about children, and this template does nothing to change that. Decide where your pupil-level detail lives before you load it.
Key Features of the Secondary Schools Dashboard in Google Sheets
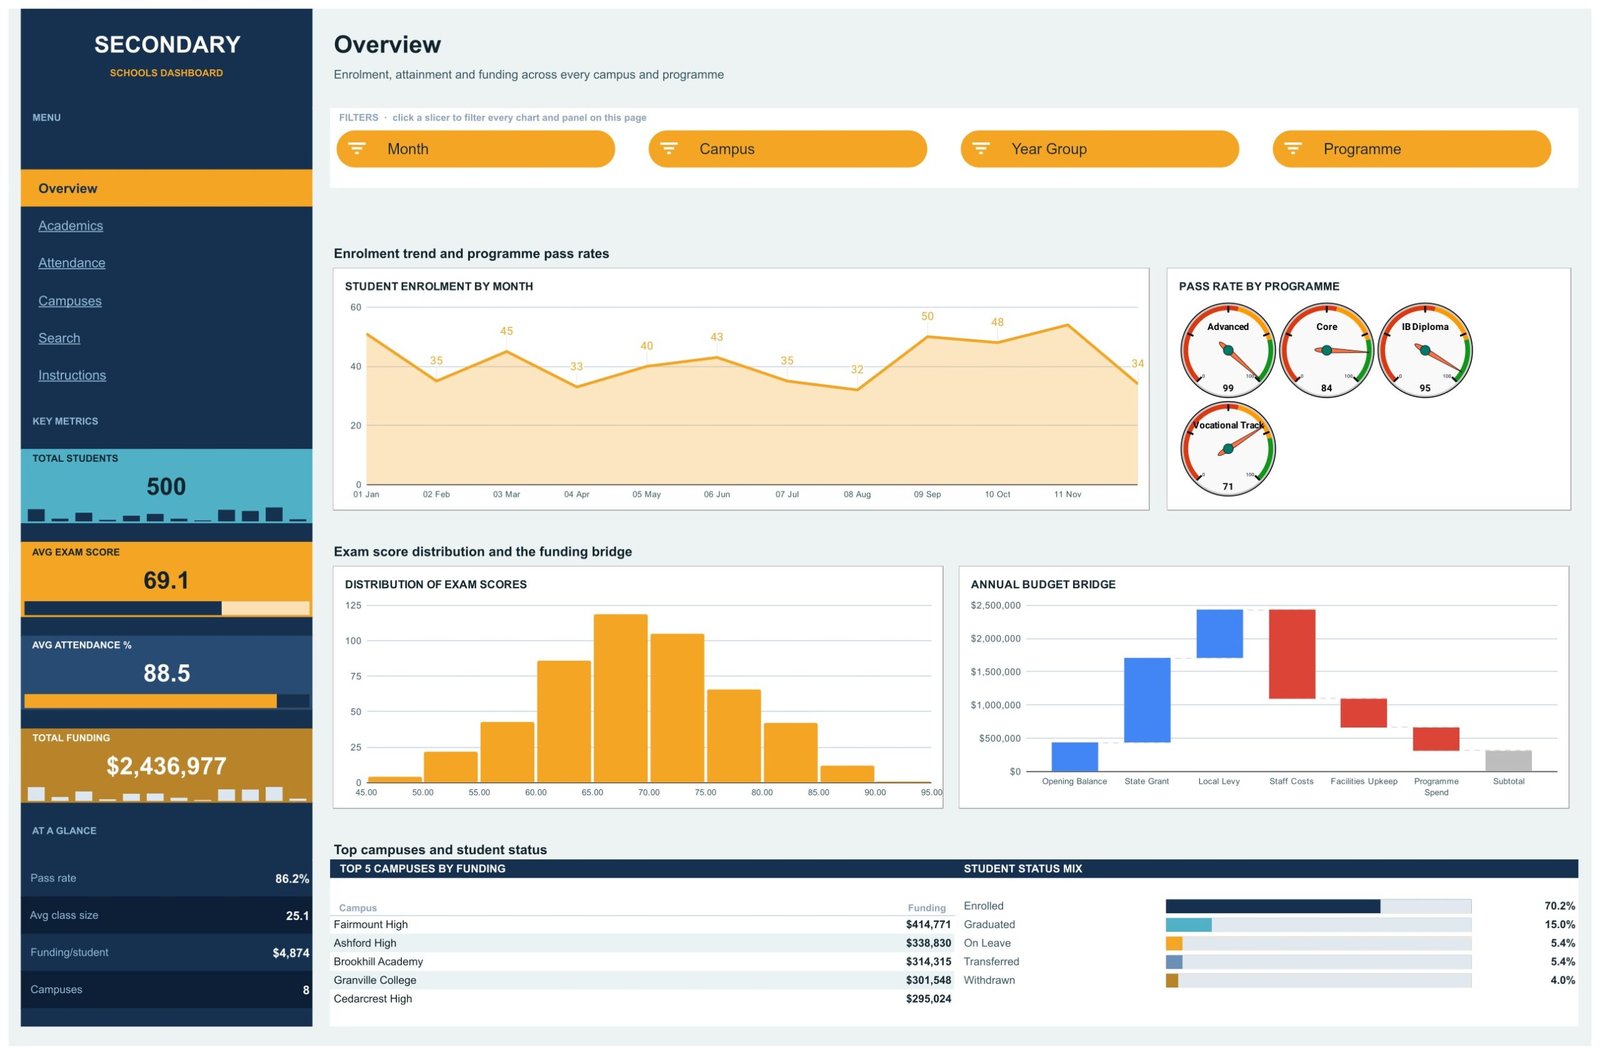
- Four KPI cards in the rail – Total Students (500), Avg Exam Score (69.1), Avg Attendance % (88.5) and Total Funding ($2,436,977), each with a sparkline, visible on every page.
- An “At a glance” strip – Pass rate 86.2%, Avg class size 25.1, Funding/student $4,874 and Campuses 8, all live formulas over the Data tab.
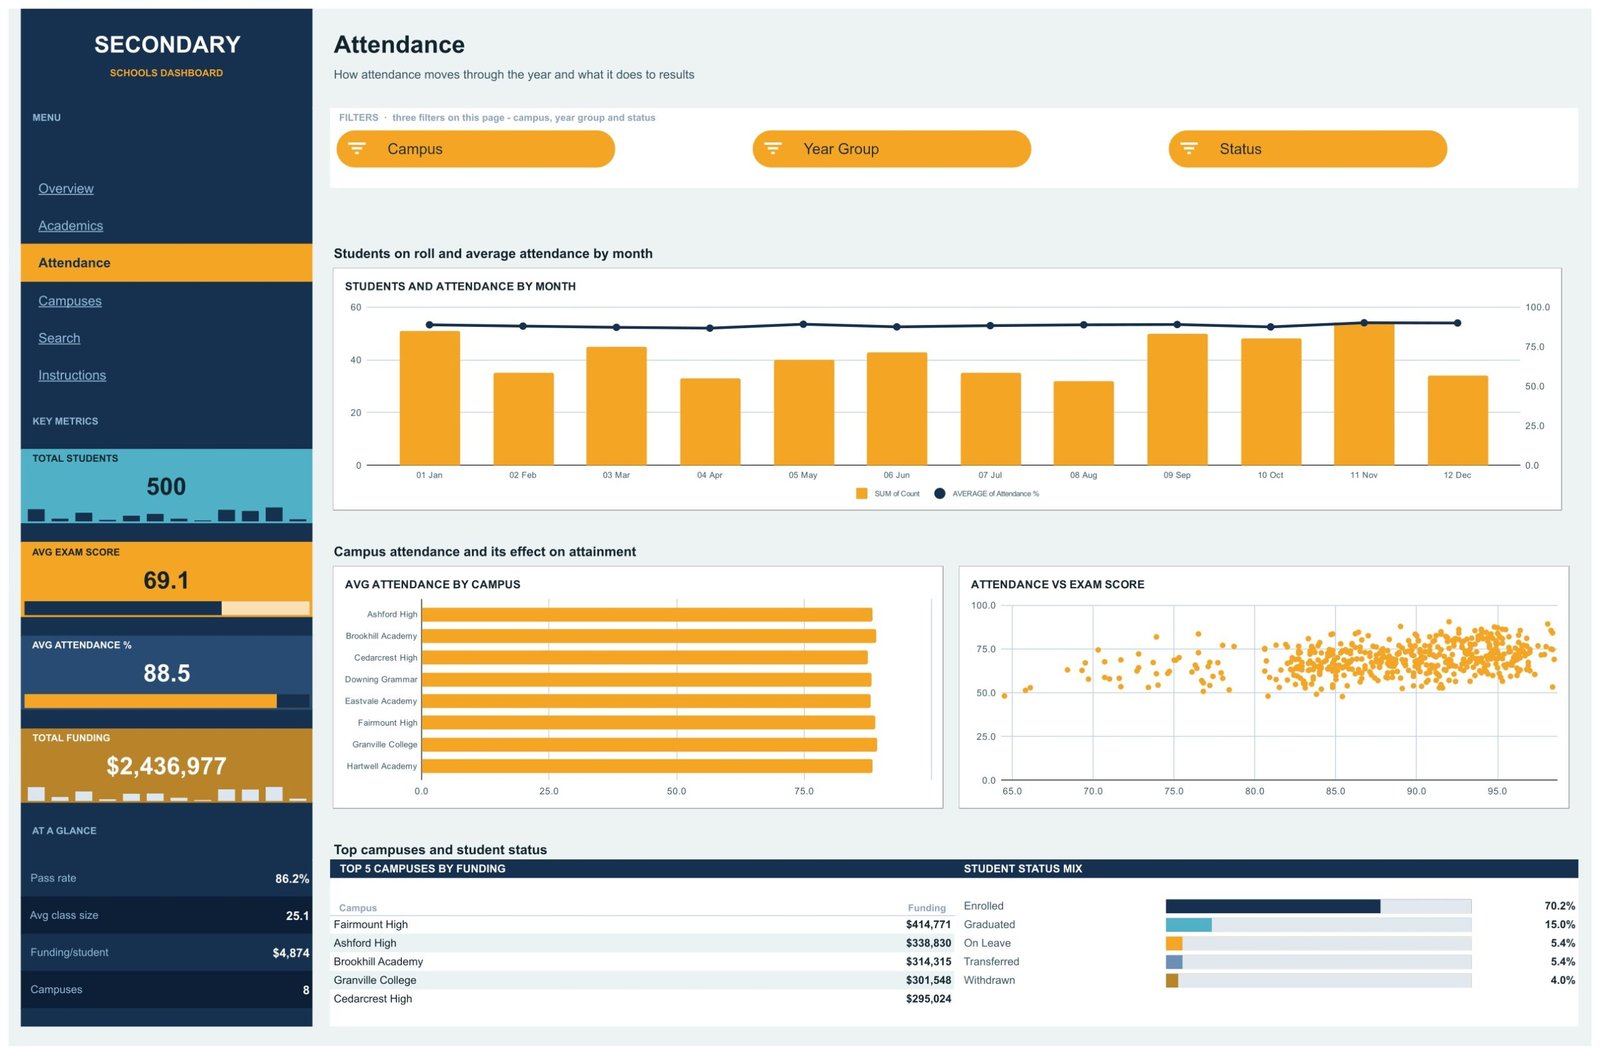
- 15 slicers across four pages – Overview filters on Month, Campus, Year Group and Programme; Academics on Campus, Subject, Year Group and Programme; Attendance on Campus, Year Group and Status; Campuses on District, Programme, Status and Month.
- 18 charts including a four-gauge Pass Rate by Programme panel, an exam-score histogram, an annual budget bridge, an attendance-and-enrolment combo chart and an Attendance vs Exam Score scatter of all 500 records.
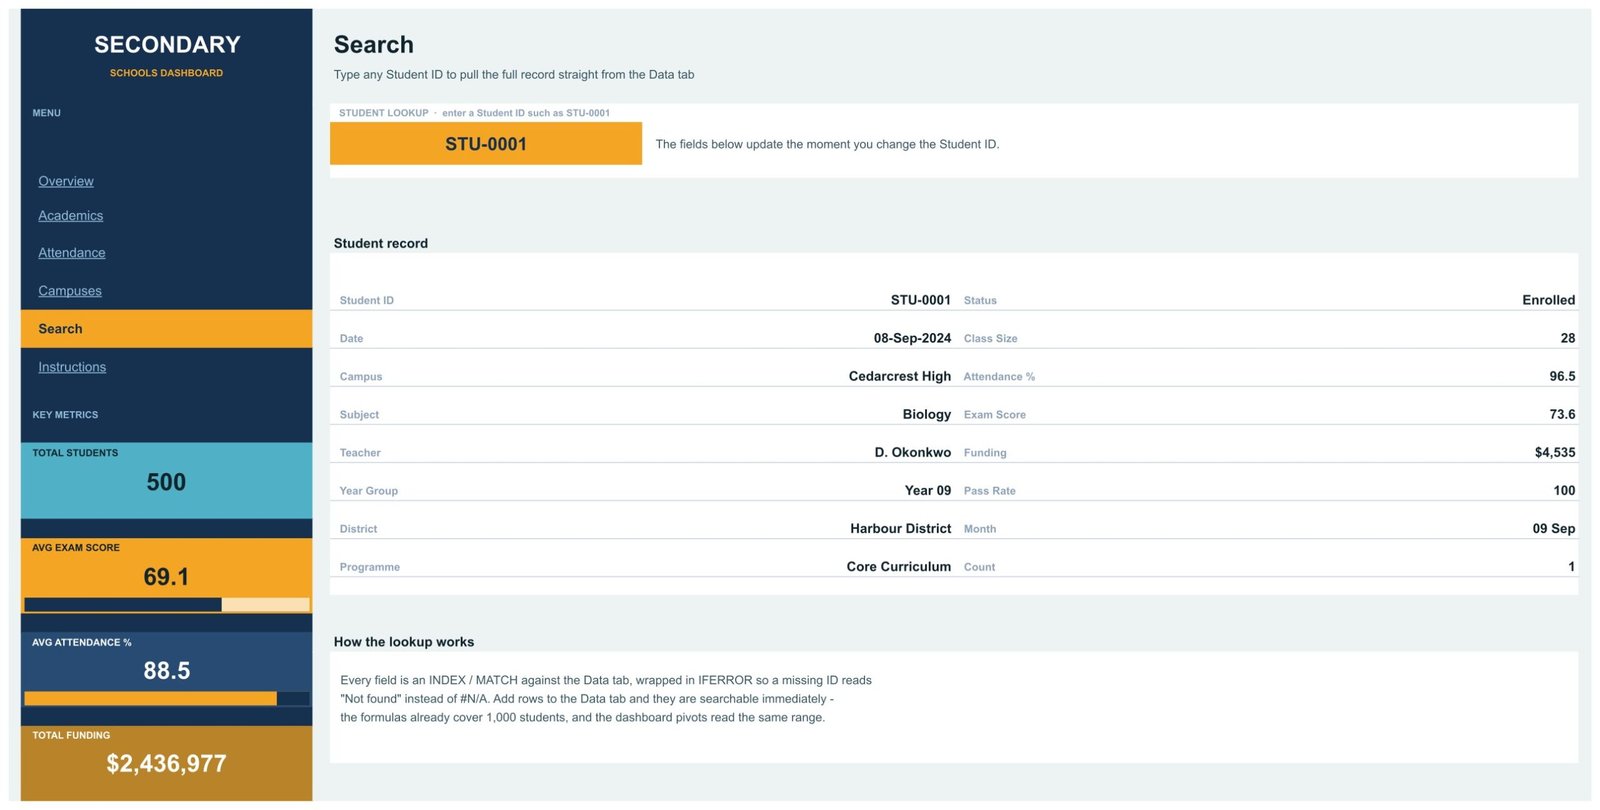
- A Student ID lookup page – type any ID and 16 fields resolve by INDEX/MATCH, wrapped in IFERROR so an unknown code reads “Not found” instead of #N/A.
- A Top 5 ranking panel and a five-band status mix repeated on all four analysis pages, both following the slicers.
- Room for 1,000 student rows – every pivot and formula reads A1:P1001, so you can more than double the sample without extending anything.
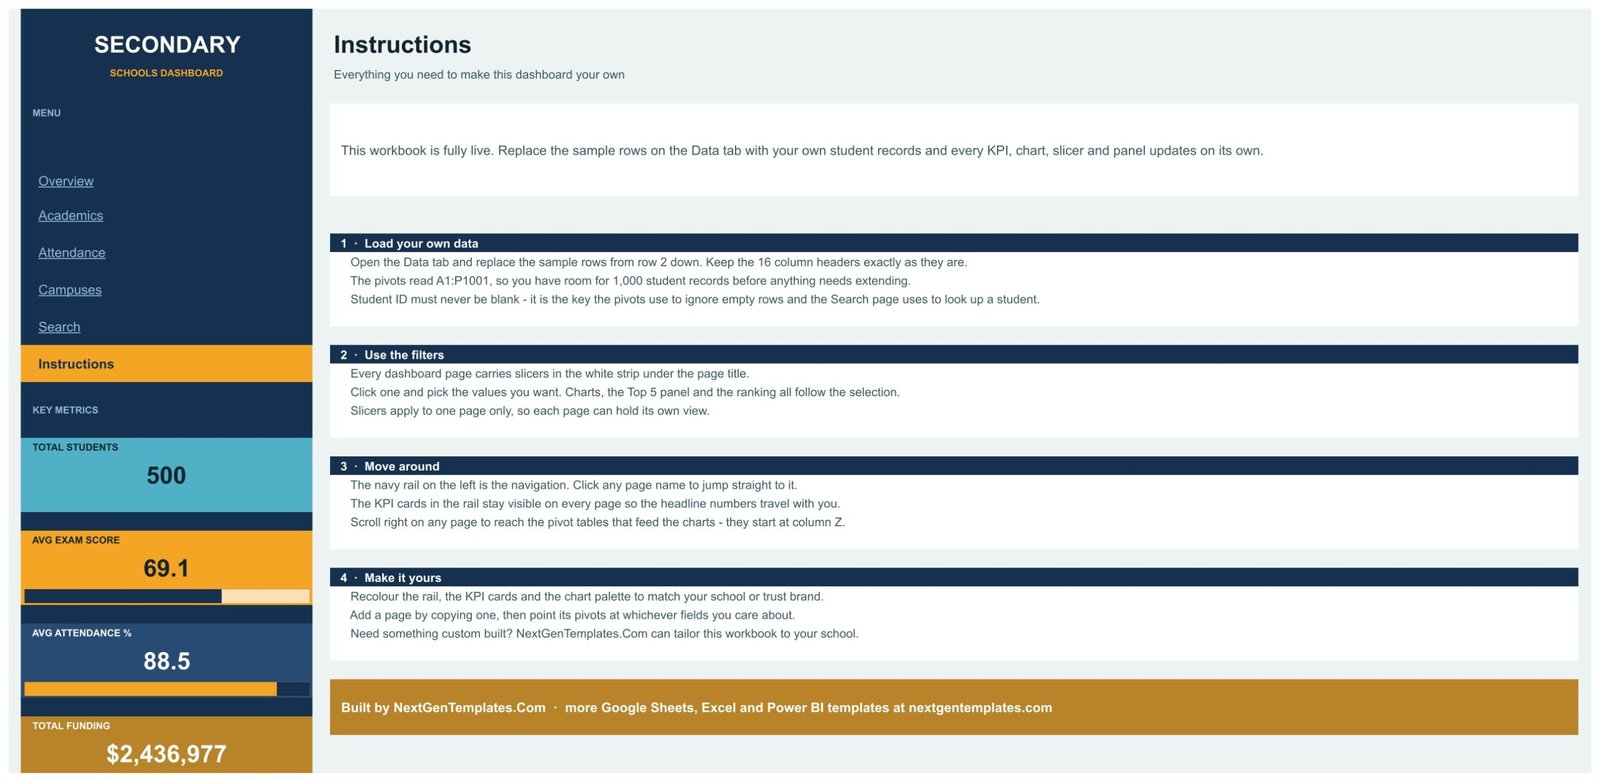
- A written Instructions tab covering loading data, using filters, moving around and recolouring the rail to your school or trust brand.
What’s Inside the Secondary Schools Dashboard in Google Sheets
Seven tabs. Five you look at, one you read, one you fill in.
Overview – Student Enrolment by Month as a labelled area chart, Pass Rate by Programme as four gauges (Advanced Studies 99, Core Curriculum 84, IB Diploma 95, Vocational Track 71), Distribution of Exam Scores as a histogram from 45 to 95, the Annual Budget Bridge waterfall, Top 5 Campuses by Funding, and the Student Status Mix.
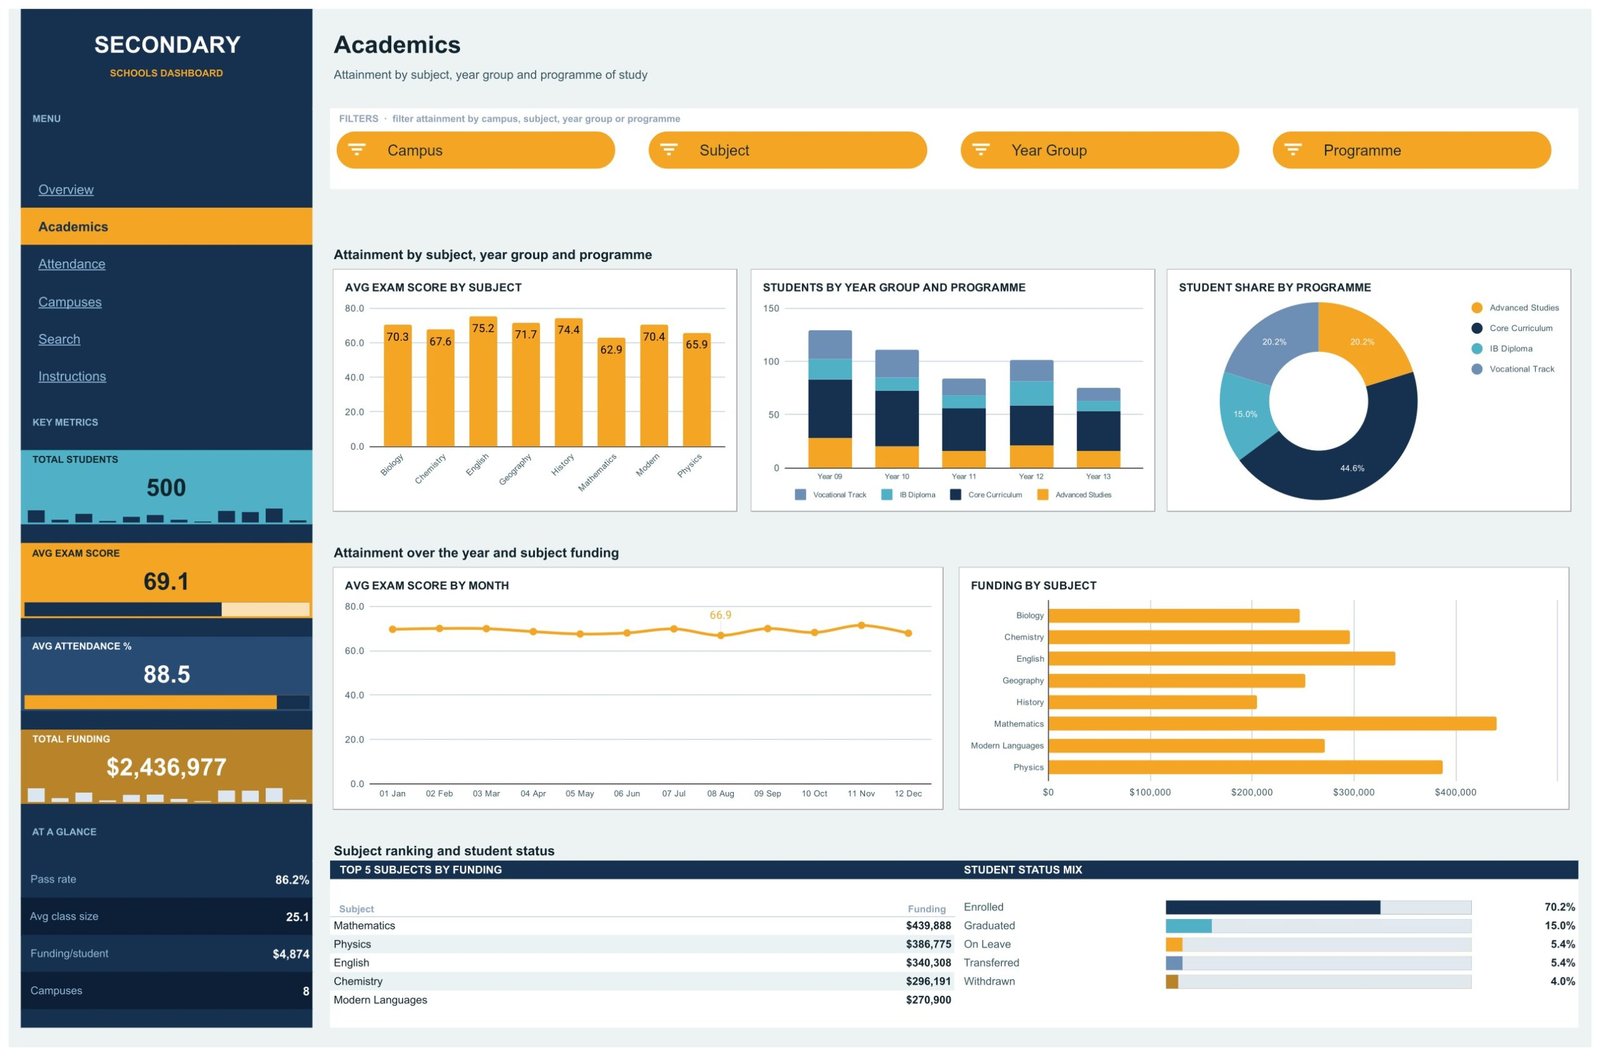
Academics – Avg Exam Score by Subject across eight subjects (English highest at 75.2, Mathematics lowest at 62.9), Students by Year Group and Programme as a stacked column over Years 09 to 13, Student Share by Programme as a donut (Core Curriculum 44.6%), Avg Exam Score by Month, Funding by Subject, and Top 5 Subjects by Funding led by Mathematics at $439,888.
Attendance – Students and Attendance by Month as a bar-plus-line combo, Avg Attendance by Campus across all eight campuses, and an Attendance vs Exam Score scatter that plots every record’s two figures together so you can see the spread for yourself.
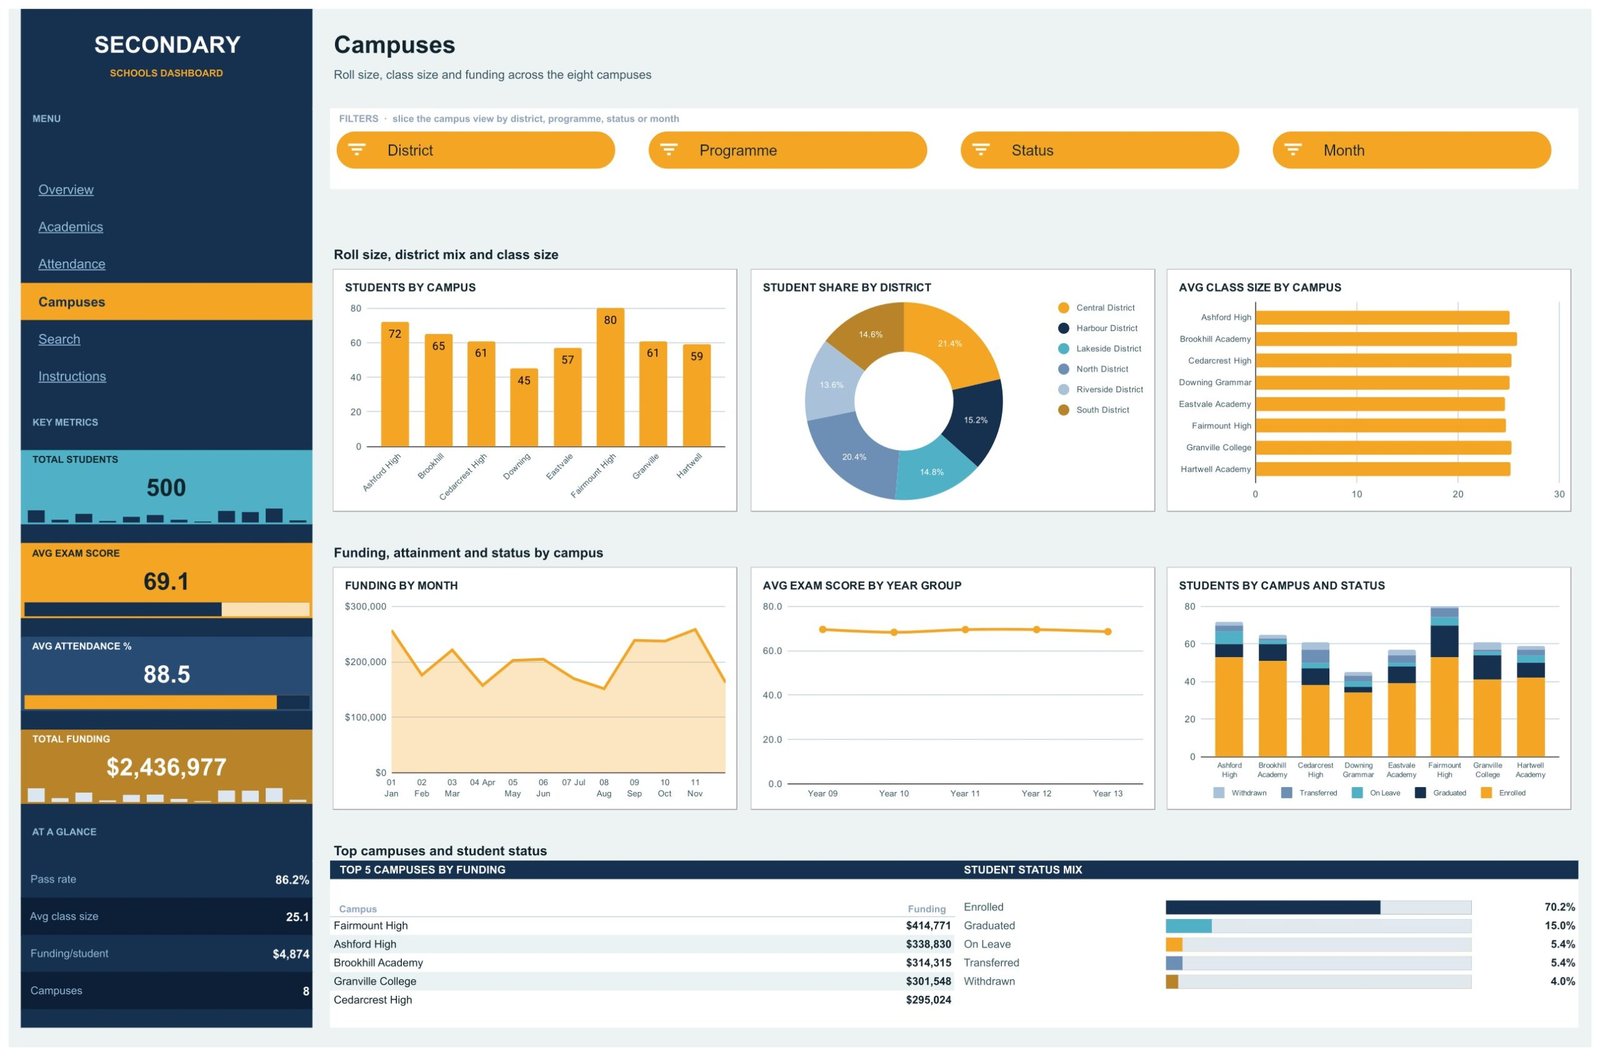
Campuses – Students by Campus (72, 65, 61, 45, 57, 80, 61, 59), Student Share by District across six districts, Avg Class Size by Campus, Funding by Month, Avg Exam Score by Year Group and Students by Campus and Status.
Search – one orange input cell. Type STU-0001 and the page returns 08-Sep-2024, Cedarcrest High, Biology, Year 09, Harbour District, Core Curriculum, Enrolled, class size 28, attendance 96.5, exam score 73.6, funding $4,535.
Instructions and Data – the guide, and the 16-column table everything reads from: Student ID, Date, Campus, Subject, Teacher, Year Group, District, Programme, Status, Class Size, Attendance %, Exam Score, Funding, Pass Rate, Month, Count.
Secondary Schools Dashboard in Google Sheets vs. Excel vs. a Paid BI Suite – Where This Fits
| This template (Google Sheets) | Excel dashboard build | Paid BI suite (Tableau / Power BI Pro class) | |
|---|---|---|---|
| Cost | $9.99 once | $19.99 once for our Excel edition, plus Microsoft 365 | $10-$70 per user per month |
| Platform | Google Sheets, any browser | Desktop Excel | Desktop authoring plus a cloud service |
| Setup time | Minutes – copy the sheet, paste your rows | Minutes, once Excel is installed | Days to weeks, plus a data model |
| Real-time team collaboration | Yes, native to Google Sheets | Only via OneDrive co-authoring | Yes |
| Mobile access | Yes, Google Sheets app or browser | Limited | Yes, dedicated apps |
| Customizable fields | Every column, chart and colour is editable | Yes | Yes, with modelling work |
| Share with link | Yes, standard Drive sharing | File send or OneDrive link | Licensed viewers only |
| Year-1 cost at 5 users | $9.99 | $19.99 plus licences | $600-$4,200 |
| Connects to a school MIS | No – you paste or import rows yourself | No | Possible with a connector and IT work |
| Pupil-level detail held | Coded Student ID only, by design | Same | Whatever you load into it |
A school MIS – the SIMS, Arbor or PowerSchool class of system – is a different category of product entirely and is not in this comparison. Those systems hold the statutory pupil record, run registration and manage safeguarding workflow. This workbook does none of that and is not a replacement for one.
Who This Template Is For – and Who It’s Not For
A good fit if you are a business manager, head of department, trust operations lead or bursar who already exports a table out of another system and wants a shareable reporting layer over it; if you run two to eight campuses and want funding, roll size and attainment side by side; or if you want a Google-native dashboard your leadership team can open on a phone.
Not for you if you need a live connection to your MIS, register or exam board – this file is static and imports nothing on its own. Not for you if you need to store pupil names, contact details, SEN records or safeguarding notes; use your MIS. Not for you if you want attainment prediction, results forecasting or a readiness score for an inspection – the workbook reports the numbers you give it and does not model, grade or predict anything. And it is not a statutory-returns tool: it produces no census, no funding return and no regulatory submission of any kind, and confers no compliance standing.
How to Use the Secondary Schools Dashboard in Google Sheets
- Open the PDF in your download and click the copy link. The workbook lands in your own Google Drive.
- Go to the Data tab and replace the sample rows from row 2 down, keeping all 16 headers exactly as they are.
- Keep Student ID populated on every row – it is the key the pivots use to ignore blanks and the Search page uses to look a record up. Use your own internal code, not a name.
- Refresh the pivots, then click any slicer on any page. Charts, the Top 5 panel and the status mix all follow the selection; slicers are per-page, so each page keeps its own view.
- Recolour the navigation rail, the KPI cards and the chart palette to match your school or trust brand from the Instructions tab.
Real-World Use Cases
Priya, business manager at a three-site trust. Each half-term she exports one row per pupil per subject, pastes it into the Data tab, and takes the Campuses page to the trust board – roll size, class size and funding per campus on one screen, with the district donut answering the catchment question before anyone asks it.
Daniel, head of mathematics. He filters the Academics page to Mathematics and Year 11, reads the average against the other seven subjects, and uses the Funding by Subject bar in his departmental bid. The Search page lets him pull one coded record during a conversation without opening the full table.
Amara, attendance lead. She uses the Attendance page’s combo chart to see how the monthly average moves across the year, then the scatter to see how widely attendance and exam scores spread across the cohort – a discussion starter for her termly review, not a verdict on any individual.
Frequently Asked Questions
Does this file hold pupil names or personal details?
Not in the sample. Students appear only as coded IDs such as STU-0001, and there is no name, date of birth, address, contact detail, guardian, SEN flag, free-school-meal status or behaviour record in any of the 16 columns. But each row is a pupil-level record, so if you map the codes to real children the file becomes personal data about minors. Keep the mapping key outside the workbook.
Is this a school MIS or a pupil record system?
No. It is a business reporting template. It does not hold the statutory pupil record, take registration, manage admissions or run any safeguarding or child-protection workflow, and it is not a substitute for a system that does.
Does it connect to my MIS, register or exam board?
No. The file is static and has no live connection to anything. You paste or import rows into the Data tab yourself, and the dashboard recalculates from what is there.
Can it predict attainment or forecast exam results?
No. Every figure on every page is arithmetic over the rows you supply – averages, counts, sums and shares. There is no model, no projection and no forecast anywhere in the workbook.
How many students can it hold?
The pivots and formulas read A1:P1001, so 1,000 student rows work with no changes at all. Beyond that you extend the ranges yourself.
How is the Pass Rate calculated?
The Data tab carries a Pass Rate column holding 0 or 100 on each row. The 86.2% headline and the four programme gauges are the average of that flag, so the number is exactly as good as the pass/fail decision you record in the column.
What is the Annual Budget Bridge based on?
It apportions your Funding column total into illustrative inflow and outflow bands – State Grant, Local Levy, Staff Costs, Facilities Upkeep and Programme Spend – using fixed percentage splits written into the sheet. It is a shape-of-budget illustration you edit to your own ratios, not a reconciliation of a real ledger.
Do the four KPI cards follow the slicers?
No. The rail cards and the At-a-glance strip read the full Data range so the headline numbers stay constant as you move between pages. The charts, the Top 5 panel and the status mix are the parts that respond to a slicer.
About the Author
Built by PK – Microsoft Certified Professional with 15+ years of Excel, Google Sheets, and Power BI experience. Founder of NextGenTemplates, reaching 300K+ subscribers across YouTube channels. Every template is hand-built and tested before release.
Explore Related Templates
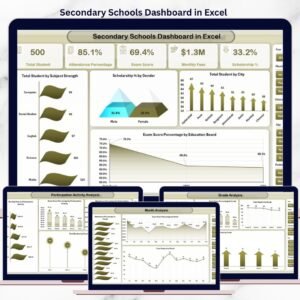
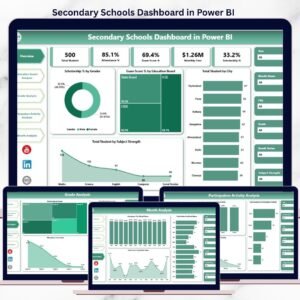
The same dashboard is available in other tools: Secondary Schools Dashboard in Excel and Secondary Schools Dashboard in Power BI. If you want a month-picker scorecard with traffic lights instead of these analysis pages, the Secondary Schools KPI Dashboard in Excel is a different template, not a duplicate of this one.
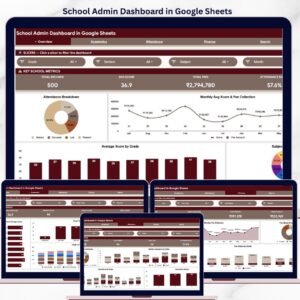
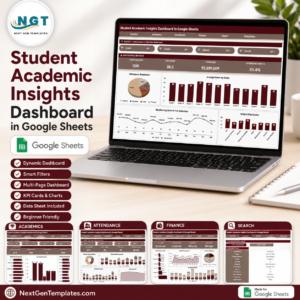
Staying in Google Sheets, see the School Admin Dashboard in Google Sheets, the Student Academic Insights Dashboard in Google Sheets and the Attendance Tracker in Google Sheets. To buy the set, the Education & School Management Bundle collects eight education templates in one purchase. Browse everything in Google Sheets Dashboards or the wider Google Sheets category.
Read the full walkthrough of every page on NeoTechNavigators.
Add the Secondary Schools Dashboard in Google Sheets to your cart for $9.99 and have a working reporting layer over your student table this afternoon. Instant download, one payment, no subscription, help within 72 hours if anything does not work.
Watch the step-by-step video Demo:
Last updated: 1 September 2026.
Compatibility and Requirements
- Works in Google Sheets. You need a free Google account and a web browser.
- Google explains how charts work in Sheets in Add and edit a chart or graph.






























Reviews
There are no reviews yet.