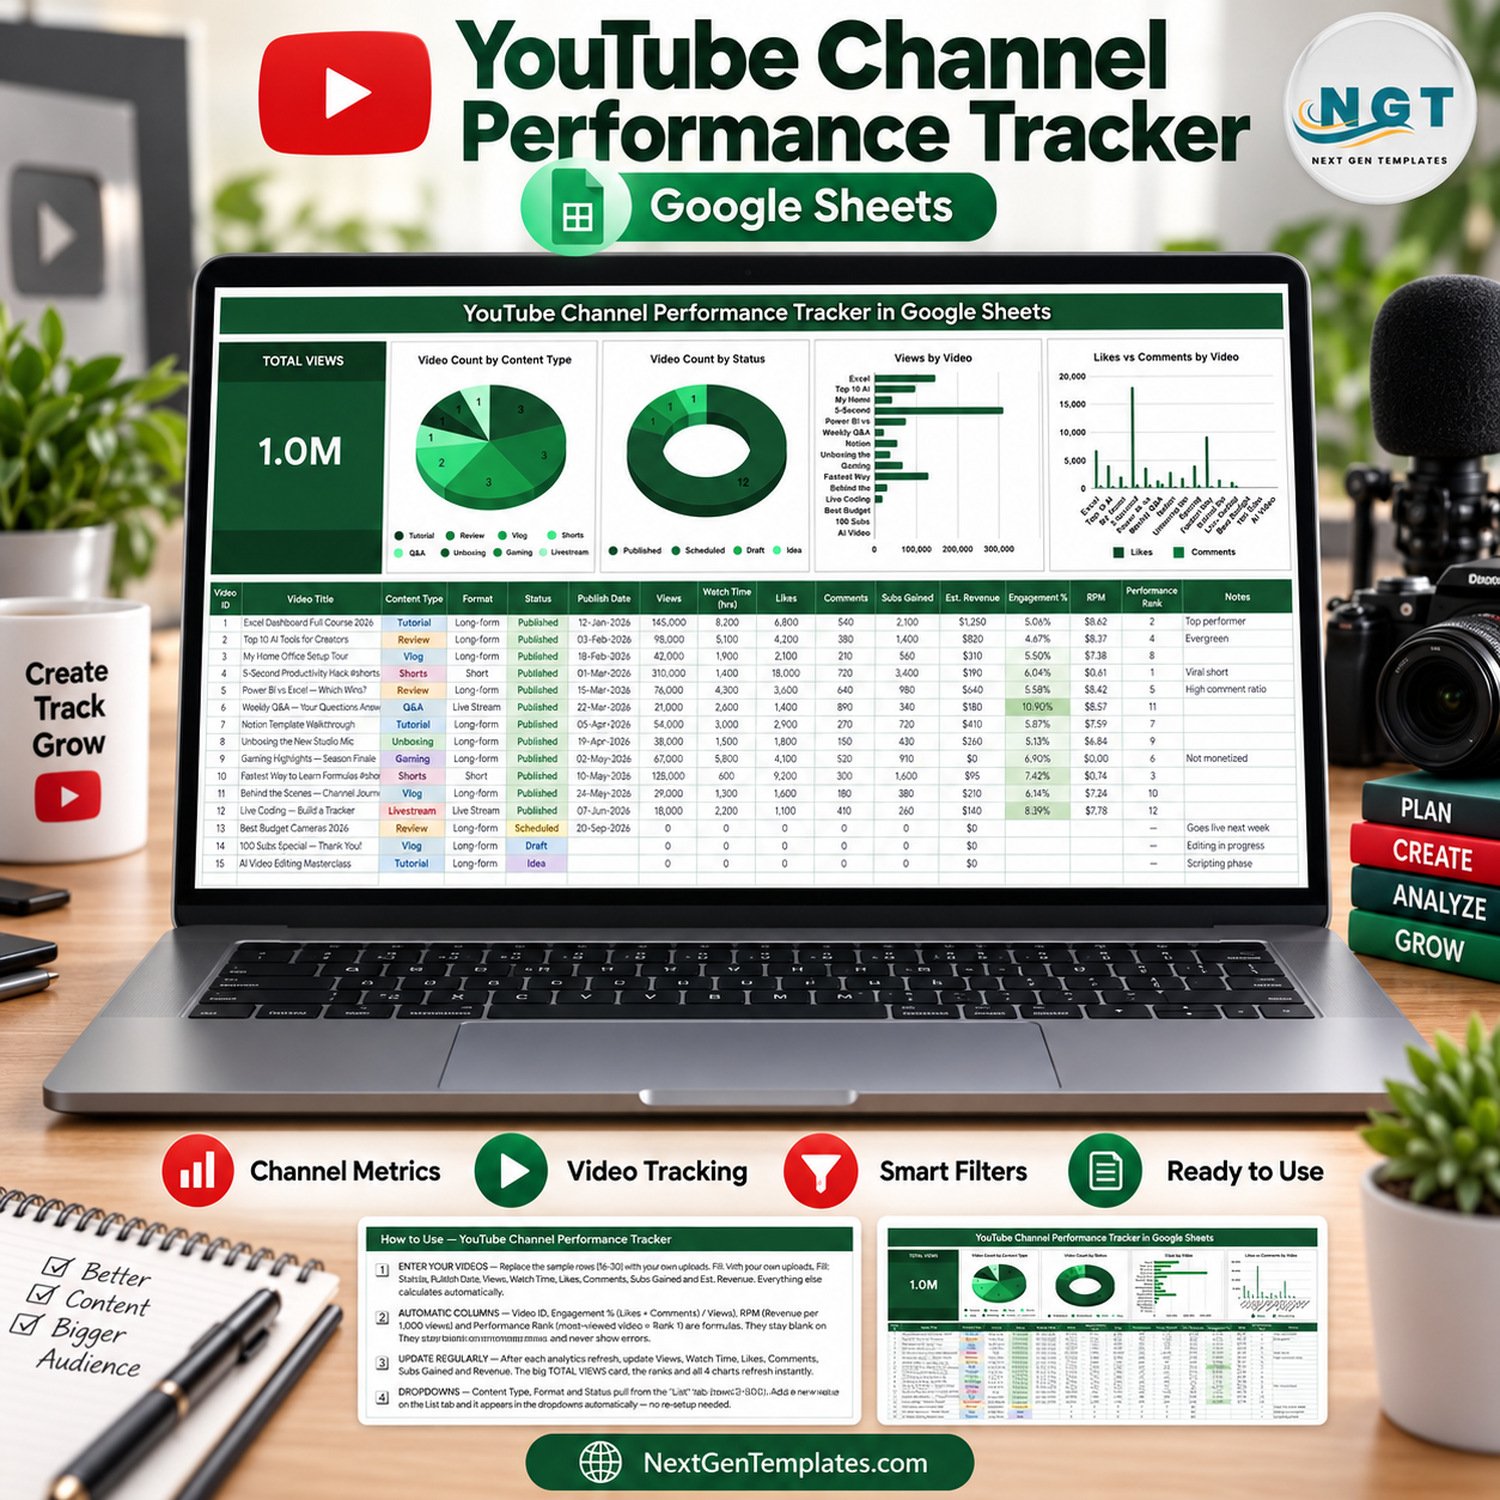
The YouTube Channel Performance Tracker in Google Sheets logs every upload across 16 columns, calculates 4 of them for you, and drives 1 headline KPI card plus 4 live charts from a single sheet. The sample file ships 15 videos totalling 1.0M views, and the data range runs to row 1000, so roughly 985 uploads fit before you ever touch a formula.
🌍 Join 8,400+ teams in 40+ countries using NextGenTemplates to replace paid SaaS tools with one-time-purchase Excel, Google Sheets, Power BI and HTML templates.
✅ Instant download · One-time payment · No subscription · No per-user fees · Lifetime access
⚠️ Read this before you buy. This is a manual Google Sheets tracker. You copy your numbers across from YouTube Studio yourself. There is no YouTube API connection, no automatic import, no live sync and no affiliation with YouTube or Google. It is also a different template from our multi-page YouTube Channel Analytics Dashboard in Google Sheets and its Power BI edition, which are analytical dashboards rather than a one-page log.
🔑 Key Features of the YouTube Channel Performance Tracker in Google Sheets
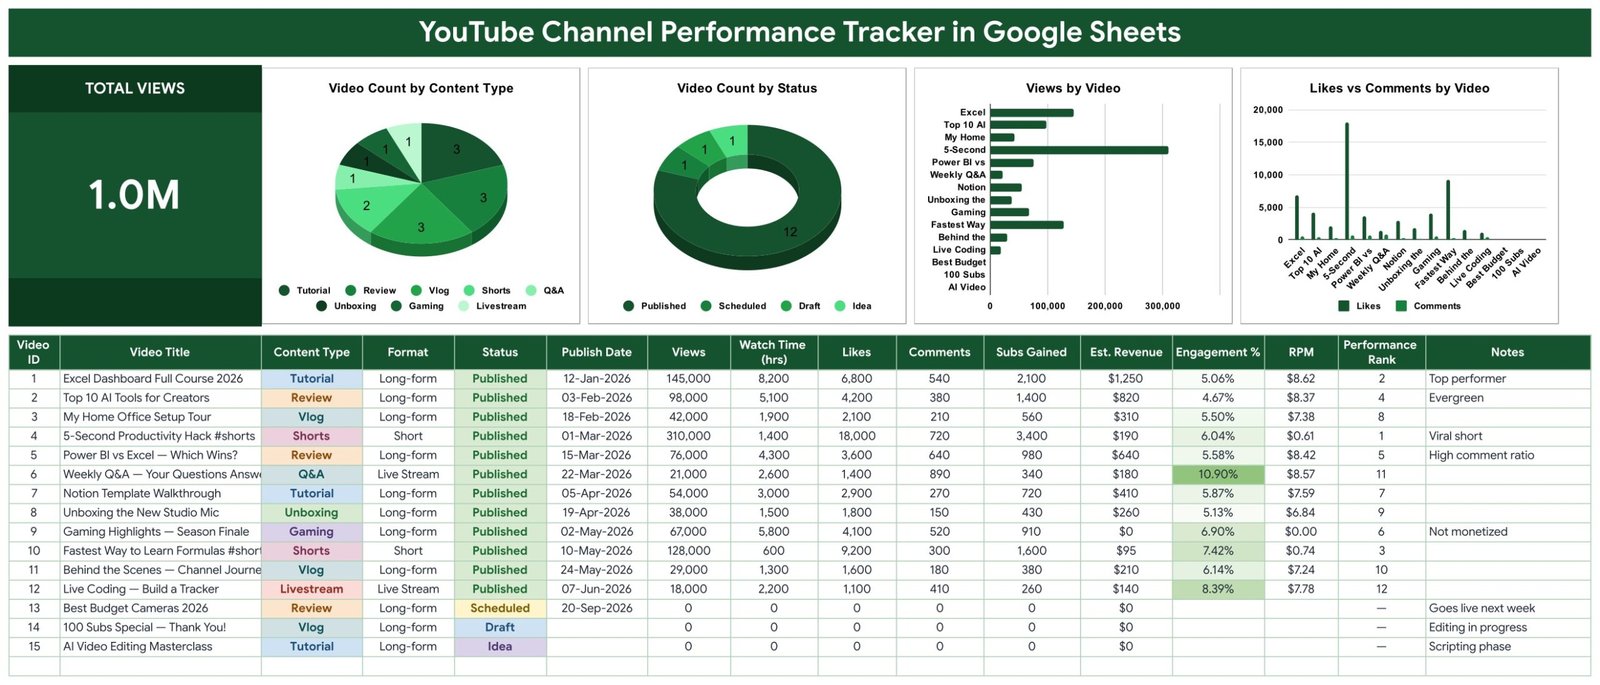
🔹 16 columns per video, one row per upload. Video ID, Video Title, Content Type, Format, Status, Publish Date, Views, Watch Time (hrs), Likes, Comments, Subs Gained, Est. Revenue, Engagement %, RPM, Performance Rank and Notes. You type ten of them; the sheet fills the rest.
🔹 4 columns calculate themselves. Video ID numbers each row, Engagement % is (Likes + Comments) / Views, RPM is revenue per 1,000 views, and Performance Rank sorts your catalogue so the most-viewed video is Rank 1. All four stay blank on empty rows and never throw errors.
🔹 One KPI card and four charts, all live. A full-height TOTAL VIEWS card sits beside Video Count by Content Type, Video Count by Status, Views by Video and Likes vs Comments by Video. Every chart reads the data columns directly with the built-in Aggregate option, so there are no hidden helper tables to maintain.
🔹 Three dropdown columns driven by a List tab. Content Type offers 8 values (Tutorial, Review, Vlog, Shorts, Q&A, Unboxing, Gaming and Livestream), Format offers 3 (Long-form, Short and Live Stream) and Status offers 4 (Published, Scheduled, Draft and Idea). Add a value to the List tab and it appears in the dropdown automatically.
🔹 Built for a real catalogue, not a demo. The charts and formulas cover rows 16 to 1000 and the List tab covers rows 2 to 500, so a channel with several hundred uploads never outgrows the file.
🔹 Recolour and re-currency it in minutes. The palette lives in a single const C = {...} block at the top of the script. Est. Revenue and RPM use $ by default; select those columns and switch to ₹, € or £ through Format → Number.
📦 What’s Inside the Tracker
Page 1: Tracker Sheet — KPI Card, Four Charts and the Video Log
The working page. A TOTAL VIEWS card reads 1.0M on the sample data, and four charts sit across the top: Video Count by Content Type, Video Count by Status, Views by Video and Likes vs Comments by Video. Underneath, the 16-column video log carries colour-coded Content Type, Format and Status pills, conditional shading on Engagement %, and a Notes column for context such as “Viral short” or “Not monetized”.
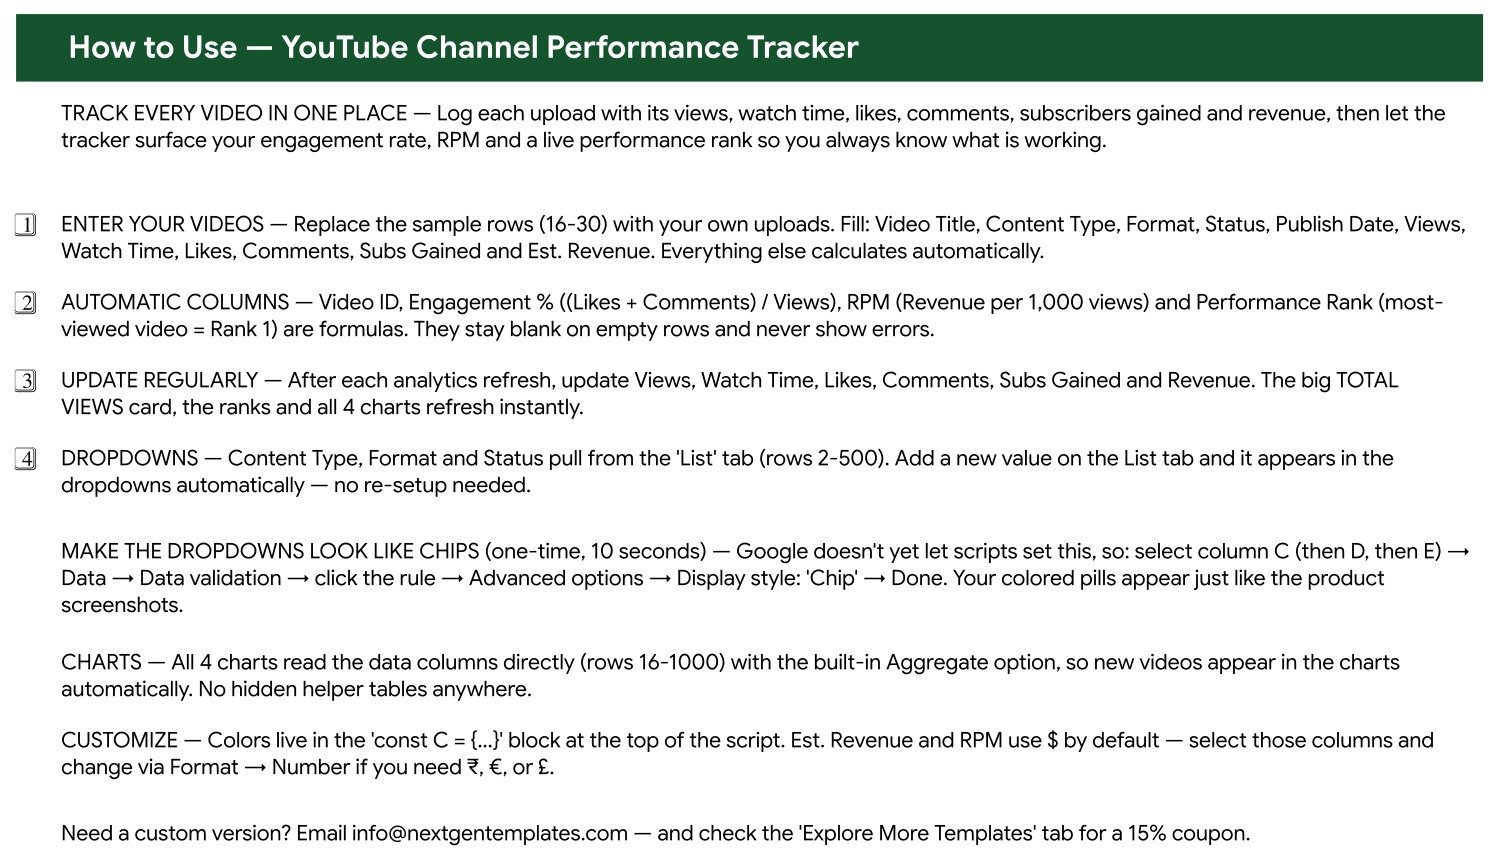
Page 2: How to Use — Setup, Formulas and the Chip Step
A written walkthrough covering the four numbered setup steps, which columns calculate themselves, and the one manual task the script cannot do: switching Content Type, Format and Status to Google’s “Chip” display style via Data → Data validation → Advanced options, which takes about ten seconds per column. It also explains where the colours live and how to change the currency.
Page 3: Explore More Templates — Catalogue and Coupon
A reference tab listing recommended Google Sheets, Excel and Power BI templates with their categories and prices, a set of Popular Categories links, and a WELCOME15 coupon code worth 15% off your next purchase at NextGenTemplates.com.

A hidden List tab holds the dropdown values for Content Type, Format and Status across rows 2 to 500.
📊 This Tracker vs. a Microsoft Excel Log vs. TubeBuddy / vidIQ — Where It Fits
| Feature | This Google Sheets Tracker | Microsoft Excel log | TubeBuddy / vidIQ / Social Blade |
|---|---|---|---|
| Cost | $6.99 one-time ✅ | $0 if you build it yourself | $9–$99 / month, per channel |
| Platform | Google Sheets, any browser ✅ | Excel desktop or Microsoft 365 | Browser extension + web app |
| Setup time | Under 10 minutes ✅ | Hours to build charts and formulas | Minutes, but account linking required |
| Data source | Manual entry from YouTube Studio | Manual entry | Automatic API sync ✅ |
| Real-time team collaboration | Yes, native in Sheets ✅ | Only via OneDrive co-authoring | Paid seats per user |
| Mobile access | Google Sheets app ✅ | Excel mobile, limited charts | Yes |
| Customisable columns and colours | Fully editable ✅ | Fully editable | Fixed vendor layout |
| Tracks drafts, ideas and scheduled videos | Yes — 4 statuses ✅ | Only if you build it | Partly, in the paid tiers |
| Year-1 cost at 5 users | $6.99 total ✅ | $0–$400 in build time | $540–$5,940 |
If you want a tidy, shareable record of what you published and how it performed — without a monthly bill or an API connection — this tracker sits in the sweet spot. If you need automatic data pulls, buy vidIQ instead.
👥 Who This Template Is For — and Who It’s Not For
✅ Built for:
- Solo creators with 10–500 published videos who want one place to see what worked
- Small channel teams where an editor, a thumbnail designer and a host all need the same view
- Agencies and freelancers reporting monthly channel performance to a client
- Creators planning ahead, who need Idea, Draft and Scheduled rows alongside published ones
❌ Not for:
- Anyone expecting numbers to arrive on their own — every figure here is typed in by hand
- Multi-channel networks needing thousands of videos or cross-channel roll-ups
- Teams that need audience retention curves, traffic sources or demographic breakdowns
- Anyone who wants an Excel file — this is a Google Sheets template only
⚙️ How to Use It
- Open the PDF in your download and click the Google Sheets link to create your own copy in Drive.
- Replace the sample rows 16 to 30 with your own uploads.
- Fill Video Title, Content Type, Format, Status, Publish Date, Views, Watch Time, Likes, Comments, Subs Gained and Est. Revenue.
- Leave Video ID, Engagement %, RPM and Performance Rank alone — they calculate themselves.
- Set the three dropdown columns to the “Chip” display style once, so the coloured pills match the screenshots.
- After each YouTube Studio refresh, update the numbers. The KPI card, the ranks and all four charts redraw instantly.
💼 Real-World Use Cases
Dev runs a 40,000-subscriber tutorial channel on his own. He logs each upload the week it goes live, then sorts by Performance Rank at the end of the month. Seeing that his Shorts sit at ranks 1 and 3 while earning $0.61 and $0.74 RPM told him to keep making them for reach and keep long-form for revenue.
Priya manages content for a small SaaS company. Her Status column carries Idea, Draft and Scheduled rows as well as Published ones, so the same sheet is both a pipeline and a report. She shares a view-only link in the Monday stand-up instead of exporting slides.
Marco freelances as a channel manager for three clients. He keeps one copy of the tracker per client, changes the currency to € in two of them, and pastes the Views by Video chart straight into his monthly invoice email.
❓ Frequently Asked Questions
Does this tracker connect to YouTube automatically?
No. This is a manual Google Sheets template with no API connection, no add-on and no sync. You copy Views, Watch Time, Likes, Comments, Subs Gained and Est. Revenue across from YouTube Studio yourself, and the calculated columns and charts update the moment you do.
What does the YouTube Channel Performance Tracker in Google Sheets calculate for me?
Four columns: Video ID, Engagement % as (Likes + Comments) / Views, RPM as revenue per 1,000 views, and Performance Rank where the most-viewed video is Rank 1. Everything else is a value you enter, and empty rows stay blank rather than showing errors.
How many videos can it hold?
The formulas and all four charts cover rows 16 to 1000, which is roughly 985 videos. The List tab that feeds the dropdowns runs to row 500. Most channels never reach either limit, and both ranges can be extended.
How long does setup take?
Under ten minutes. Make your copy from the PDF link, paste your videos over the 15 sample rows, and switch the three dropdown columns to Chip display style. No scripts to authorise, no permissions to grant.
How is this different from the YouTube Channel Analytics Dashboard?
The Analytics Dashboard is a multi-page analytical template with its own data sheet and several report pages. This is a one-page tracker: a single log of every video with one KPI card and four charts above it. Many creators buy the tracker first and move up later.
Can I change the currency and the colours?
Yes. Est. Revenue and RPM use $ by default. Select those two columns and switch to ₹, € or £ through Format → Number. The whole palette lives in one const block at the top of the script, so a rebrand is a single edit.
How does this compare to paying for TubeBuddy or vidIQ?
Those tools pull data automatically and cost $9 to $99 every month. This tracker costs $6.99 once and needs manual entry, but you own the file, you can add any column you like, and nothing expires or locks you out of your own history.
👤 About the Author
Built by PK — Microsoft Certified Professional with 15+ years of Excel, Google Sheets and Power BI experience. Founder of NextGenTemplates, reaching 300K+ subscribers across YouTube channels (@PKAnExcelExpert, @NextGenTemplates, @NeoTechNavigators). Every template is hand-built and tested before release.
🔗 Explore Related Templates
- YouTube Channel Analytics Dashboard in Google Sheets — the multi-page analytical version, when one log page is no longer enough.
- Content Creator Revenue Dashboard in Google Sheets — for creators earning across sponsorships, affiliates and ad revenue.
- Podcast Analytics Dashboard in Google Sheets — the same idea for audio, if you publish both.
- Side Hustle Income Tracker in Google Sheets — pairs well once the channel starts paying.
Also available as: the Power BI edition of our YouTube channel analytics template. Browse more Google Sheets Dashboards and Excel Dashboard Templates.
📖 Click here to read the Detailed Blog Post
🎥 Visit our YouTube channel for step-by-step video tutorials
👉 YouTube.com/@NextGenTemplates
Watch the step-by-step video Demo:
📅 Last updated: September 2026