


🔑 Key Features of YouTube Channel Analytics Dashboard in Power BI
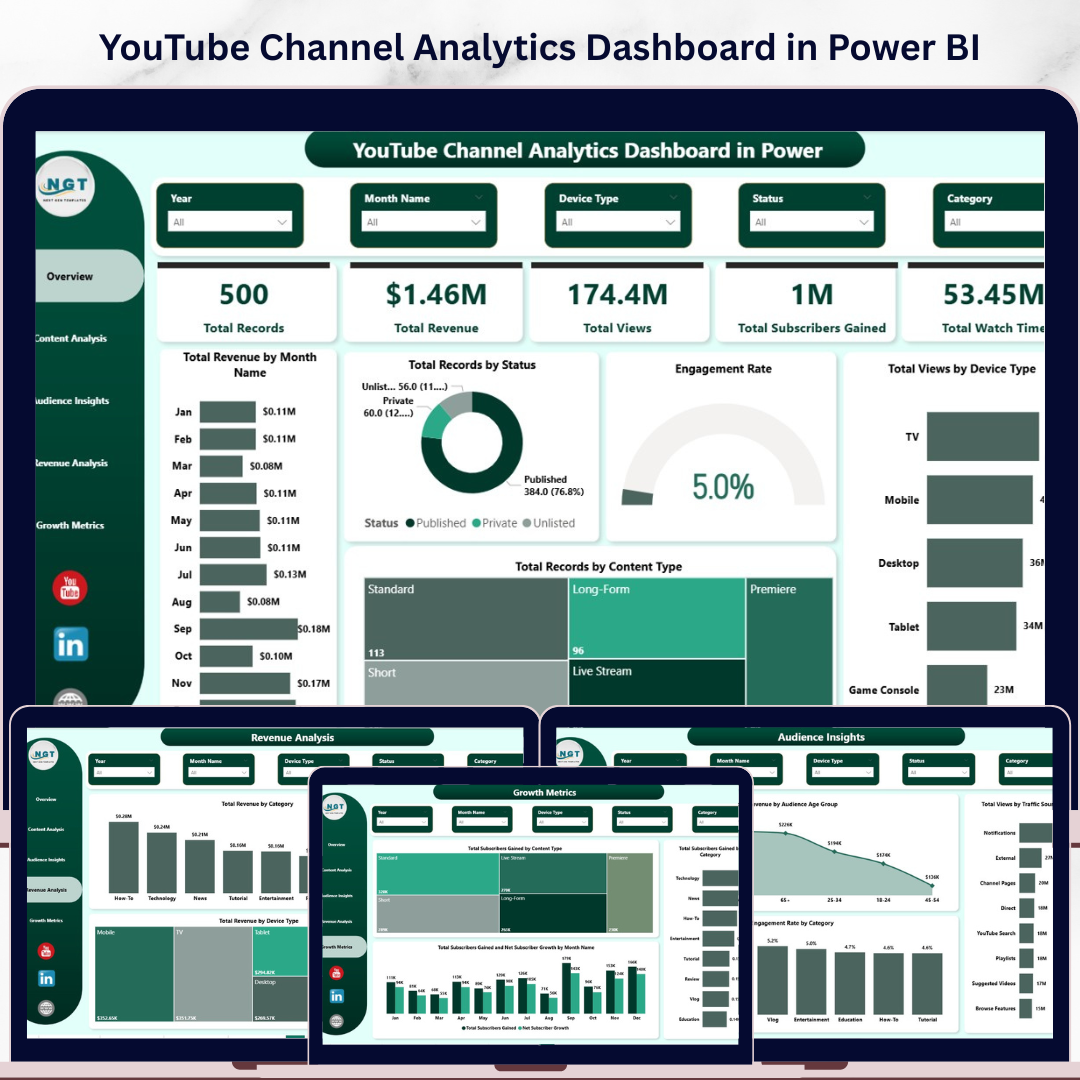
YouTube Channel Analytics Dashboard in Power BI is your ultimate command center for tracking every metric that matters to content creators, media agencies, and digital marketers. This professionally designed Power BI dashboard template features 5 interactive pages covering channel overview, content analysis, audience insights, revenue analysis, and growth metrics. Whether you manage a single channel or an entire media portfolio, this template transforms raw YouTube data into stunning visual insights — no coding required.
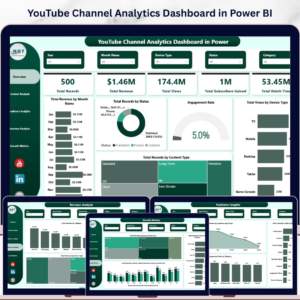
This dashboard tracks key performance indicators including Total Records, Total Revenue, Total Views, Total Subscribers Gained, and Total Watch Time. With built-in slicers for quick filtering, you can slice your data by date, content type, device, traffic source, and more to uncover hidden patterns in your channel performance. Explore our full collection of Power BI Dashboard Templates for more ready-to-use analytics solutions.
📦 What’s Inside the YouTube Channel Analytics Dashboard in Power BI
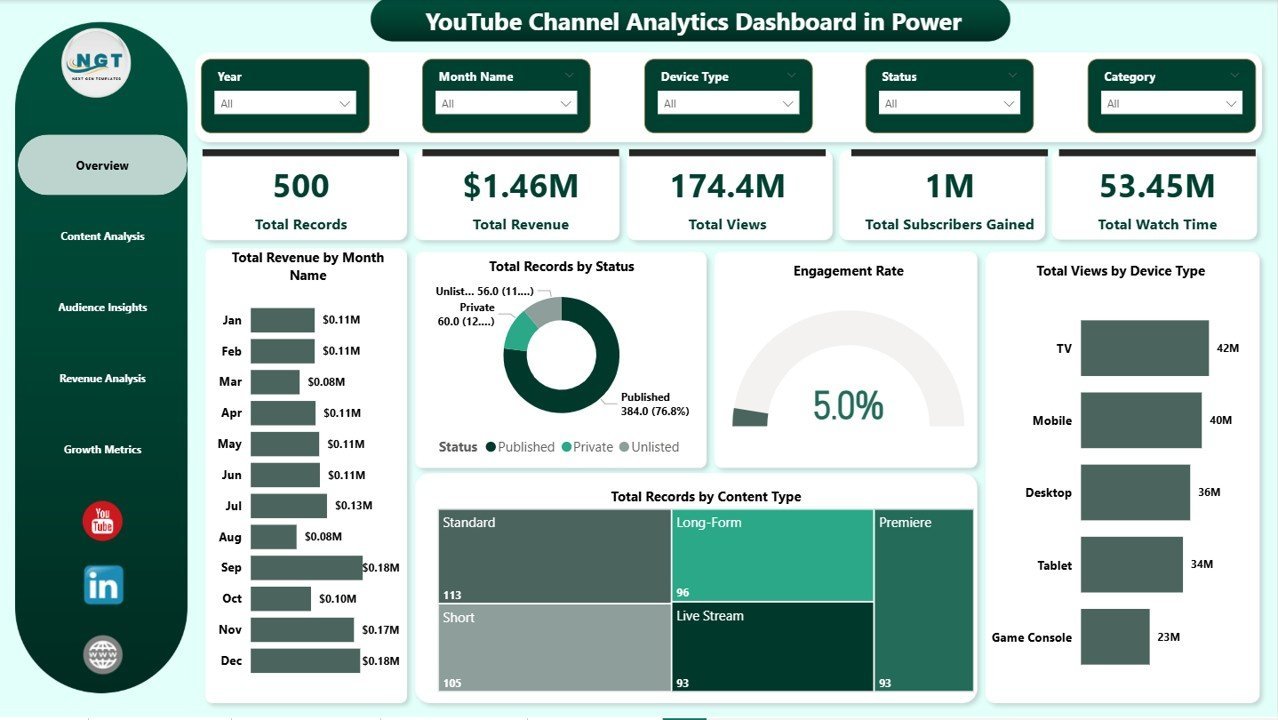
📊 Overview Page — Get a bird’s-eye view of your channel health with KPI cards for Total Records, Total Revenue, Total Views, Total Subscribers Gained, and Total Watch Time. Interactive charts display Total Revenue by Month Name, Total Records by Status, Engagement Rate, Total Views by Device Type, and Total Records by Content Type. Multiple slicers let you filter the entire dashboard instantly.
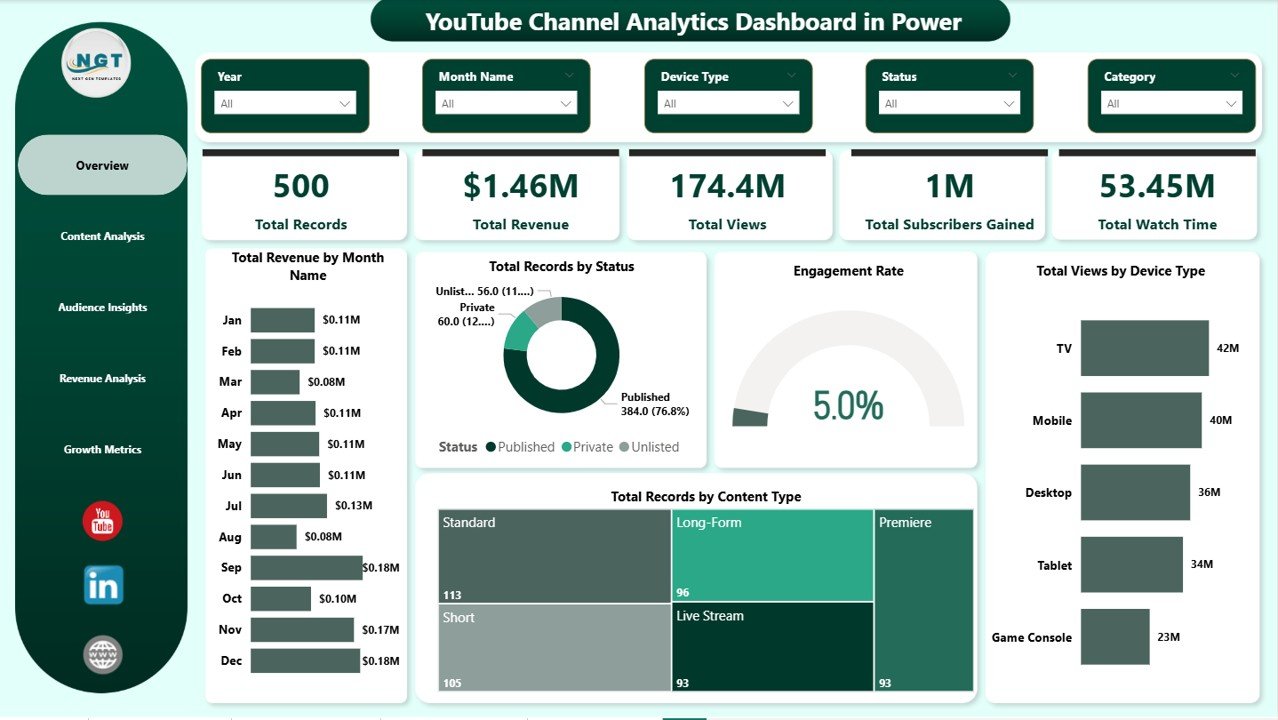 Overview Page
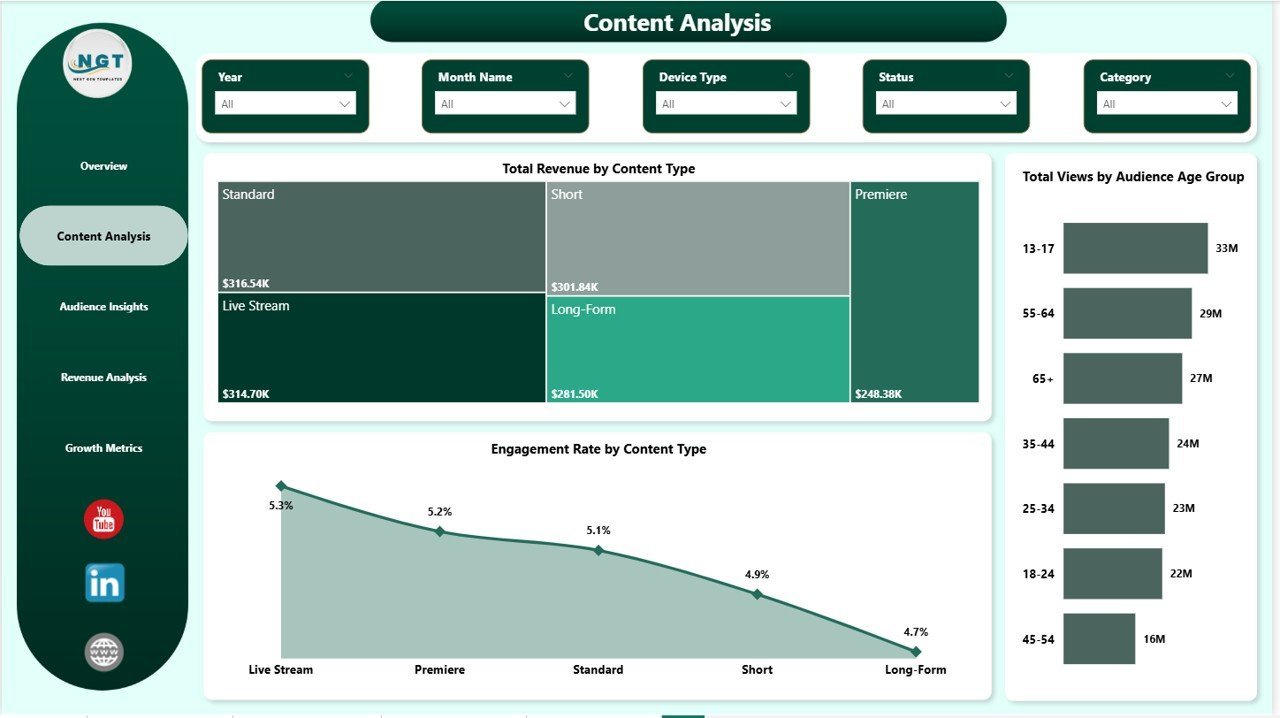
📈 Content Analysis — Dive deep into your content performance with charts showing Total Revenue by Content Type, Total Views by Audience Age Group, and Engagement Rate by Content Type. Identify which content formats drive the most revenue and engagement across your channel.
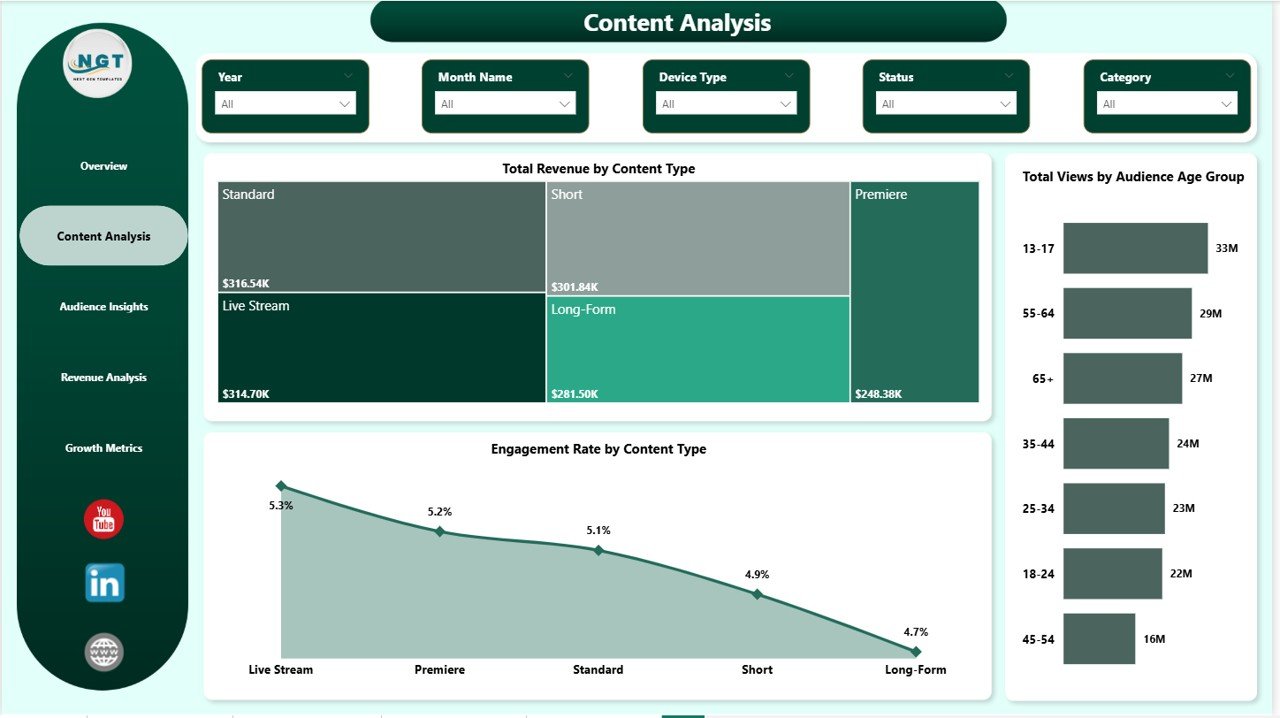 Content Analysis
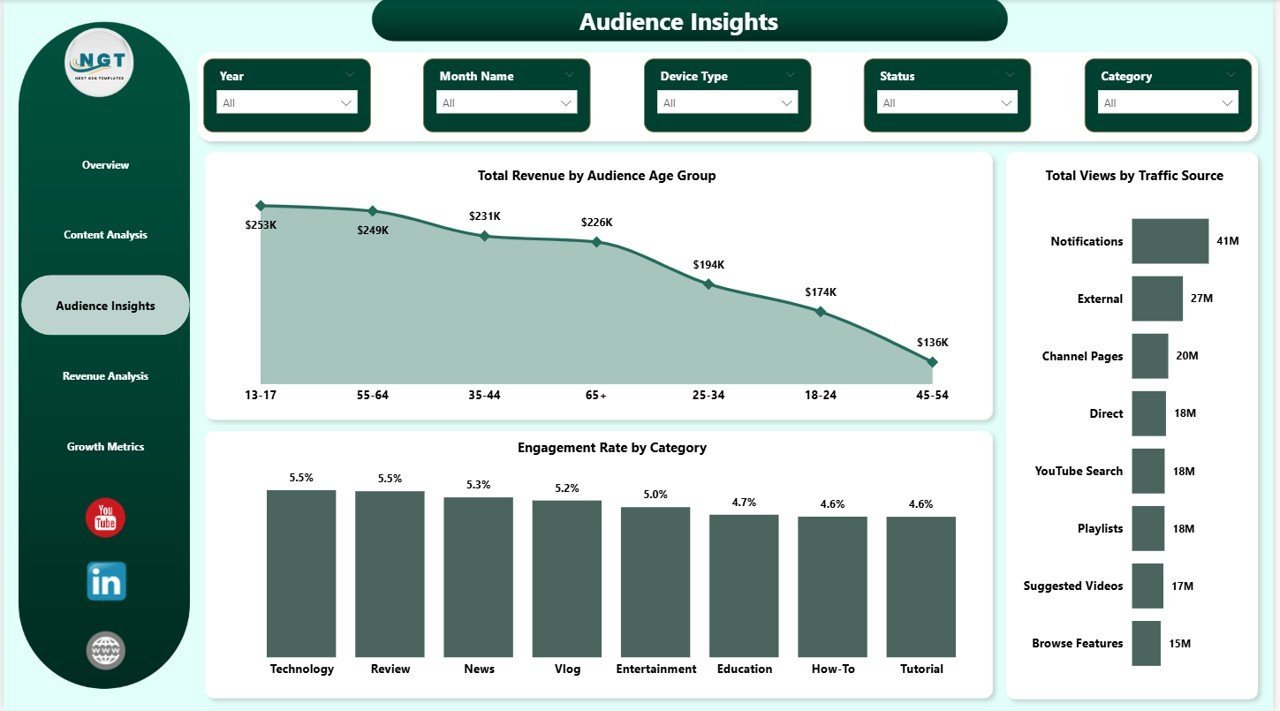
👥 Audience Insights — Understand who watches your videos with visualizations for Total Revenue by Audience Age Group, Total Views by Traffic Source, and Engagement Rate by Category. Perfect for tailoring your content strategy to your most valuable audience segments.
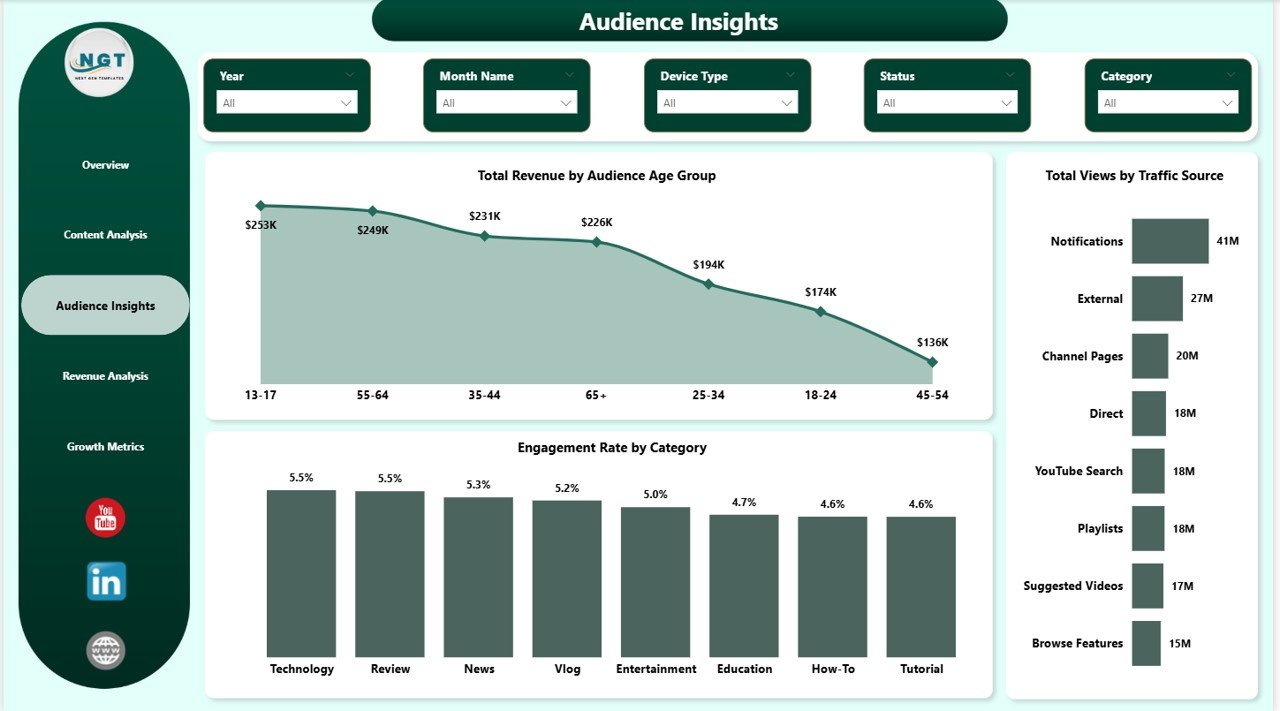 Audience Insights
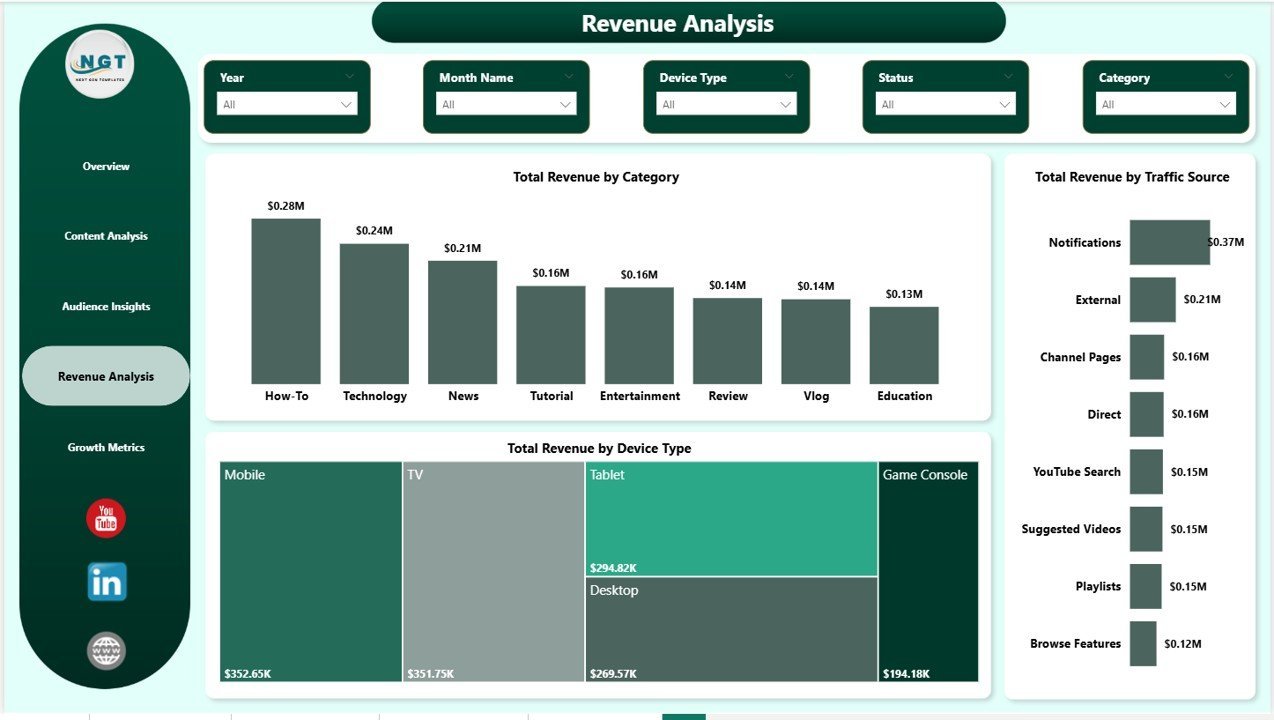
💰 Revenue Analysis — Track your monetization performance with charts for Total Revenue by Category, Total Revenue by Traffic Source, and Total Revenue by Device Type. Pinpoint exactly where your money comes from and optimize your revenue streams accordingly.
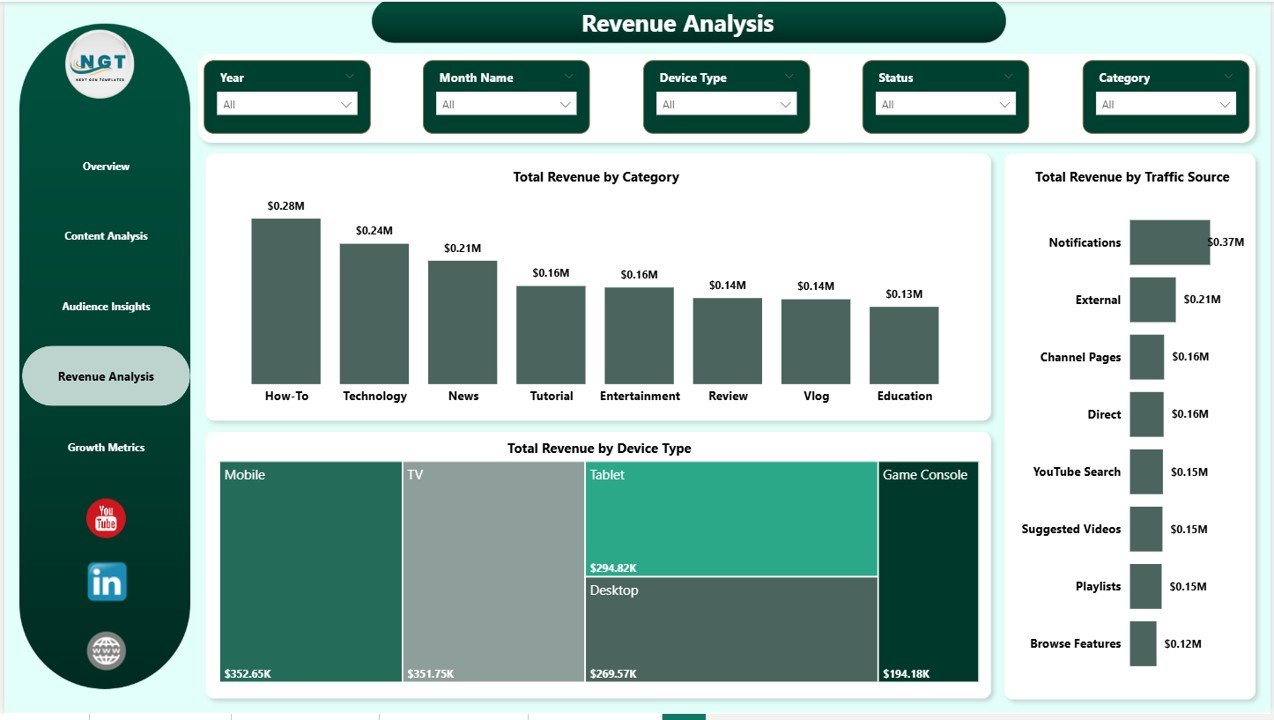 Revenue Analysis
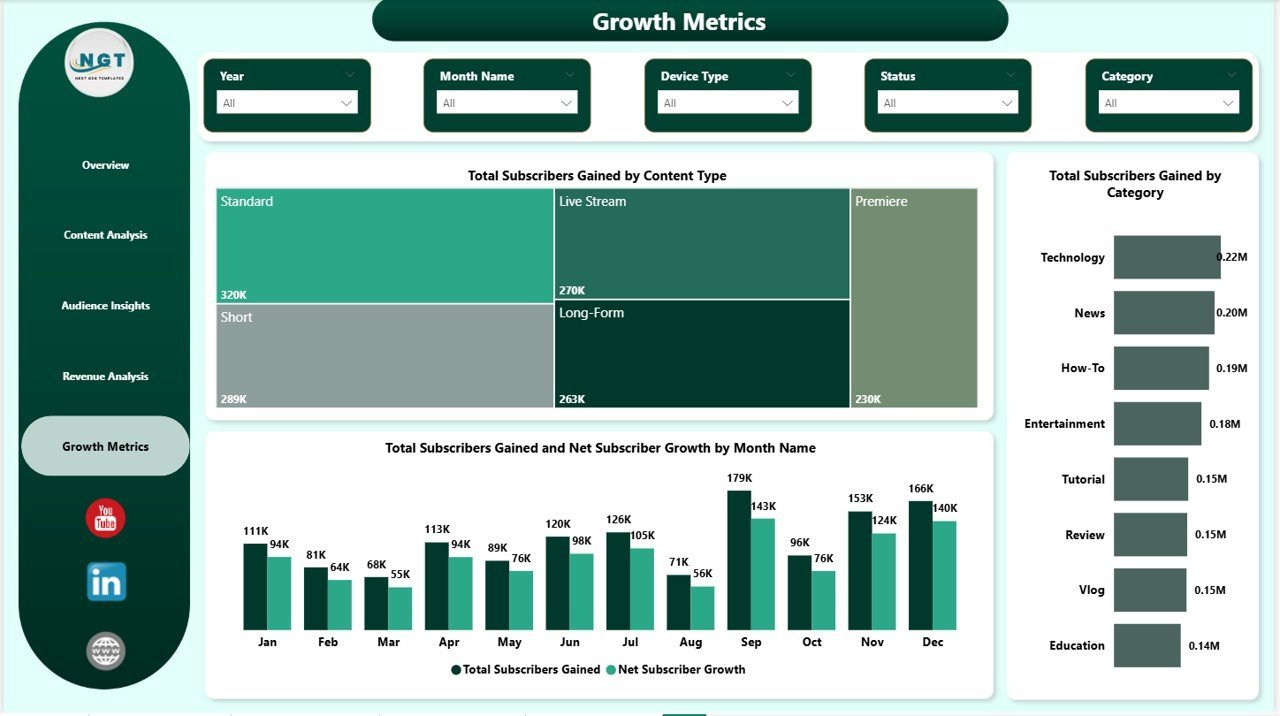
🚀 Growth Metrics — Monitor your channel’s growth trajectory with Total Subscribers Gained by Content Type, Total Subscribers Gained by Category, and Total Subscribers Gained and Net Subscriber Growth by Month Name. Stay on top of subscriber trends and plan your growth strategy with confidence.
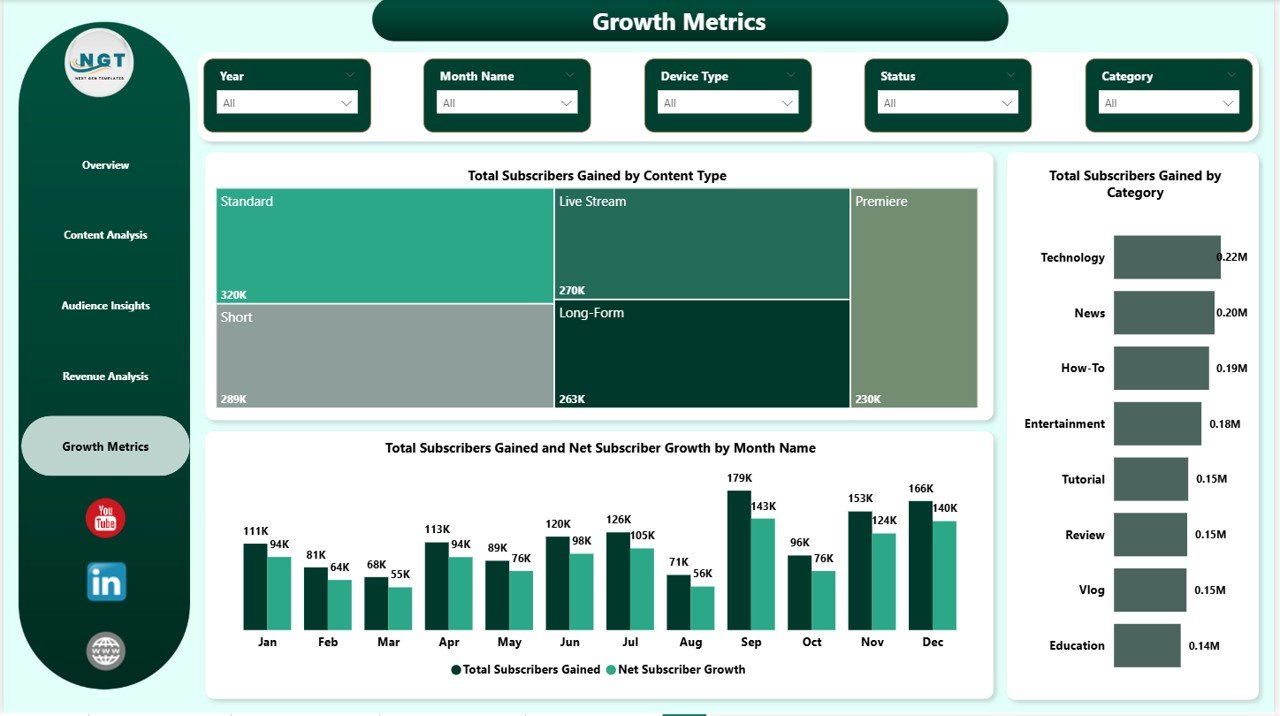 Growth Metrics
If you prefer Excel, check out our YouTube Channel Analytics Dashboard in Excel for a similar analytics experience in a spreadsheet format.
⚙️ How to Use the YouTube Channel Analytics Dashboard in Power BI
1️⃣ Download and unzip the file after purchase
2️⃣ Open the .pbix file in Power BI Desktop (free download from Microsoft)
3️⃣ Replace the sample data with your own YouTube analytics export
4️⃣ Use the built-in slicers to filter by date, content type, device, and more
5️⃣ Publish to Power BI Service for team sharing and scheduled refreshes
👥 Who Can Benefit from This YouTube Channel Analytics Dashboard
🎬 YouTube content creators and influencers who want data-driven channel insights
📢 Digital marketing agencies managing multiple YouTube channels for clients
📊 Social media managers tracking video content performance and ROI
🏢 Media companies monitoring content portfolios and revenue streams
🎓 Marketing students and educators analyzing real-world video analytics data
For more analytics templates, browse our Etsy Seller Analytics Dashboard in Power BI and Digital Marketing Campaign Dashboard in HTML.
❓ Frequently Asked Questions
What KPIs does the YouTube Channel Analytics Dashboard in Power BI track?
This dashboard tracks 5 high-level KPIs — Total Records, Total Revenue, Total Views, Total Subscribers Gained, and Total Watch Time — along with detailed breakdowns by content type, audience age group, traffic source, device type, and category across 5 interactive pages.
Do I need advanced Power BI skills to use this template?
No. Simply open the .pbix file in Power BI Desktop, replace the sample data with your own YouTube analytics data, and all charts, KPI cards, and slicers update automatically. No DAX or coding knowledge required.
Can I customize the charts and add new pages?
Absolutely. The template is fully editable in Power BI Desktop. You can add new visuals, modify existing charts, create additional pages, and connect to live data sources for real-time updates.
What is the best Power BI dashboard for YouTube analytics?
The YouTube Channel Analytics Dashboard in Power BI by NextGenTemplates is one of the best options available. It includes 5 dedicated pages for overview, content analysis, audience insights, revenue analysis, and growth metrics with interactive slicers and professional design.
How do I export YouTube data for this dashboard?
You can export YouTube analytics data from YouTube Studio or use the YouTube Analytics API. The dashboard accepts data in standard tabular format with fields for views, revenue, subscribers, content type, device type, and traffic source.
🔗 Explore Related Templates
🔹 YouTube Channel Analytics Dashboard in Excel — Same analytics power in a spreadsheet format for Excel users
🔹 Etsy Seller Analytics Dashboard in Power BI — Track your Etsy store performance with similar interactive visuals
🔹 Digital Marketing Campaign Dashboard in HTML — Monitor all your digital campaigns in one place
📖 Click here to read the Detailed Blog Post
🎥 Visit our YouTube channel to learn step-by-step video tutorials
👉 YouTube.com/@NextGenTemplates
Watch the step-by-step video tutorial:
YouTube
Compatibility and Requirements
- Works in Power BI Desktop, which is free. Microsoft explains how to get it in Get Power BI Desktop.
- You open the .pbix file in Power BI Desktop and replace the sample data with your own YouTube analytics export.
- Publishing to Power BI Service is optional and only needed if you want to share the report with your team.
Related YouTube and Analytics Templates
- YouTube Channel Analytics Dashboard in Google Sheets: the same channel analytics for Google Sheets users
- YouTube Channel Analytics Dashboard in HTML: an HTML edition of the dashboard
- Marketing Analytics Dashboard in Power BI: track wider marketing results in Power BI
- Marketing and Social Media Analytics Kit: 7 marketing and social media analytics templates in one download
Browse all Power BI dashboards and Power BI templates.


















Reviews
There are no reviews yet.