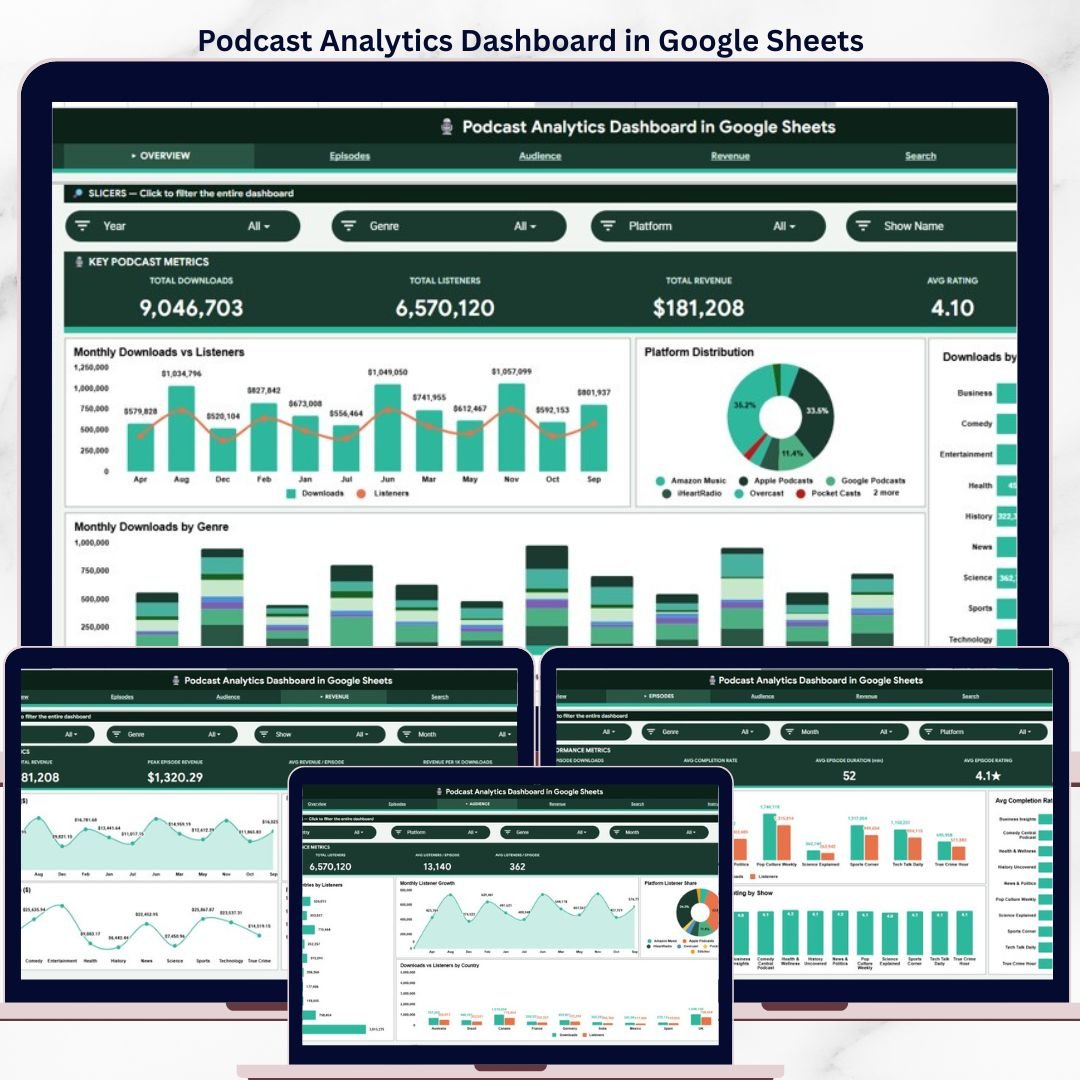
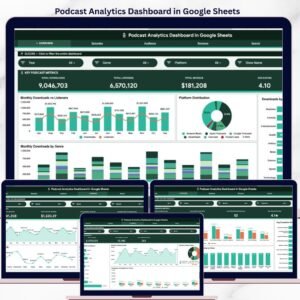
The Podcast Analytics Dashboard in Google Sheets tracks 4 headline KPIs across 6 interactive sheets — covering downloads, listeners, revenue, and ratings across every episode, show, genre, platform, and country. Thirteen pre-built charts and multiple slicers give you a complete view of your podcast performance in under 10 minutes of setup.
🌍 Join 8,400+ teams in 40+ countries using NextGenTemplates to replace paid SaaS tools with one-time-purchase Excel, Google Sheets, Power BI, and HTML templates.
✅ Instant download · One-time payment · No subscription · No per-user fees · Lifetime access
🔑 Key Features of Podcast Analytics Dashboard in Google Sheets
The Podcast Analytics Dashboard in Google Sheets is built around 6 purpose-specific sheet tabs — Overview, Episodes Analysis, Audience Analysis, Revenue Analysis, Search, and Data — each designed to answer a different set of podcast business questions without cluttering a single view.
The Overview page shows 4 headline KPIs (Total Downloads, Total Listeners, Total Revenue, Avg Rating) with 4 charts covering Monthly Downloads vs Listeners, Platform Distribution, Downloads by Genre, and Monthly Downloads by Genre. Multiple slicers let you filter the entire dashboard by platform, genre, or month instantly without touching any formula.
This dashboard tracks 13 distinct analyses across 4 analytical pages — including Revenue per 1K Downloads (the metric sponsorship networks benchmark against), Avg Completion Rate by Show, Top Countries by Listeners, and Monthly Revenue by platform. It is the only $9.99 Google Sheets tool that consolidates episode-level, audience, and monetization data in one shareable file you can send to sponsors over a Google Drive link.
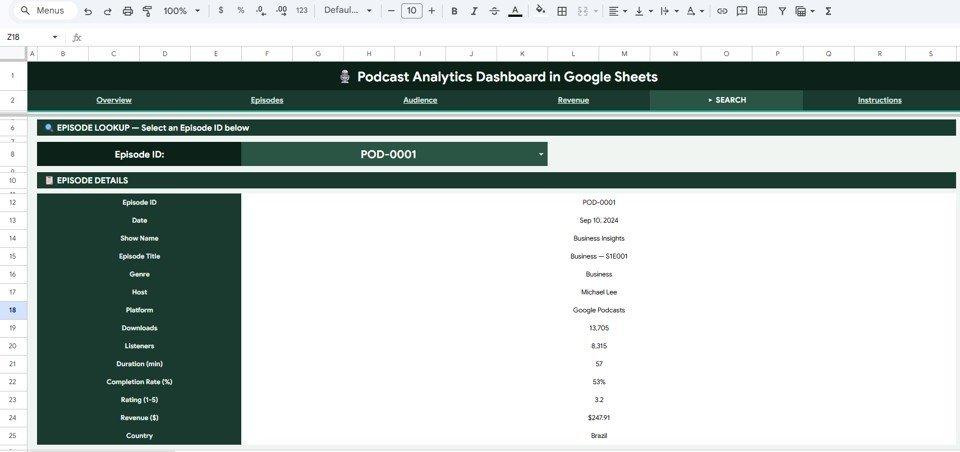
The Episode Lookup tool in the Search sheet lets you select any Episode ID from a dropdown and instantly see all 14 fields — date, show name, title, genre, host, platform, downloads, listeners, duration, completion rate, rating, revenue, and country — without scrolling the raw dataset.
📦 What’s Inside the Podcast Analytics Dashboard in Google Sheets
🎙️ Overview Page – 4 KPI cards (Total Downloads, Total Listeners, Total Revenue, Avg Rating) + 4 charts with slicers for platform, genre, and month filtering
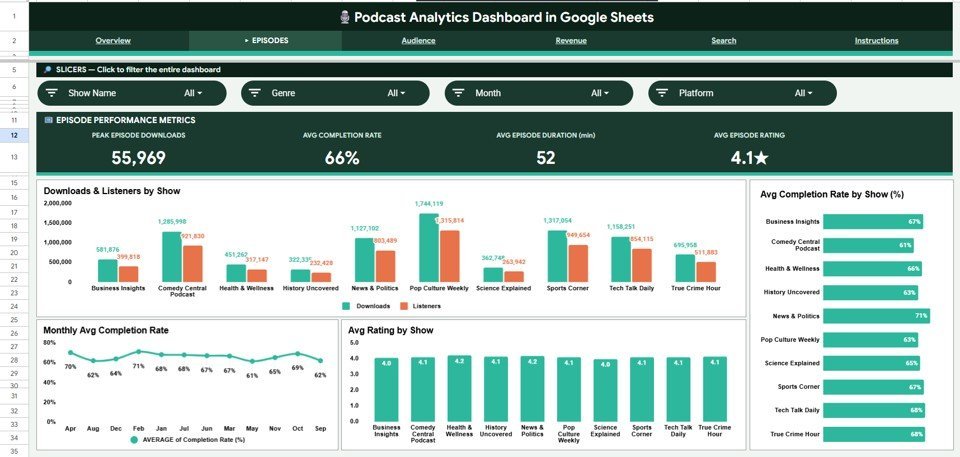
📊 Episodes Analysis – 8 analysis views: Peak Episode Downloads, Avg Completion Rate, Avg Episode Duration (min), Avg Episode Rating, Downloads & Listeners by Show, Avg Completion Rate by Show (%), Monthly Avg Completion Rate, and Avg Rating by Show
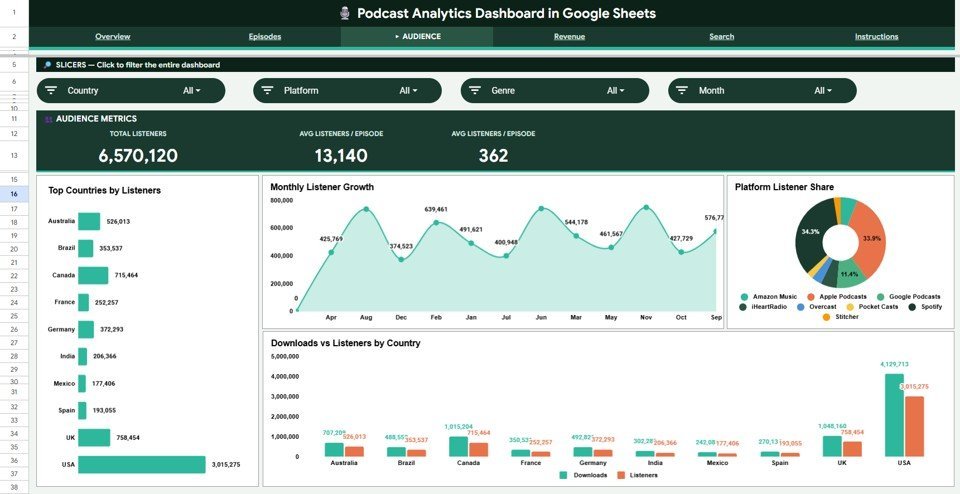
🌍 Audience Analysis – 6 views: Total Listeners, Avg Listeners/Episode, Top Countries by Listeners, Monthly Listener Growth, Platform Listener Share, and Downloads vs Listeners by Country
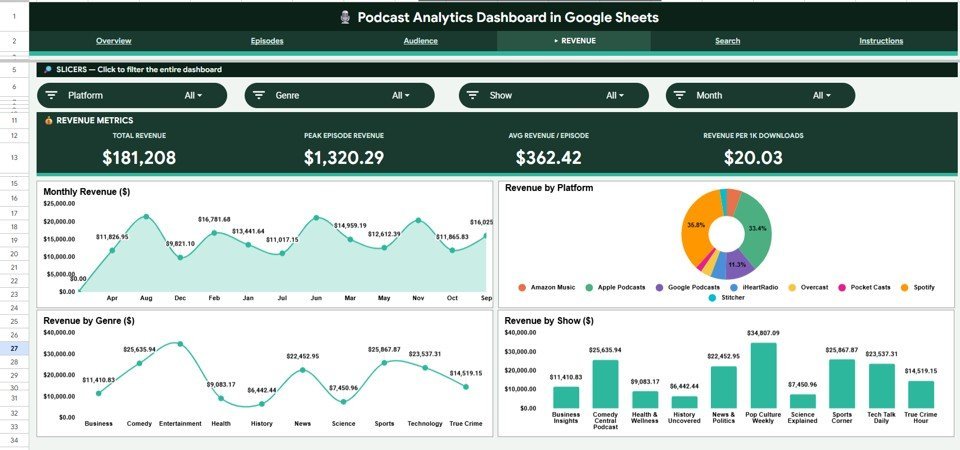
💰 Revenue Analysis – 8 views: Total Revenue, Peak Episode Revenue, Avg Revenue/Episode, Revenue per 1K Downloads, Monthly Revenue ($), Revenue by Platform, Revenue by Genre ($), Revenue by Show ($)
🔍 Search Sheet – Episode ID dropdown lookup showing all 14 episode fields instantly
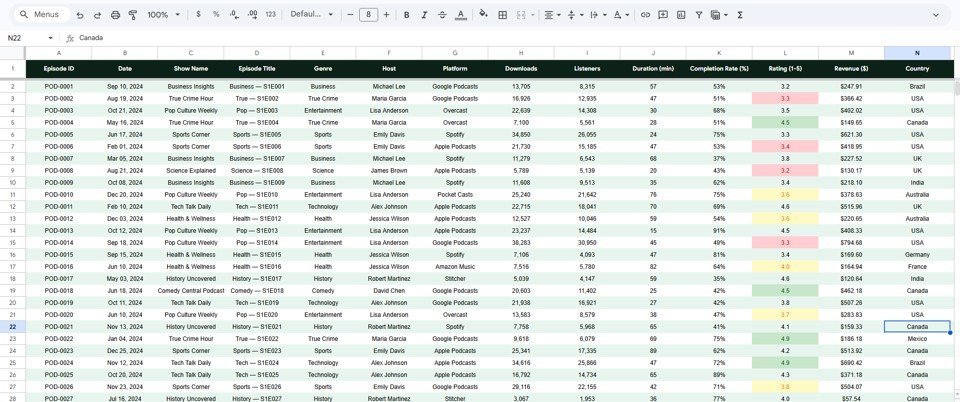
📋 Data Sheet – Structured input sheet; paste your episode data here and all 4 analysis pages update automatically
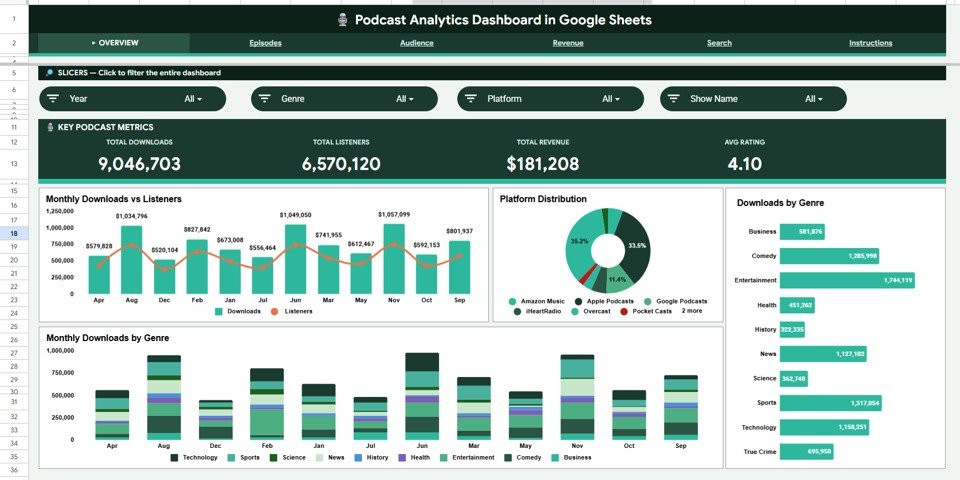
Overview Page — 4 KPIs, 4 Charts, Multi-Slicer Filtering
📊 Podcast Analytics Dashboard in Google Sheets vs. Excel Dashboard vs. Chartable / Buzzsprout — Where This Fits
| Feature | Podcast Analytics Dashboard (Google Sheets) | Excel Dashboard | Chartable / Buzzsprout |
|---|---|---|---|
| Cost | $9.99 one-time | $9.99–$17.99 one-time | $20–$200 / month |
| Platform | Google Sheets (browser) | Microsoft Excel (desktop) | Proprietary cloud SaaS |
| Setup time | Under 10 minutes | Under 10 minutes | 1–3 hours onboarding |
| Real-time collaboration | Built-in (share link) | Via OneDrive only | Limited (seat-based) |
| Mobile access | Google Sheets app | Excel mobile (limited) | Yes |
| Episode-level lookup tool | ✅ Dropdown search sheet | ✅ Search sheet | Limited |
| Revenue analytics | ✅ 8 revenue views | ✅ Revenue charts | Limited (no custom revenue) |
| Year-1 cost at 5 users | $9.99 total | $9.99–$17.99 total | $240–$2,400 |
| Data ownership | 100% in Google Drive | 100% local file | Vendor-hosted |
For podcasters and agencies that want multi-show, multi-platform analytics without paying $20–$200 per month in SaaS fees, the Podcast Analytics Dashboard in Google Sheets sits in the sweet spot.
👥 Who This Template Is For — and Who It’s Not For
✅ This template is built for:
- Independent podcasters with 1–10 shows tracking downloads, listeners, and ratings across Spotify, Apple Podcasts, and YouTube
- Podcast agencies and production teams managing multiple shows and presenting performance data to clients or sponsors
- Content marketers using podcasts as a B2B channel who need Revenue per 1K Downloads and geographic audience data for sponsor decks
- Google Sheets users who want a shareable, browser-based Google Sheets dashboard without installing Excel
❌ This template is NOT for:
- Enterprise podcast networks needing live API connections to Spotify or Apple Podcasts for automatic data pull
- Teams with zero data — this template requires manual data entry from platform exports
- Analysts who need raw SQL or Tableau-level custom visualization flexibility
⚙️ How to Use the Podcast Analytics Dashboard in Google Sheets
- Download and open: After purchase, open the PDF guide to find the Google Sheets copy link. Click it to create your own editable copy in Google Drive.
- Enter your data: Paste episode data into the Data sheet — Episode ID, Date, Show Name, Title, Genre, Host, Platform, Downloads, Listeners, Duration, Completion Rate, Rating, Revenue, Country.
- View the Overview: Navigate to the Overview page to see your 4 KPI cards and 4 charts update automatically.
- Filter with slicers: Use platform, genre, or month slicers to instantly filter every chart across all analysis pages.
- Analyze episodes & revenue: Use Episodes Analysis, Audience Analysis, and Revenue Analysis tabs for deep-dive breakdowns by show, genre, and platform.
- Look up any episode: Use the Search sheet dropdown to pull all 14 details for any individual Episode ID in seconds.
💼 Real-World Use Cases
James runs a weekly business podcast with 12,000 listeners per episode. He uses the Revenue Analysis page to present Revenue per 1K Downloads to ad agencies — the exact sponsorship benchmark — and closed a $5,000/month deal by sharing the Google Sheets dashboard link directly without exporting any files.
Priya manages 4 shows for a podcast production agency in Bangalore. She uses the Episodes Analysis page to identify which show has the highest Avg Completion Rate by Show and which hosts drive the most downloads, then builds monthly client reports from the Audience Analysis page without a single CSV export.
Carlos is a solo true crime podcaster tracking audience growth across Spotify and Apple Podcasts. The Audience Analysis page’s Top Countries by Listeners chart revealed that 38% of his audience was in the UK — which completely changed his approach to pitching UK-based advertisers.
❓ Frequently Asked Questions
What KPIs does the Podcast Analytics Dashboard in Google Sheets track?
The Podcast Analytics Dashboard in Google Sheets tracks 4 headline KPIs — Total Downloads, Total Listeners, Total Revenue, and Avg Rating — across 6 sheets and 13 analyses covering episodes, audience geography, platform distribution, genre performance, completion rates, and monetization breakdowns. All metrics update automatically when you update the Data sheet.
How long does setup take?
Setup takes under 10 minutes. Open the Google Sheets copy link from the PDF download guide, make your copy in Google Drive, paste episode data into the Data sheet, and every chart and KPI card across all 6 pages updates automatically without any formula edits or configuration.
Can I track multiple podcast shows in one dashboard?
Yes. The Data sheet includes a Show Name column. All analysis pages — including Downloads & Listeners by Show, Avg Completion Rate by Show, Avg Rating by Show, and Revenue by Show — break down metrics per show automatically. Use slicers to filter any single show in isolation.
How does this compare to Chartable or Buzzsprout Analytics?
Chartable and Buzzsprout charge $20–$200 per month and only track data within their own platform. The Podcast Analytics Dashboard in Google Sheets costs $9.99 one-time, works across any platform (Spotify, Apple, YouTube, Amazon Music), includes full revenue analytics, and stores all your data 100% in Google Drive.
Does this work on mobile?
Yes. The Podcast Analytics Dashboard in Google Sheets opens in the Google Sheets mobile app on iOS and Android. Charts and KPI cards display correctly in read-only mode, while data entry works on both phone and tablet via the Google Sheets app.
Can I share this dashboard with sponsors or ad agencies?
Yes. Share the Google Sheets link as Viewer with any sponsor or agency. They can browse all analytics without editing your data. The dashboard is specifically designed to surface the metrics sponsors ask for — downloads, listeners, completion rates, top countries, and Revenue per 1K Downloads.
What podcast platforms can I track?
Any platform. The Platform column in the Data sheet accepts any text — Spotify, Apple Podcasts, YouTube, Amazon Music, Google Podcasts, Pocket Casts, iHeart, or custom entries. All charts and slicers update automatically when new platform entries are added.
👤 About the Author
Built by PK — Microsoft Certified Professional with 15+ years of Excel, Google Sheets, and Power BI experience. Founder of NextGenTemplates, reaching 300K+ subscribers across YouTube channels (@PK-AnExcelExpert, @NextGenTemplates, @NeoTechNavigators). Every template is hand-built and tested before release.
🔗 Explore Related Templates
Podcast Analytics Dashboard in Excel — same 6-page analytics in an Excel workbook for teams on Microsoft Office.
Podcast Analytics Dashboard in Power BI — DAX-powered podcast analytics with advanced drill-through for networks and agencies.
Content Creator Revenue Dashboard in Google Sheets — multi-platform revenue tracker for YouTubers, podcasters, and bloggers.
YouTube Channel Analytics Dashboard in Google Sheets — YouTube-focused analytics covering views, subscribers, and revenue by content type.
📖 Click here to read the Detailed Blog Post
Watch the step-by-step video tutorial:
🎥 Visit our YouTube channel for step-by-step video tutorials
👉 YouTube.com/@NextGenTemplates
📅 Last updated: May 2026


Reviews
There are no reviews yet.