

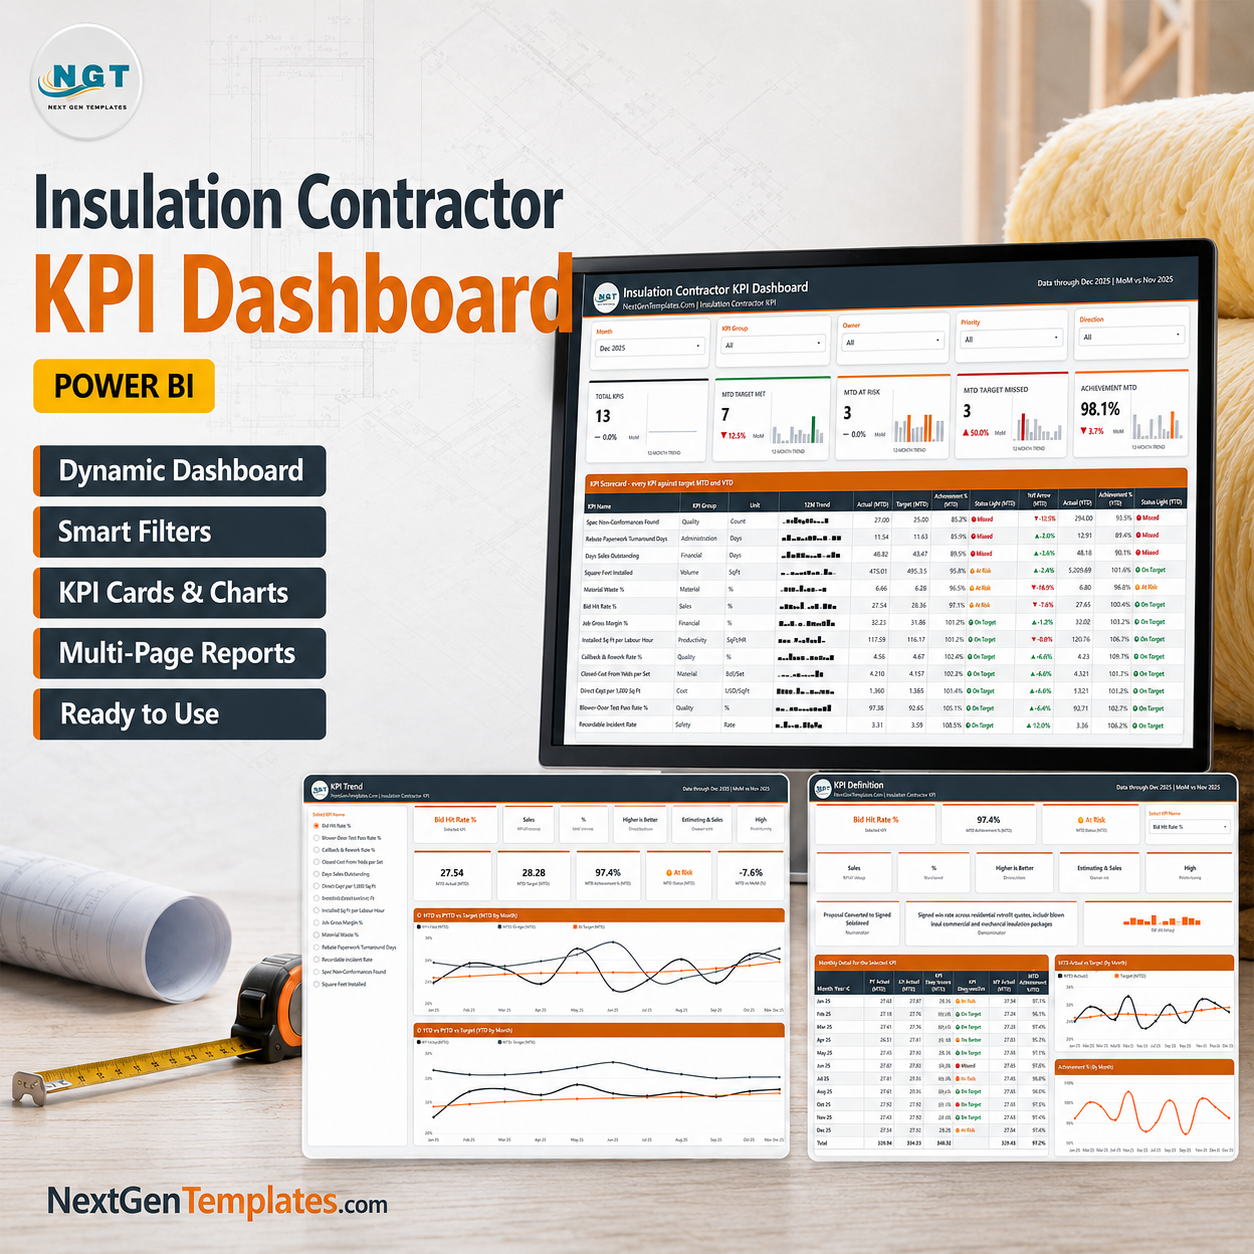

The Insulation Contractor KPI Dashboard in Power BI scores 13 insulation KPIs against target every month, on four report pages, from a single Excel workbook you control. Installed Sq Ft per Labour Hour, Closed-Cell Foam Yield per Set, Material Waste %, Blower-Door Test Pass Rate %, Callback & Rework Rate %, Job Gross Margin %, Bid Hit Rate % and Days Sales Outstanding all land on one scorecard with MTD and YTD traffic lights side by side. It ships as a fully editable .pbix built with native Power BI visuals only, with a complete sample year already loaded – 13 KPI definitions, 156 monthly target rows and 312 actual rows covering the reporting year and the year before it. One-time payment, instant download, lifetime access to the file, and nothing to install beyond the free Power BI Desktop. Insulation Contractor KPI Dashboard in Power BI
Instant download – one-time payment – no subscription – no per-user fees – lifetime access to the file.
Key Features of the Insulation Contractor KPI Dashboard in Power BI
- 13 insulation KPIs in nine groups – Productivity, Material, Quality, Administration, Financial, Sales, Cost, Safety and Volume – each with its own owner and priority.
- Five synced slicers across the report: Month, KPI Group, Owner, Priority and Direction.
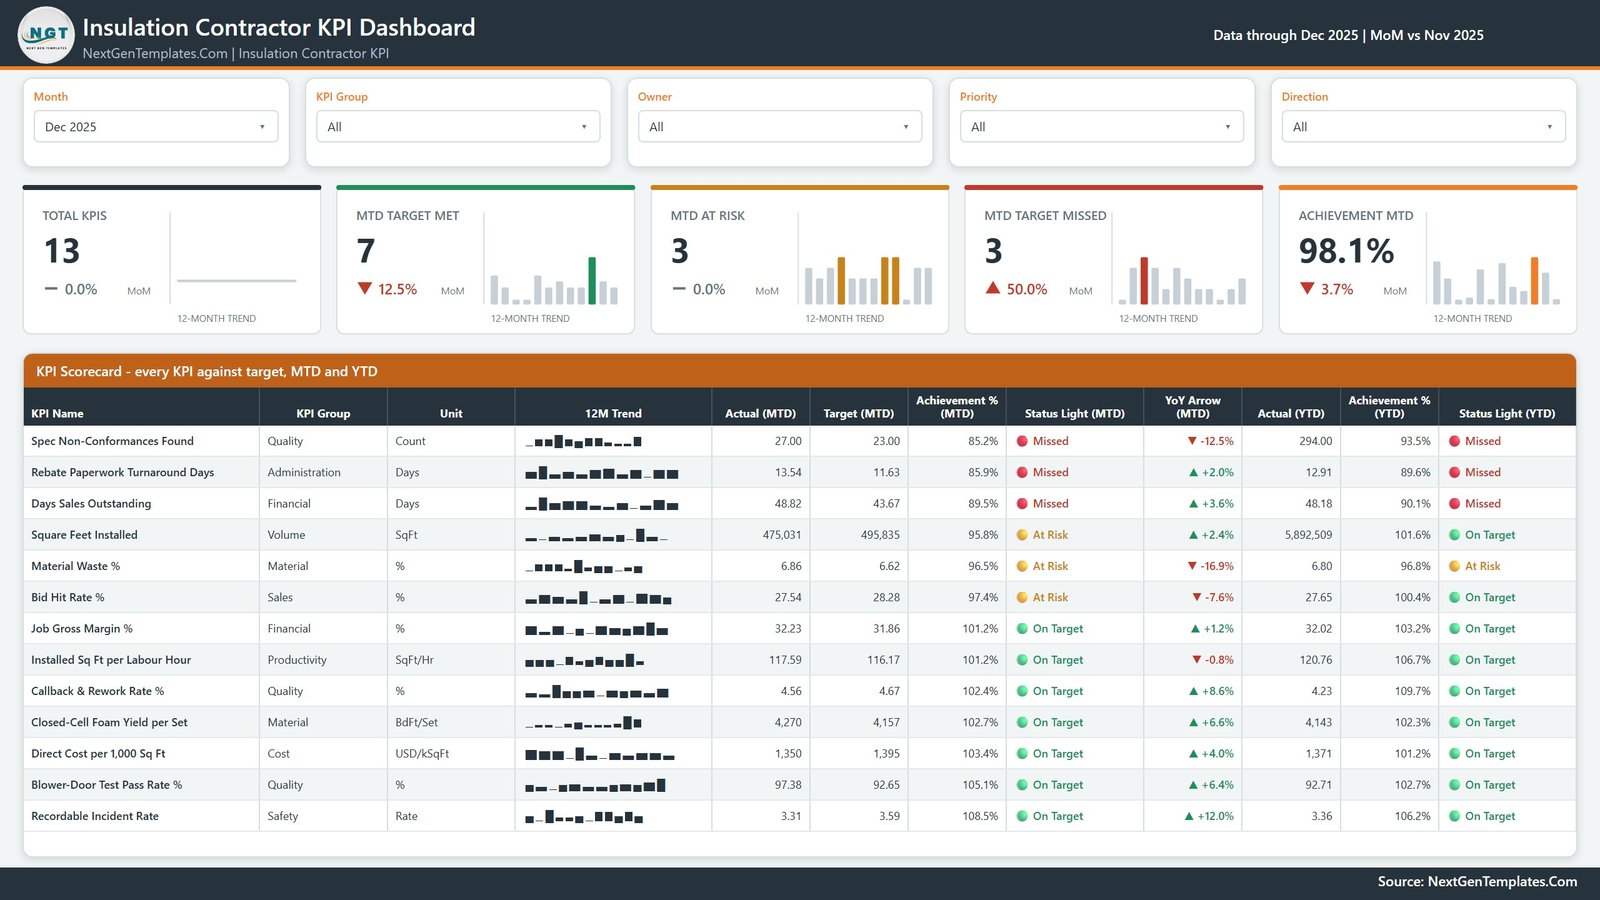
- MTD and YTD on the same row – actual, target, achievement percentage and status light for both periods, so a good month inside a weak year has nowhere to hide.
- Direction-aware scoring – 6 KPIs are higher-is-better and 7 are lower-is-better, so Material Waste %, Callback & Rework Rate %, Spec Non-Conformances Found, Rebate Paperwork Turnaround Days, Direct Cost per 1,000 Sq Ft, Days Sales Outstanding and Recordable Incident Rate score Target divided by Actual and read above 100 percent when they beat target.
- Five summary cards – Total KPIs, MTD Target Met, MTD At Risk, MTD Target Missed and Achievement MTD, each with a month-on-month delta and a 12-month trend bar.
- A 12-month sparkline on every KPI row that keeps the full year even when the report is filtered to one month.
- Prior-year comparison built in – YoY arrows on the scorecard plus CY vs PY vs Target line charts, MTD and YTD.
- Owners that mean something on an insulation job – Field Operations, Spray Foam Division, Warehouse & Logistics, Energy Services, Quality Assurance, Service & Warranty, Rebate Administration, Estimating & Sales, Job Costing, Finance and Safety & Compliance.
- Fully editable .pbix – native visuals only, no custom visuals, nothing locked and no paid workspace required.
What Is Inside the Insulation Contractor KPI Dashboard in Power BI
Page 1 – KPI Dashboard
The month picker sits top left, followed by KPI Group, Owner, Priority and Direction. Under them the five summary cards, then the KPI Scorecard table: KPI Name, KPI Group, Unit, 12M Trend, Actual (MTD), Target (MTD), Achievement % (MTD), Status Light (MTD), YoY Arrow (MTD), Actual (YTD), Achievement % (YTD) and Status Light (YTD). In the shipped December 2025 view, 7 KPIs are On Target, 3 At Risk and 3 Missed, with overall MTD achievement at 98.1 percent.
Page 2 – KPI Trend
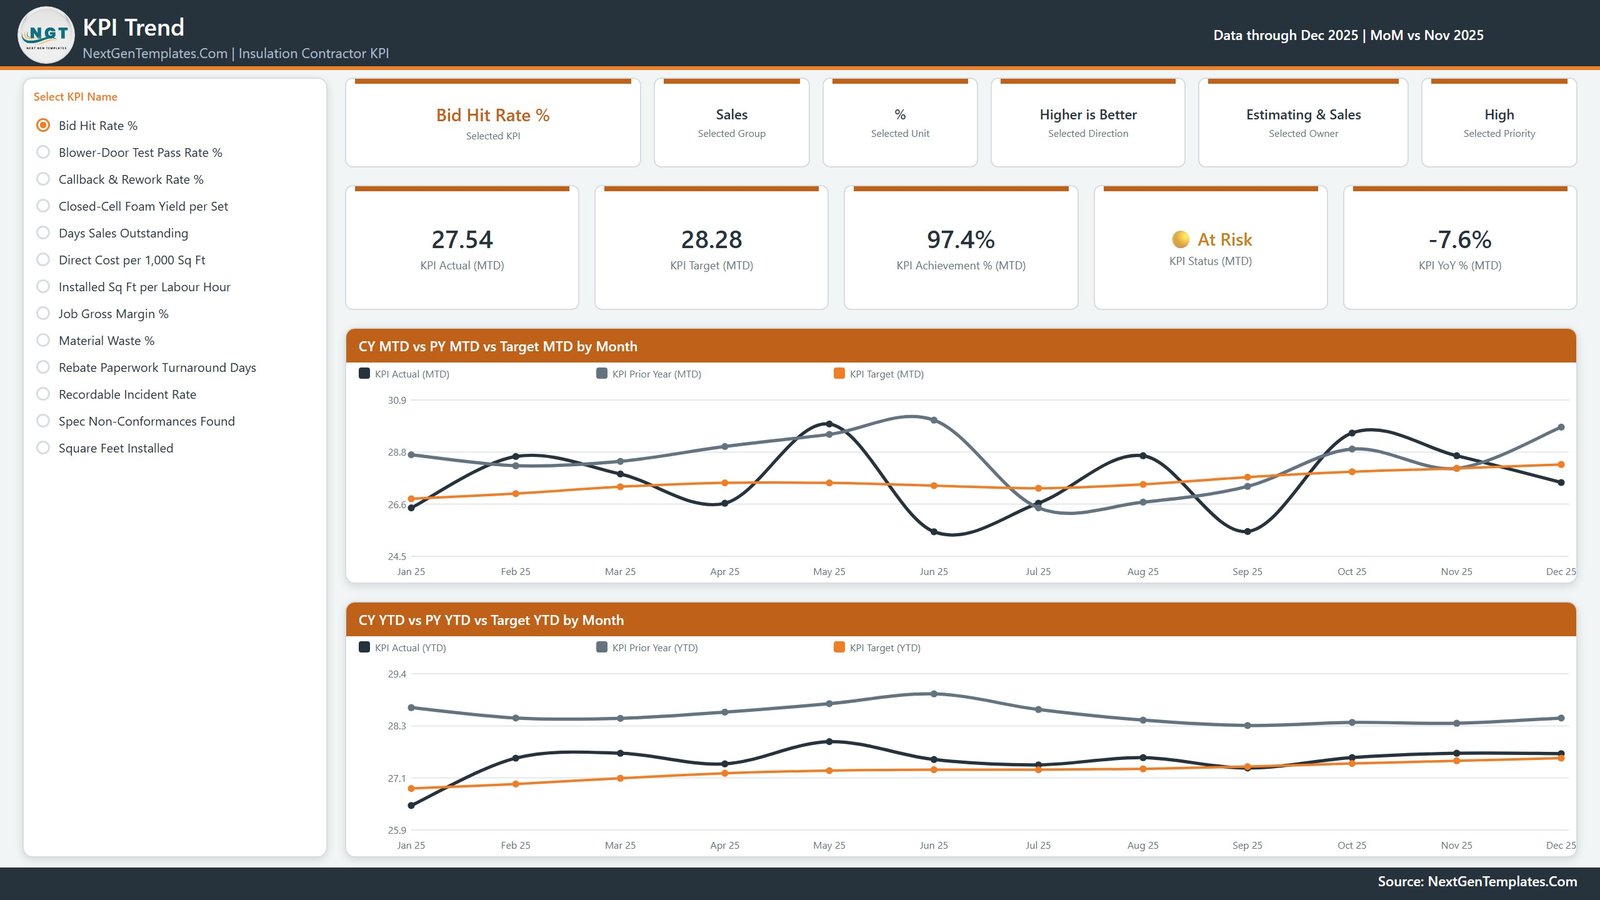
Pick one KPI from the list on the left and the whole page follows it. An attribute strip repeats the selected group, unit, direction, owner and priority, then five cards give KPI Actual (MTD), KPI Target (MTD), KPI Achievement % (MTD), KPI Status (MTD) and KPI YoY % (MTD). Below sit two charts: CY MTD vs PY MTD vs Target MTD by Month and CY YTD vs PY YTD vs Target YTD by Month.
Page 3 – KPI Definition
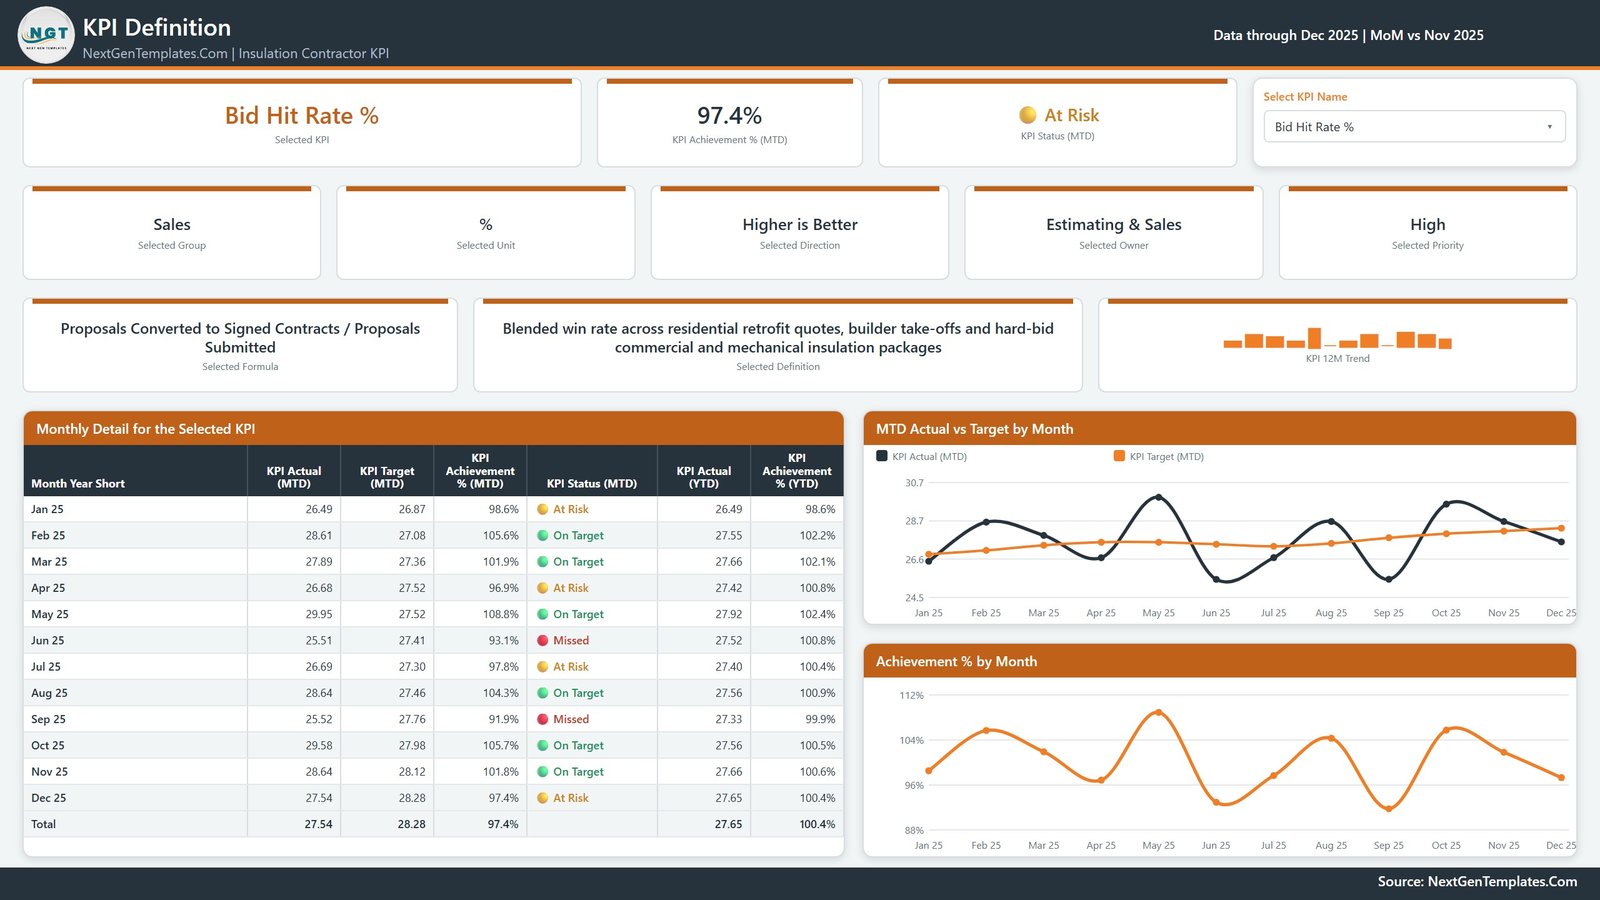
The same synced KPI picker, plus the plain-English definition and the formula behind the number – for Bid Hit Rate % that is Proposals Converted to Signed Contracts divided by Proposals Submitted, defined as the blended win rate across residential retrofit quotes, builder take-offs and hard-bid commercial and mechanical insulation packages. A Monthly Detail table lists all twelve months with MTD actual, MTD target, achievement, status and the YTD pair, and two charts show MTD Actual vs Target by Month and Achievement % by Month.
Page 4 – Get More Templates
A catalogue page plus a short guide to changing the month, swapping in your own data through the three sheets in Data.xlsx, and recolouring the whole report from the one custom theme.
Insulation Contractor KPI Dashboard in Power BI vs. Excel vs. Paid Construction Software – Where This Fits
| This Power BI template | Excel KPI dashboard | Procore / Buildertrend reporting | |
|---|---|---|---|
| Cost | One-time 19.99 USD | One-time 19.99 USD | Roughly 300-700 USD per month |
| Platform | Power BI Desktop, free from Microsoft | Microsoft Excel 2013 or later | Vendor cloud only |
| Setup time | About 20 minutes to swap the sample year | About 20 minutes | Weeks of onboarding and data migration |
| Real-time team collaboration | Only if you publish to a Power BI workspace | Through OneDrive or SharePoint | Yes, built in |
| Mobile access | Power BI mobile app after publishing | Excel mobile | Yes |
| Customisable KPIs | Add, rename or delete any KPI in the workbook | Same, via the definition sheet | Fixed vendor report set |
| Share with a link | Yes, once published | File share | Yes |
| Year-1 cost at 5 users | 19.99 USD | 19.99 USD | 3,600 USD and up |
| Connects to your job-costing system | No – you type or paste the monthly numbers | No | Yes, it is the job-costing system |
| You keep the historical file | Yes, forever | Yes | No, it stays in the vendor account |
For an insulation contractor who wants a management scorecard without a per-seat construction platform, the Insulation Contractor KPI Dashboard in Power BI sits in the sweet spot.
Who This Template Is For – and Who It Is Not For
This template is built for:
- Residential and commercial insulation contractors running roughly 2 to 20 crews across batt, blown-in, dense-pack and spray-foam scopes.
- Operations managers who already pull monthly numbers out of a job-costing or estimating system and want one board to review them on.
- Owners and controllers who want a management-level scorecard – margin, DSO, waste, callbacks and safety on one page – rather than another production screen.
- Weatherisation and energy-services teams tracking blower-door pass rates and utility rebate paperwork turnaround.
This template is NOT for:
- Anyone expecting a live feed. It does not connect to Procore, Buildertrend, JobNimbus or an accounting package – every figure is one you enter in the included Excel workbook.
- Crew scheduling, take-offs or line-item job costing – this is a monthly KPI scorecard, not a production system.
- Anyone who does not want to install Power BI Desktop. The Insulation Contractor KPI Dashboard in Excel is the same scorecard as worksheet formulas.
How to Use the Insulation Contractor KPI Dashboard in Power BI
- Unzip the download and keep the .pbix and Data.xlsx in the same folder.
- Open the .pbix in Power BI Desktop and look through the sample December 2025 year first.
- Open Data.xlsx. Edit KPI Definition to rename, add or delete KPIs – the KPI name is the join key, so change it in all three sheets.
- Fill Input_ Target with one row per KPI per month, and Input_ Actual with the same for the reporting year and the year before it.
- Set Type to UTB for higher-is-better KPIs and LTB for lower-is-better ones. Owner and Priority are free text and drive two of the slicers.
- Back in Power BI Desktop, click Home then Refresh. The cards, the scorecard, the KPI list and every chart follow the new rows.
Real-World Use Cases
Ray, operations manager, six crews across attic and spray foam. He opens Page 1 on the first Monday of the month. Spec Non-Conformances Found at 85.2 percent of target and Callback & Rework Rate % holding On Target tell him where the review meeting starts, and the YoY arrows tell him whether it is a trend or one bad month.
Denise, rebate administrator. She filters the Owner slicer to Rebate Administration and watches Rebate Paperwork Turnaround Days on the KPI Trend page – twelve months of actual against target, with last year underneath, so she can show the utility programme manager where the backlog actually built up.
Alan, controller. He filters to the Financial group and reviews Job Gross Margin % and Days Sales Outstanding together. The KPI Definition page carries the formula he agreed with the accountant, so nobody re-argues the calculation each quarter.
Frequently Asked Questions
What KPIs does the Insulation Contractor KPI Dashboard in Power BI track?
The Insulation Contractor KPI Dashboard in Power BI tracks 13 KPIs: Installed Sq Ft per Labour Hour, Closed-Cell Foam Yield per Set, Material Waste %, Blower-Door Test Pass Rate %, Spec Non-Conformances Found, Callback & Rework Rate %, Rebate Paperwork Turnaround Days, Job Gross Margin %, Bid Hit Rate %, Direct Cost per 1,000 Sq Ft, Days Sales Outstanding, Recordable Incident Rate and Square Feet Installed.
Do I need a paid Power BI licence?
No. Power BI Desktop is free from Microsoft and opens the file. A Pro or Premium licence is only needed if you want to publish the report to a workspace and share it with colleagues by link.
Does it connect to Procore, Buildertrend or my accounting system?
No. Every number in the Insulation Contractor KPI Dashboard in Power BI comes from the included Excel workbook, which you fill from whatever system you already run. That is deliberate – the template works no matter which platform your office uses.
Can I add or remove KPIs?
Yes. Nothing in the report hard-codes a KPI. Add a row to KPI Definition plus its monthly target and actual rows, click Refresh, and the counts, scorecard, KPI list and charts pick it up.
How does a lower-is-better KPI score above 100 percent?
Achievement is direction-aware. LTB KPIs score Target divided by Actual, so a material waste percentage below target scores above 100 percent and turns green like every other KPI on the board.
What are the traffic light thresholds?
On Target is 100 percent and above, At Risk is 95 to 100 percent, and Missed is below 95 percent. They are set in the model and can be changed.
How long does setup take?
About 20 minutes. Replace the sample rows in the three sheets of Data.xlsx with your own months, then click Home and Refresh in Power BI Desktop. The included Power BI Dashboard User Manual PDF walks through it.
About the Author
Built by PK – Microsoft Certified Professional with 15+ years of Excel, Google Sheets, and Power BI experience. Founder of NextGenTemplates, reaching 300K+ subscribers across YouTube channels. Every template is hand-built and tested before release.
Explore Related Templates
- Also available as: Insulation Contractor KPI Dashboard in Excel – the same four-page scorecard as worksheet formulas, no Power BI needed.
- Insulation Contractor KPI Scorecard in Excel – a lighter ten-KPI monthly scorecard, a different product from this KPI dashboard.
- Insulation Contractor KPI Scorecard in Google Sheets – the browser-based scorecard edition.
- Roofing Contractor KPI Dashboard in Power BI and HVAC Contractor KPI Dashboard in Power BI – the same board for the other trades on the job.
- Construction KPI Dashboard in Power BI – a wider construction scorecard for the whole company.
- Browse every Power BI KPI Dashboard or the full Power BI catalogue.
Click here to read the detailed blog post
Visit our YouTube channel for step-by-step video tutorials
Last updated: September 2026
Watch the demo video:
Compatibility and Requirements
- Works in Power BI Desktop, which is free from Microsoft. Keep the .pbix and Data.xlsx in the same folder. Microsoft explains the download in Get Power BI Desktop.
- You edit the monthly numbers in the included Excel workbook, Data.xlsx.
Related Insulation Contractor Templates
- Insulation Contractor KPI Dashboard in Google Sheets: the same dashboard in the browser
- HVAC Contractor KPI Dashboard in Excel: a similar scorecard for HVAC crews
- Electrical Contractor KPI Dashboard in Power BI: the Power BI board for electrical trades
- Plumbing Contractor Dashboard in Power BI: a Power BI dashboard for plumbing contractors
Browse all Power BI KPI dashboards.

































Reviews
There are no reviews yet.