

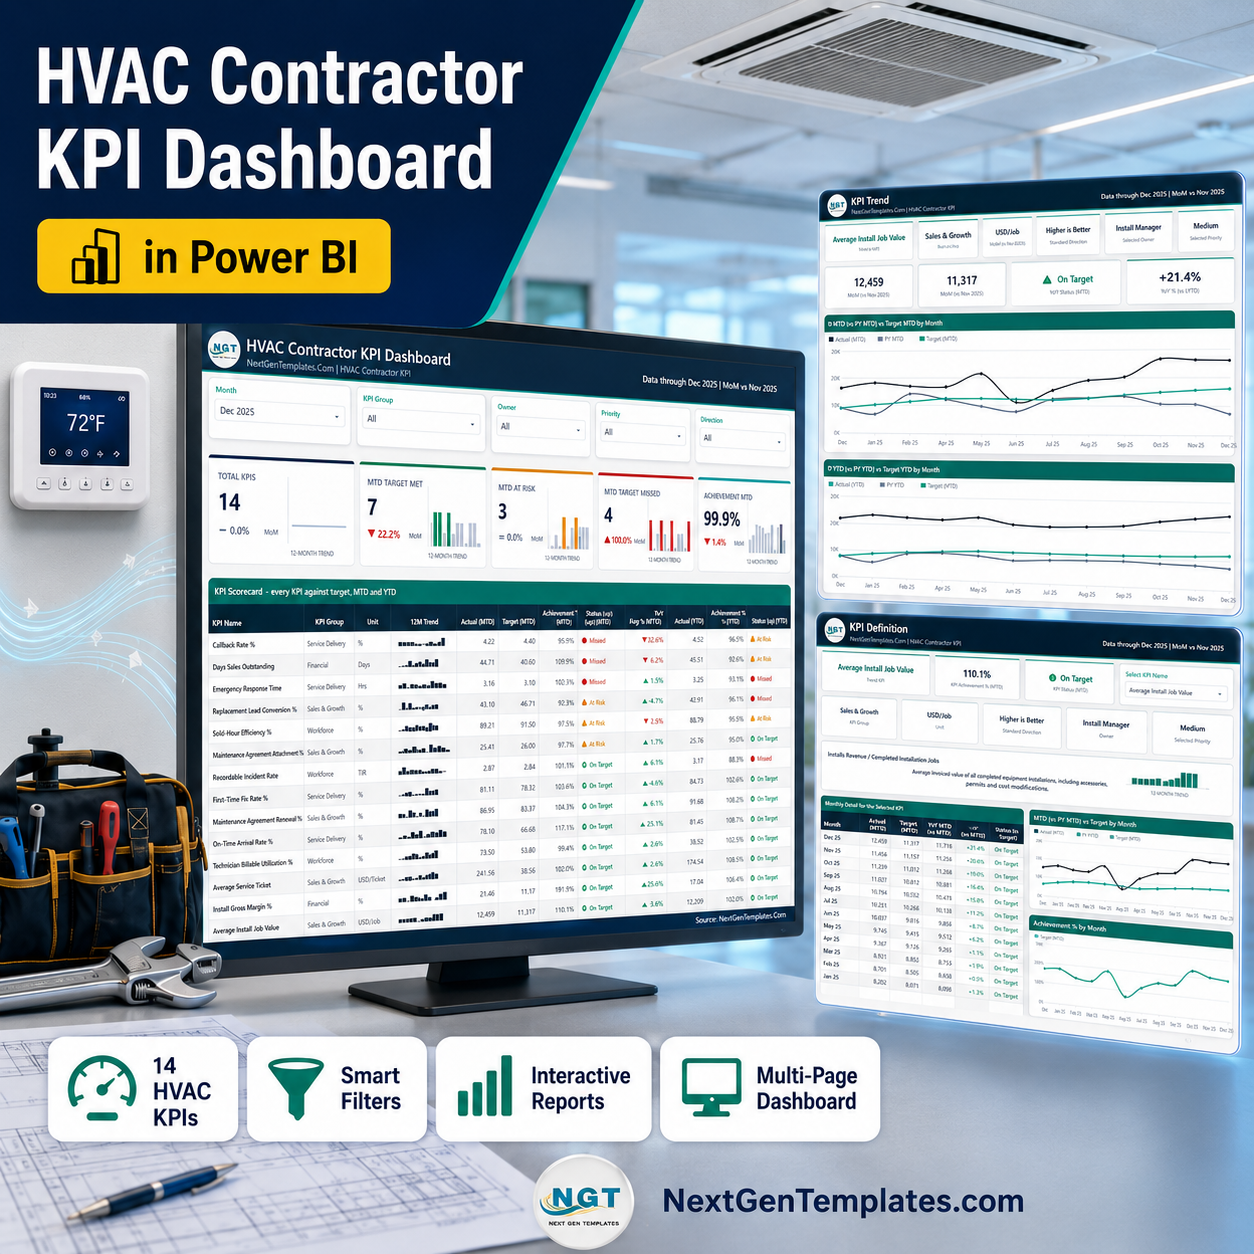

The HVAC Contractor KPI Dashboard in Excel scores 15 heating and cooling KPIs every month, in 7 KPI groups, against a target and against last year – first-time fix rate, emergency response time, callback and warranty rate, replacement close rate, install gross margin, maintenance plan attach and renewal, technician billable utilisation, unapplied labour hours, TRIR, EPA refrigerant log compliance, average repair ticket, days sales outstanding and NPS. Pick a month from one dropdown and the whole scorecard re-reads: MTD and YTD actual, target, achievement percentage, traffic-light status, prior year and year-on-year movement. Every number is a plain worksheet formula – no macros, no Power Query, no data model, no add-in. A full year of sample data is already typed in, so you can see it working before you touch it. Instant download, lifetime access, and it opens in Excel 2013 or later and in Excel for the web. HVAC Contractor KPI Dashboard in Excel
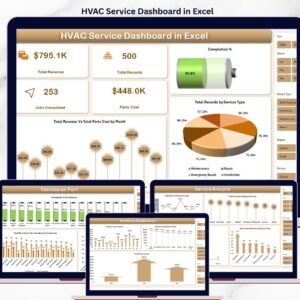
Which template is this? NextGenTemplates publishes three similarly named HVAC products and they are genuinely different builds. This one is the KPI Dashboard: a month-picker scorecard with a 15-row traffic-light grid, a dedicated KPI Trend page and a KPI Analysis page, fed by three typed input sheets. The HVAC Contractor KPI Scorecard in Excel is a card-style scorecard with a comparison-switch dropdown and a single monthly data sheet. The HVAC Service Dashboard in Excel is an analytical dashboard built on a transaction table with slicers and pivot charts. Buy the one that matches how you report, not the one whose name you saw first.
Key Features of the HVAC Contractor KPI Dashboard in Excel
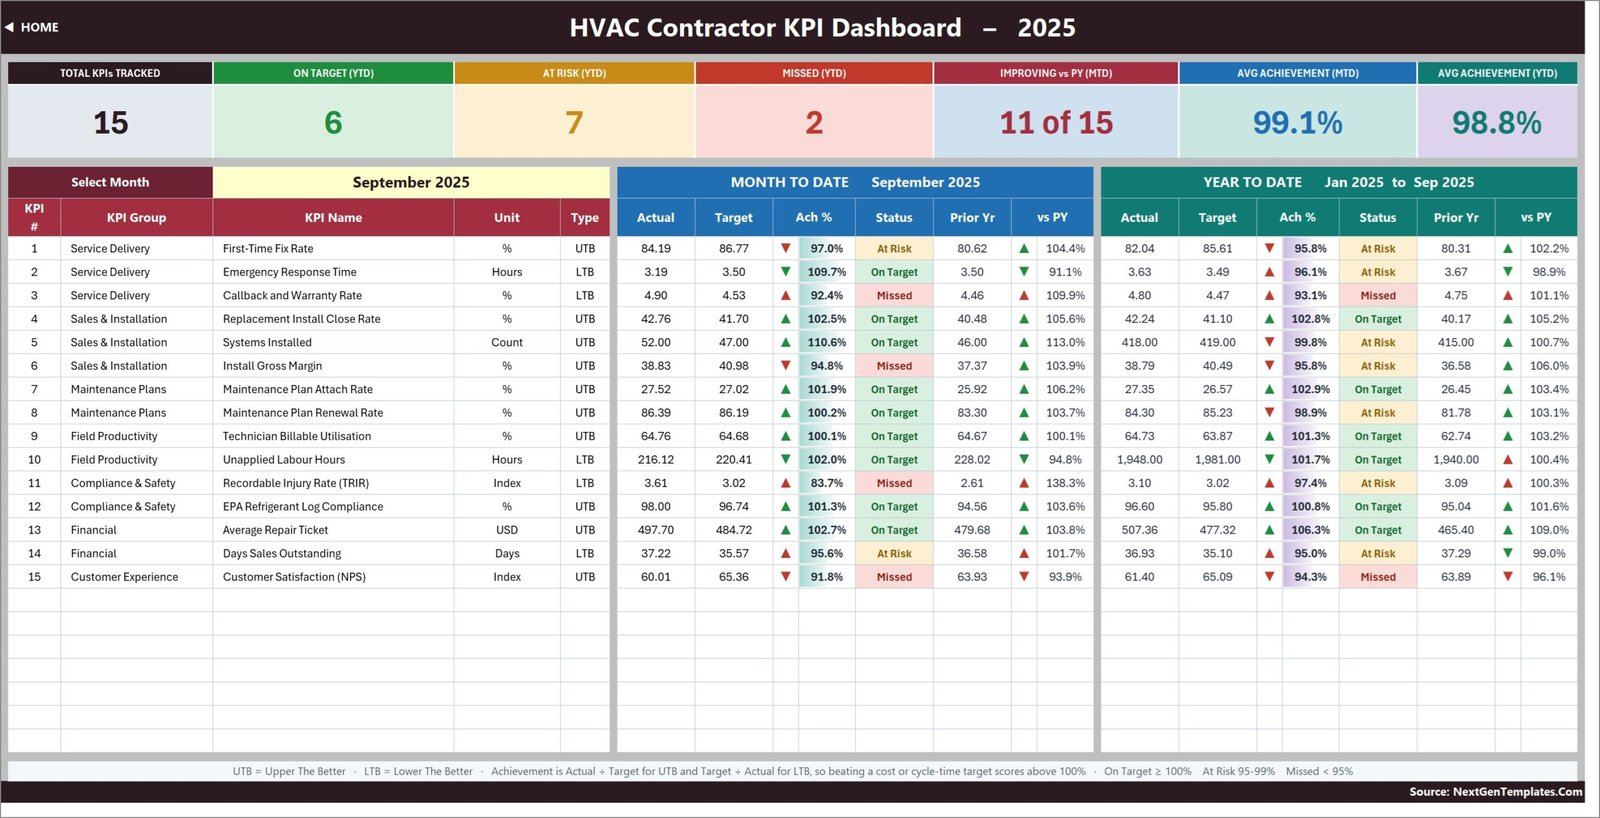
- One dropdown drives everything – cell D6 on KPI Dashboard picks the month; the scorecard, the seven summary cards and the whole KPI Analysis page follow it.
- Direction-aware scoring – each KPI is flagged UTB (upper the better) or LTB (lower the better), so beating a 3.50-hour response target or a 4.50 percent callback target scores above 100 percent instead of reading as a miss.
- Traffic lights you control – On Target from 100 percent, At Risk 95 to 99 percent, Missed below 95 percent; the thresholds live in columns L and U on KPI Dashboard and you can edit them to your own governance.
- MTD and YTD side by side – actual, target, achievement, status, prior year and vs-PY for both periods, on one row per KPI.
- Add or rename a KPI without touching a formula – type it on KPI Definition and it flows through the three input sheets, the scorecard, the trend page and the analysis page. The sheets are wired for 22 KPI rows.
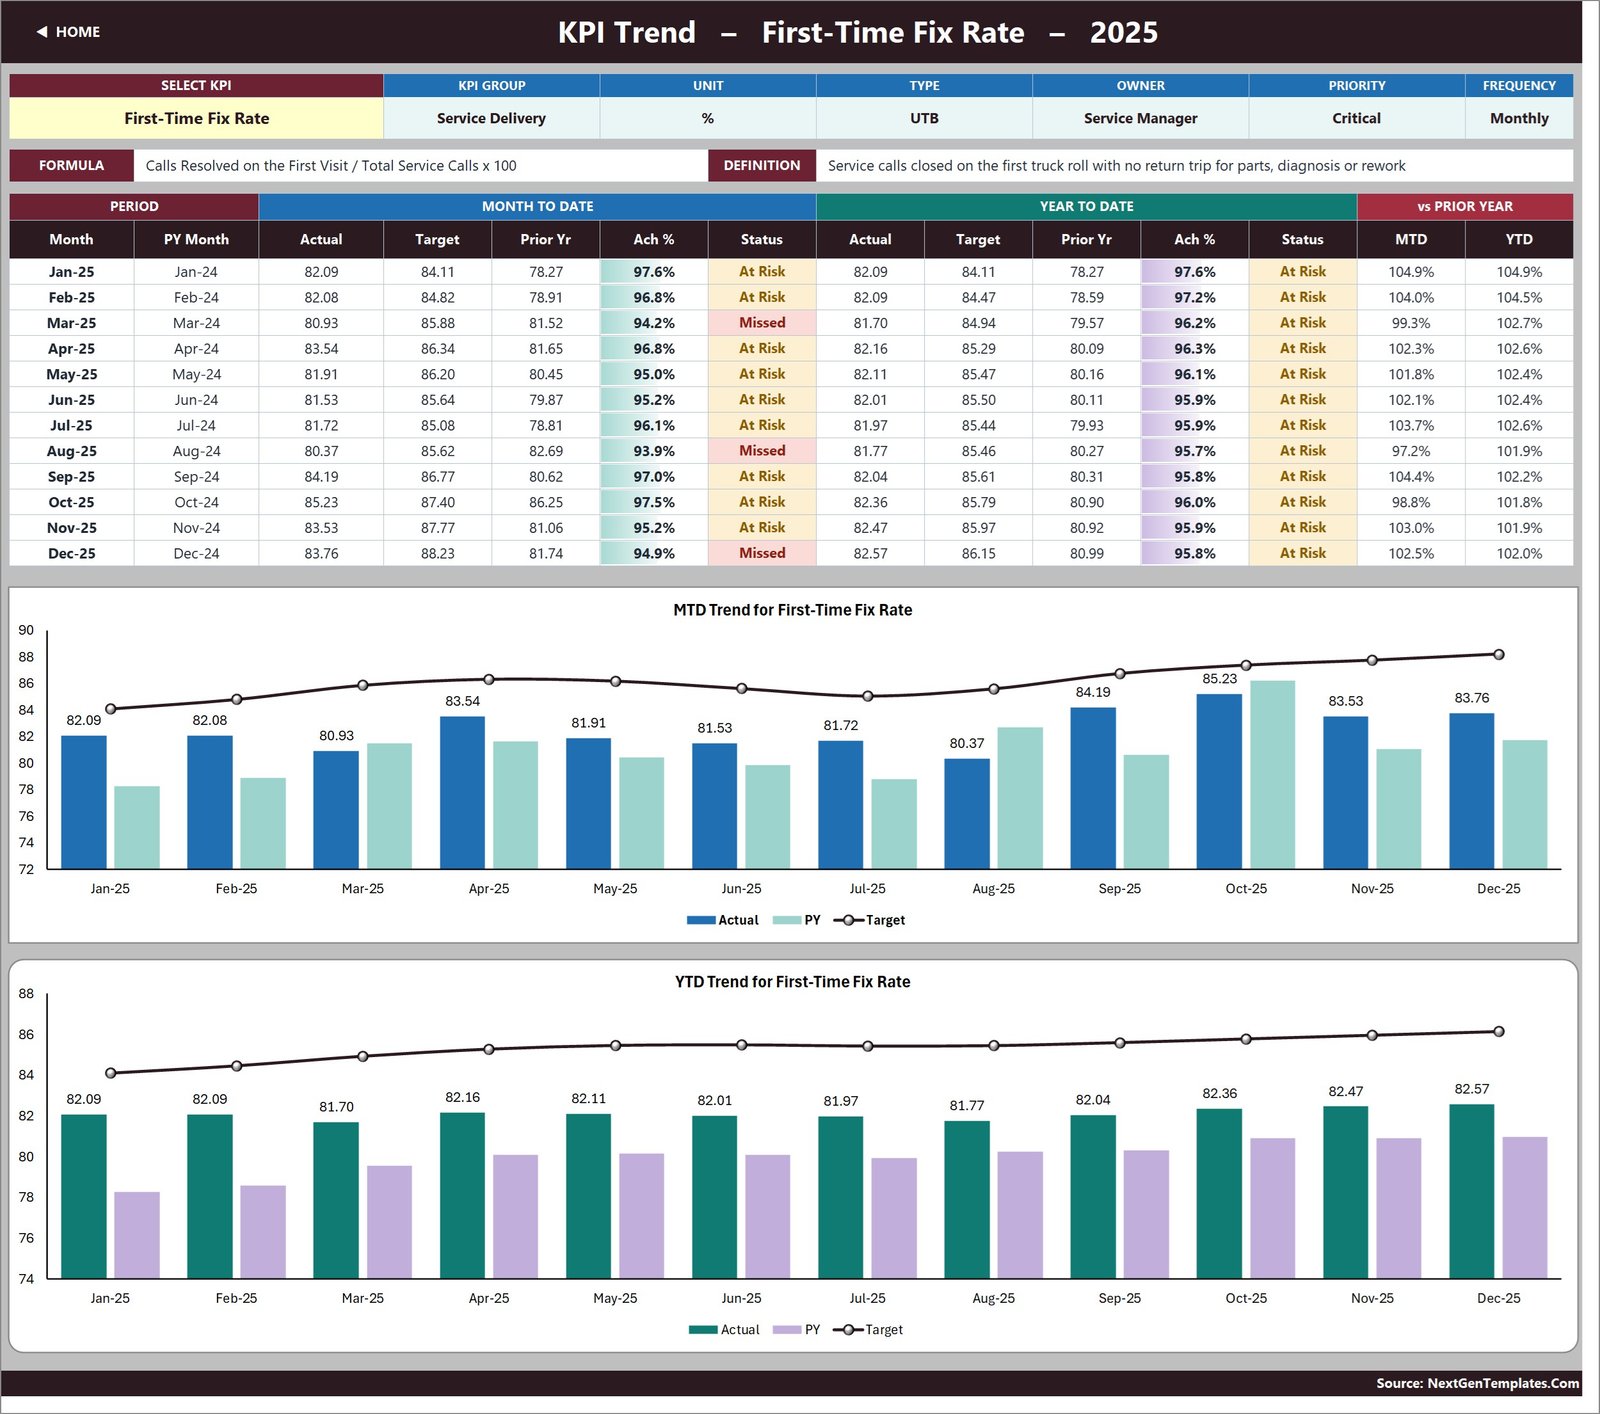
- Twelve-month trend per KPI – the KPI Trend page redraws its MTD and YTD combo charts, its attribute strip and its twelve-month table from a single KPI dropdown.
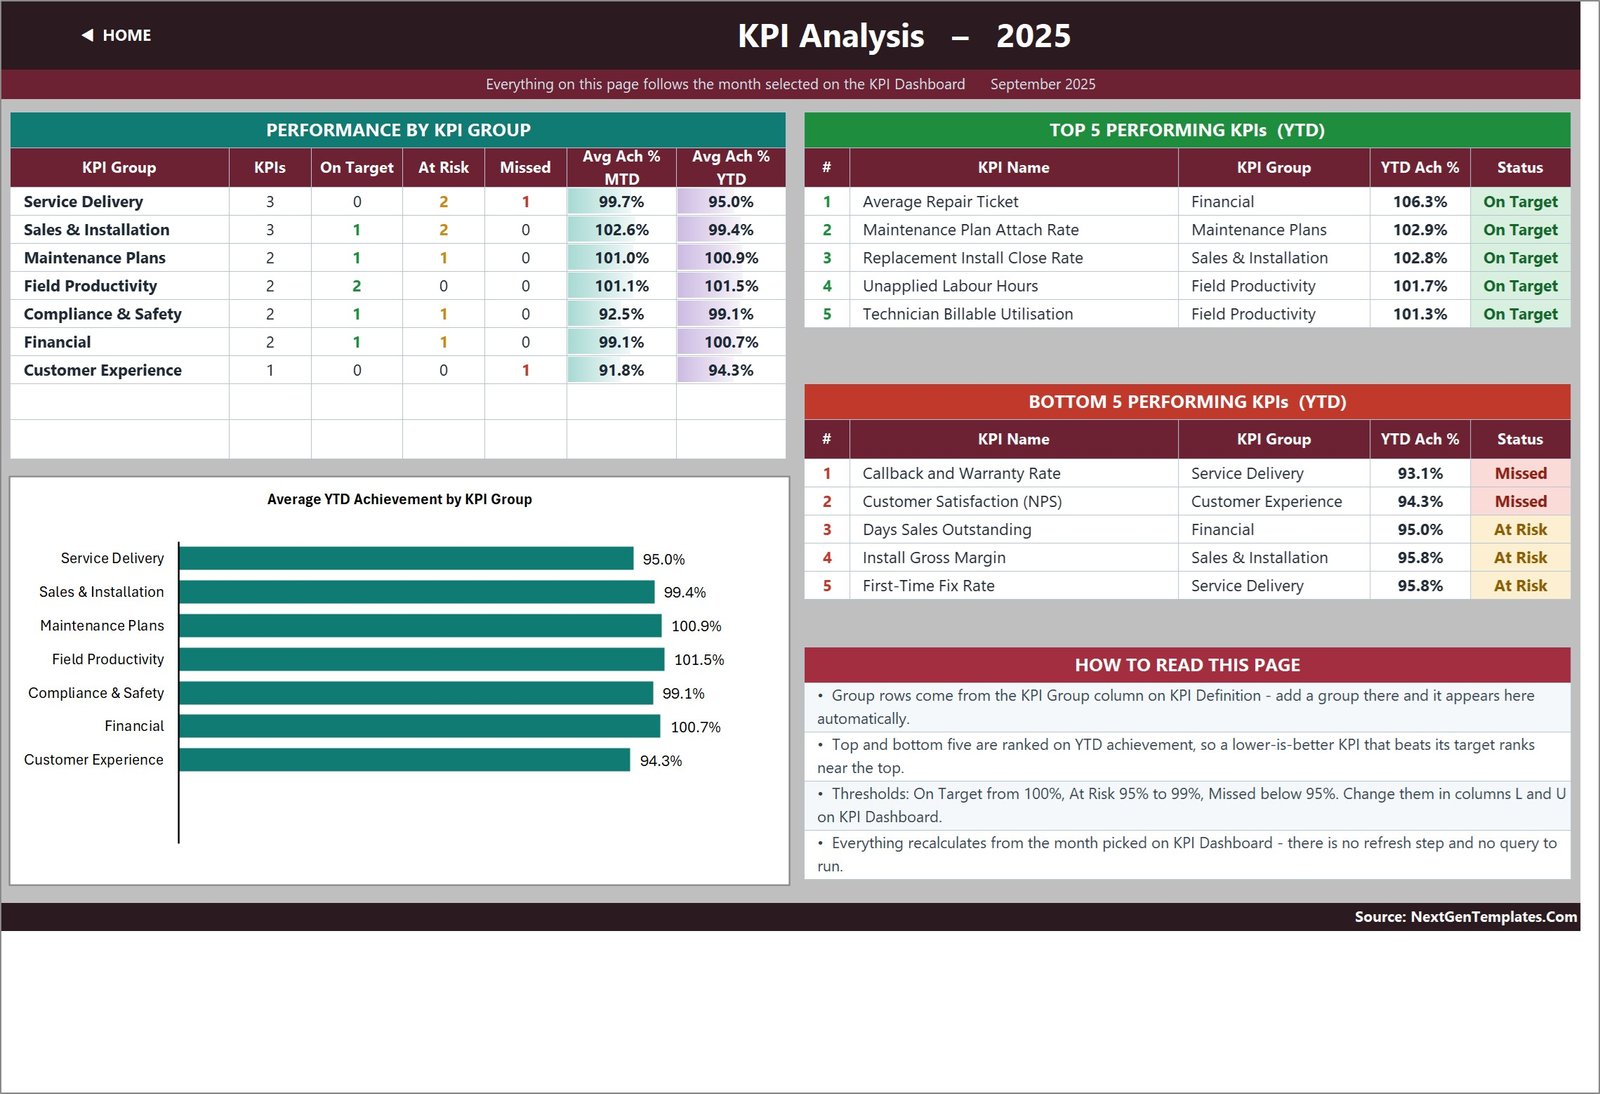
- Group roll-up and rankings – KPI Analysis totals achievement by KPI group and lists the top five and bottom five KPIs for the year to date.
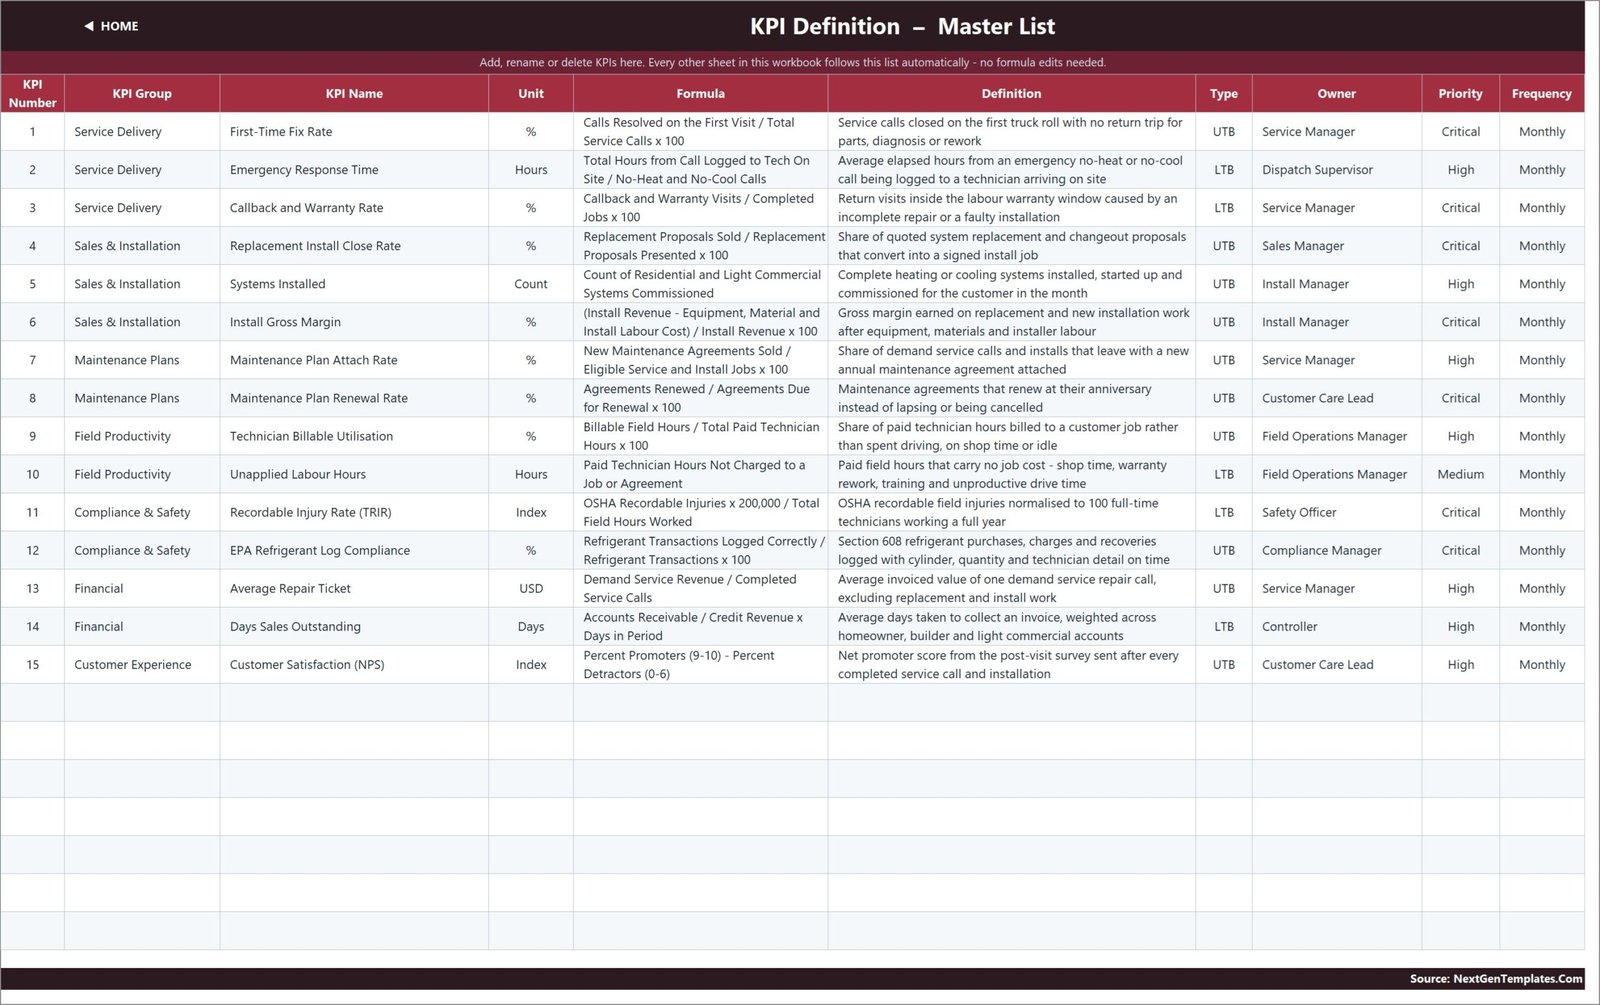
- Owner, priority and frequency per KPI – Service Manager, Dispatch Supervisor, Install Manager, Field Operations Manager, Safety Officer, Compliance Manager, Controller and Customer Care Lead are named on KPI Definition, so every metric has a person against it.
What’s Inside the HVAC Contractor KPI Dashboard in Excel
Nine visible sheets, three of which you type in:
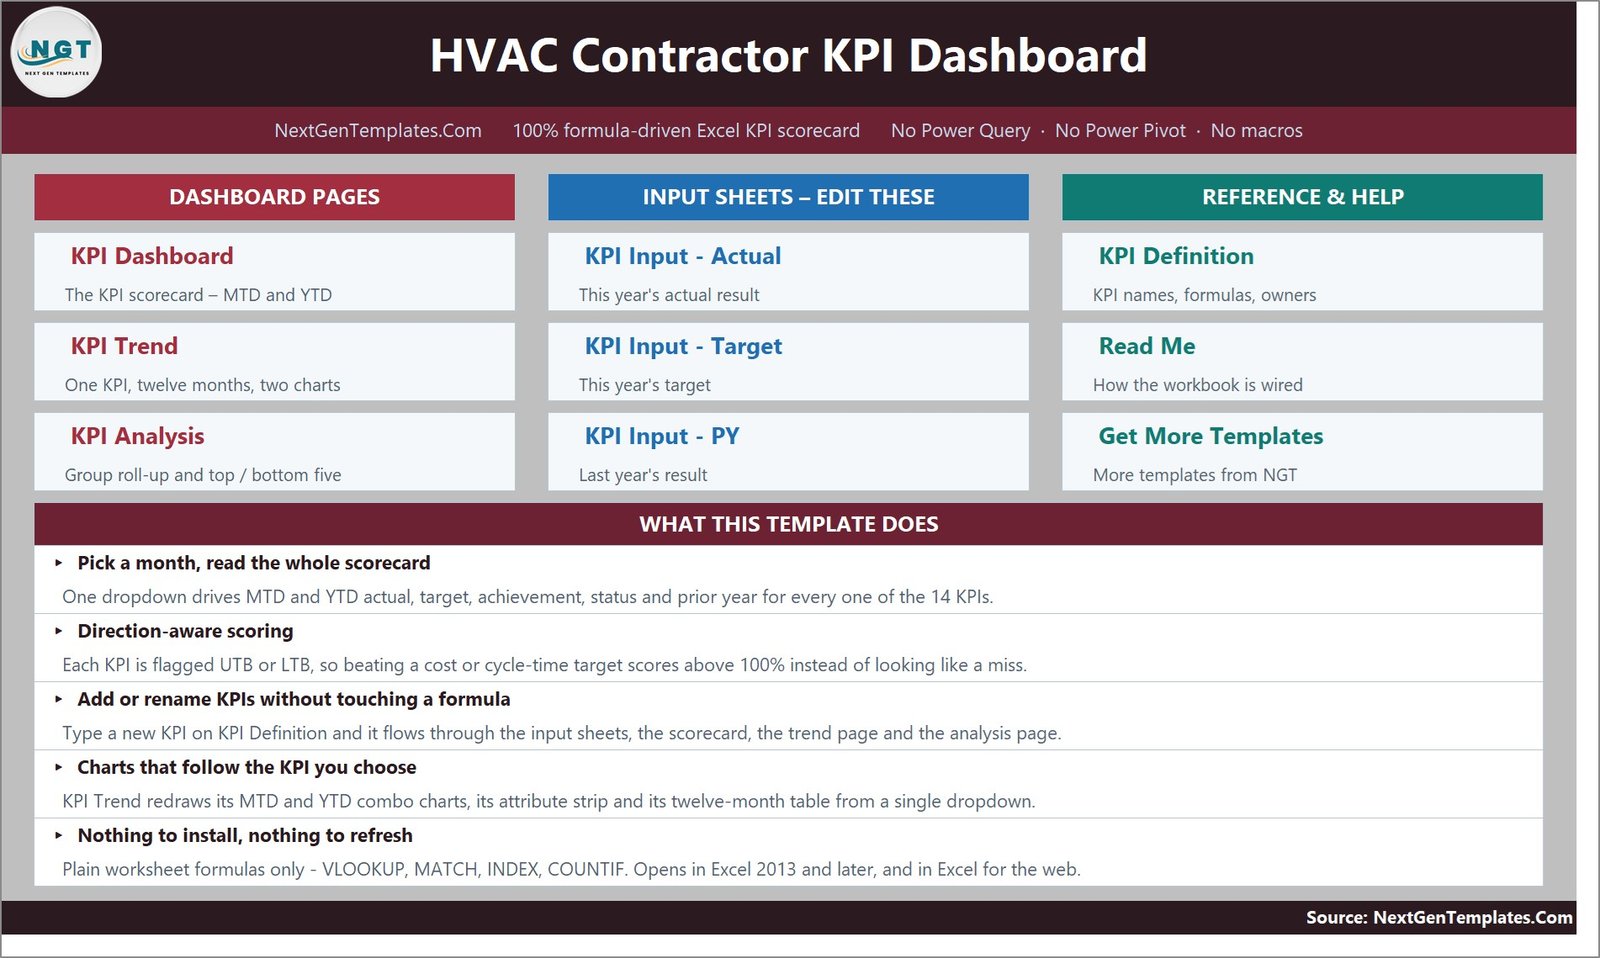
- Home – a navigation page with a card per sheet and a plain-English summary of what the workbook does.
- KPI Dashboard – the scorecard. Seven summary cards (Total KPIs Tracked, On Target YTD, At Risk YTD, Missed YTD, Improving vs PY MTD, Avg Achievement MTD, Avg Achievement YTD) sit above a 15-row grid split into a Month to Date block and a Year to Date block.
- KPI Trend – one KPI at a time: its group, unit, type, owner, priority and frequency, its formula and definition, a twelve-month MTD / YTD / vs-PY table, and two combo charts with actual and prior-year columns against a target line.
- KPI Analysis – Performance by KPI Group (KPI count, On Target, At Risk, Missed, average achievement MTD and YTD), a bar chart of average YTD achievement by group, and Top 5 and Bottom 5 performing KPIs for the year to date.
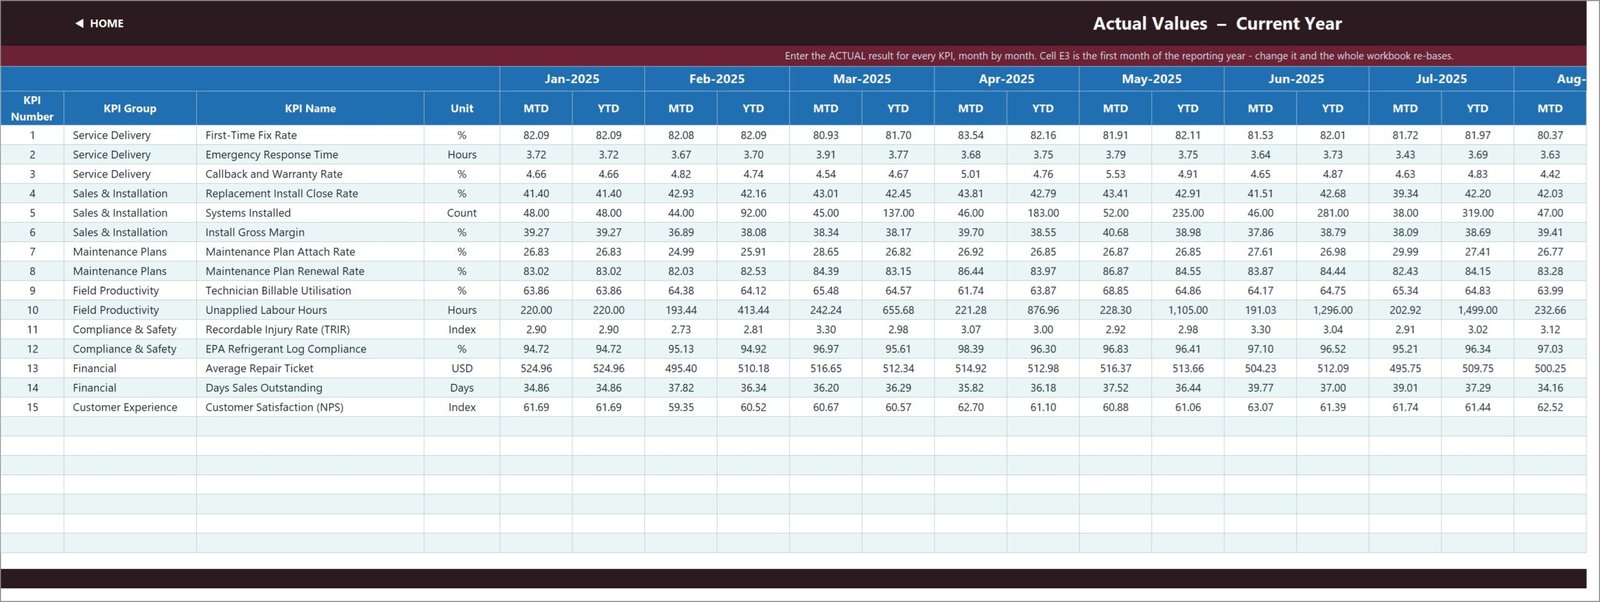
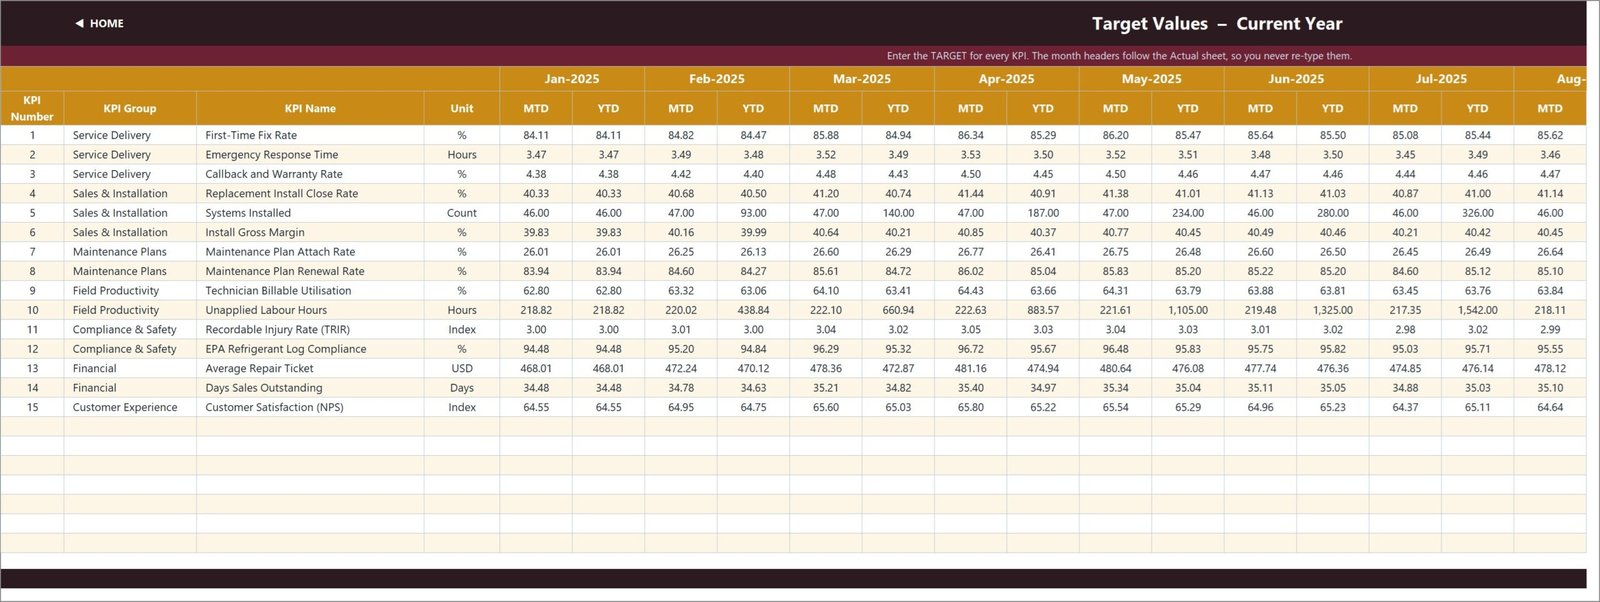
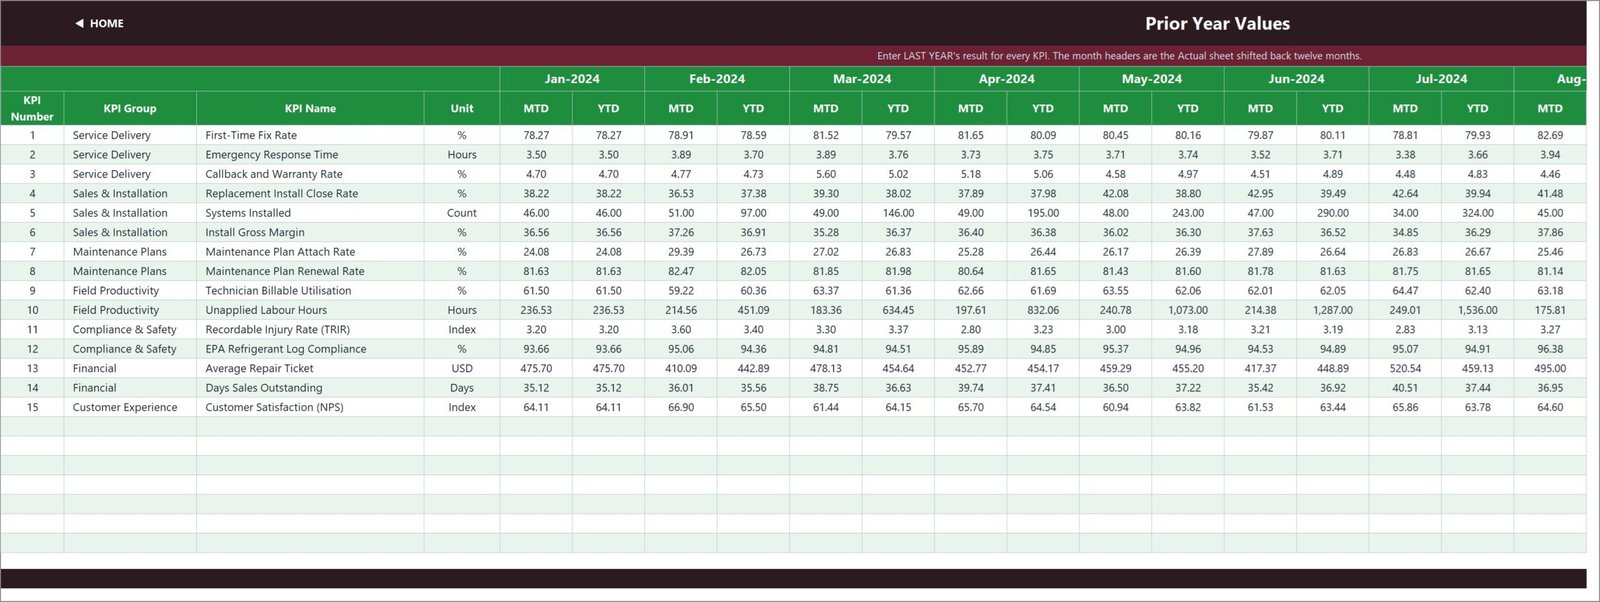
- KPI Input – Actual, KPI Input – Target and KPI Input – PY – your data. An MTD and a YTD column for every month, on all three sheets, with the KPI rows driven by KPI Definition so they always line up.
- KPI Definition – the master list: number, group, name, unit, formula, definition, type, owner, priority, frequency.
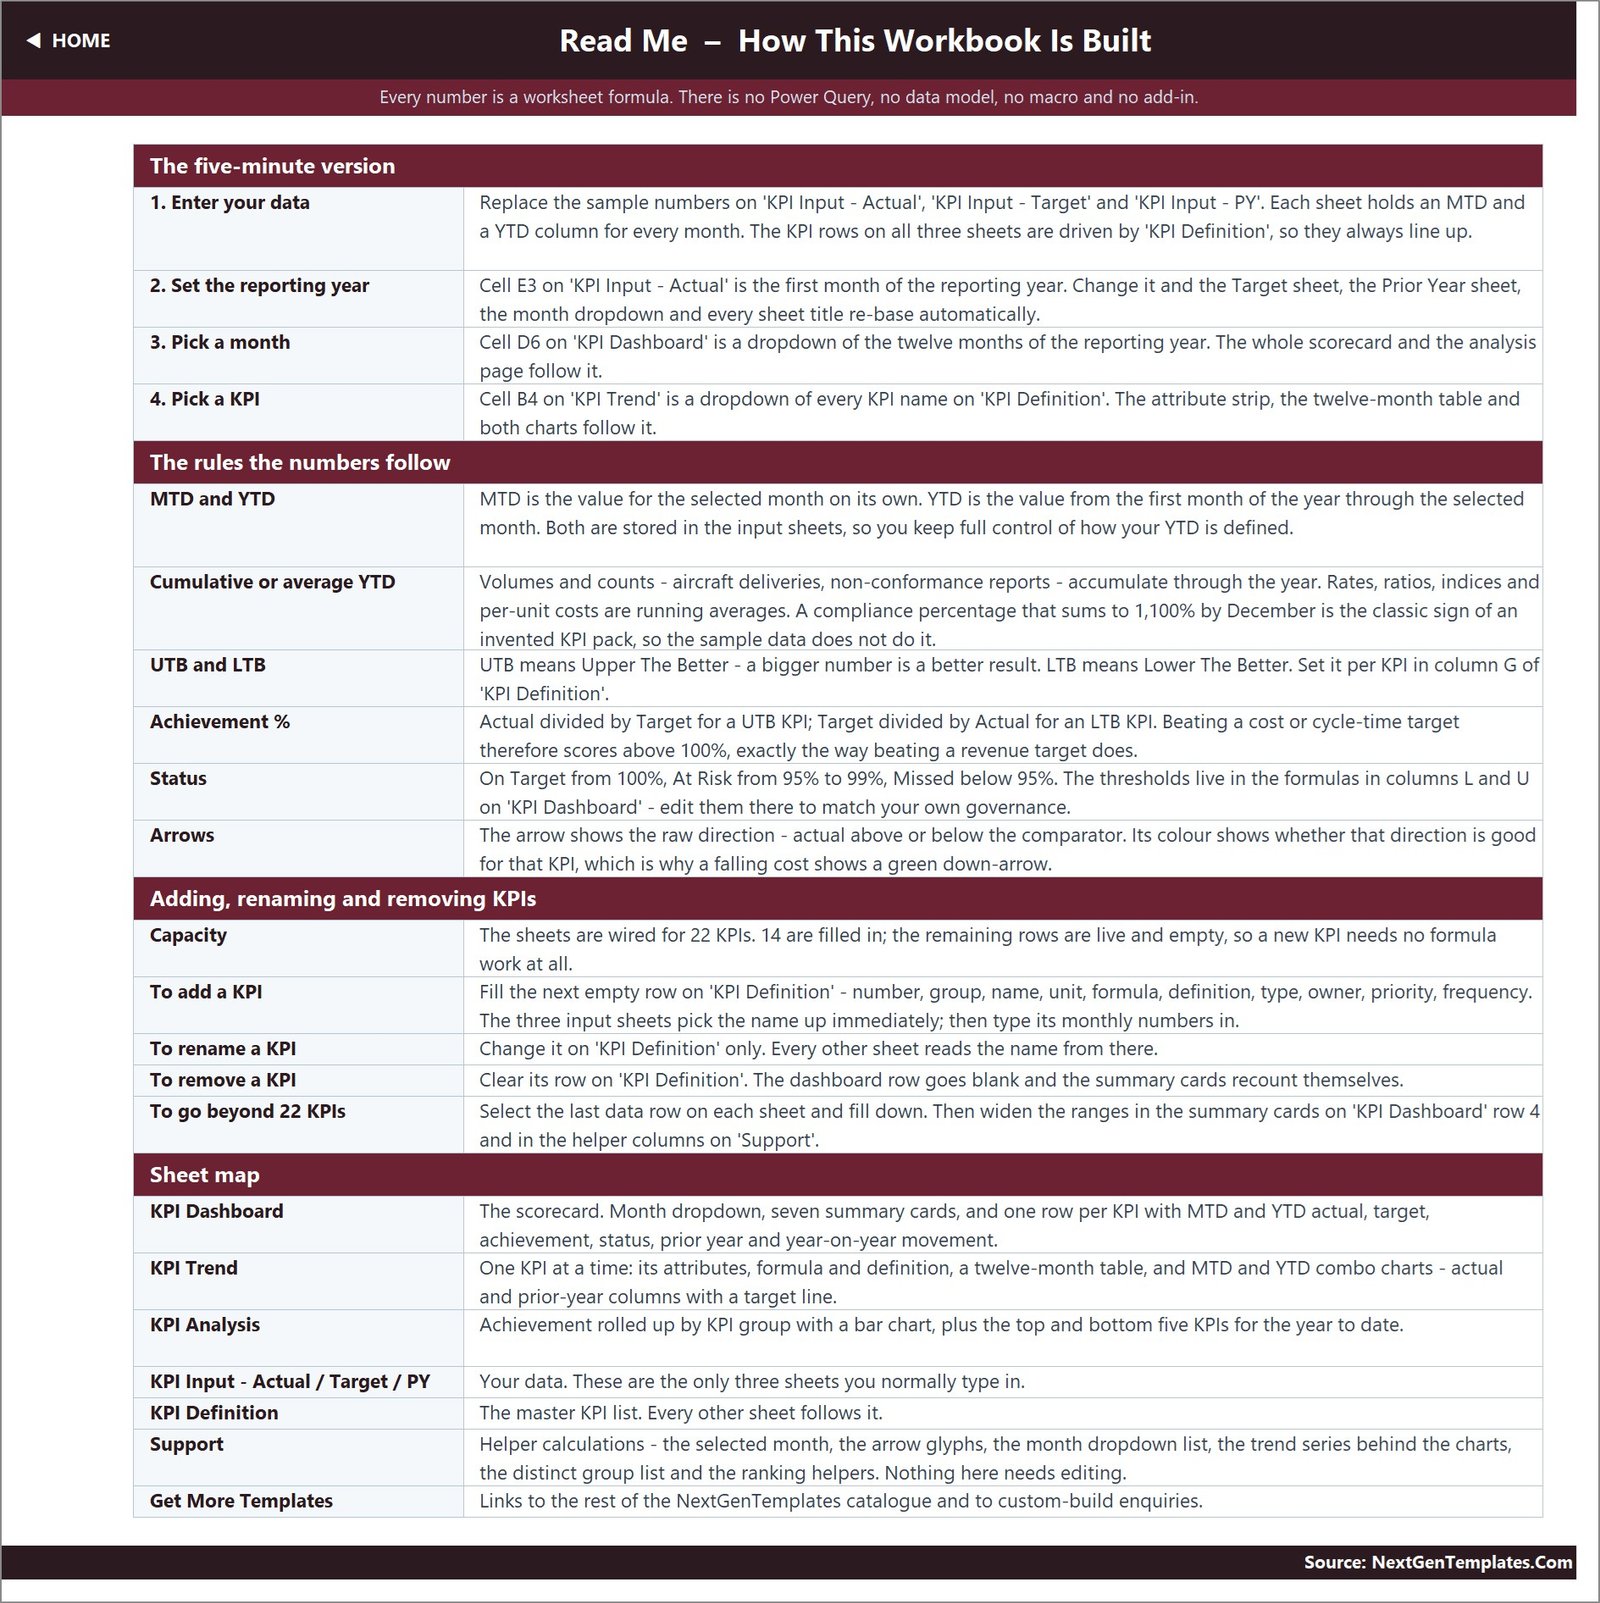
- Read Me – how the workbook is wired, the MTD and YTD rules, the achievement maths and the sheet map.
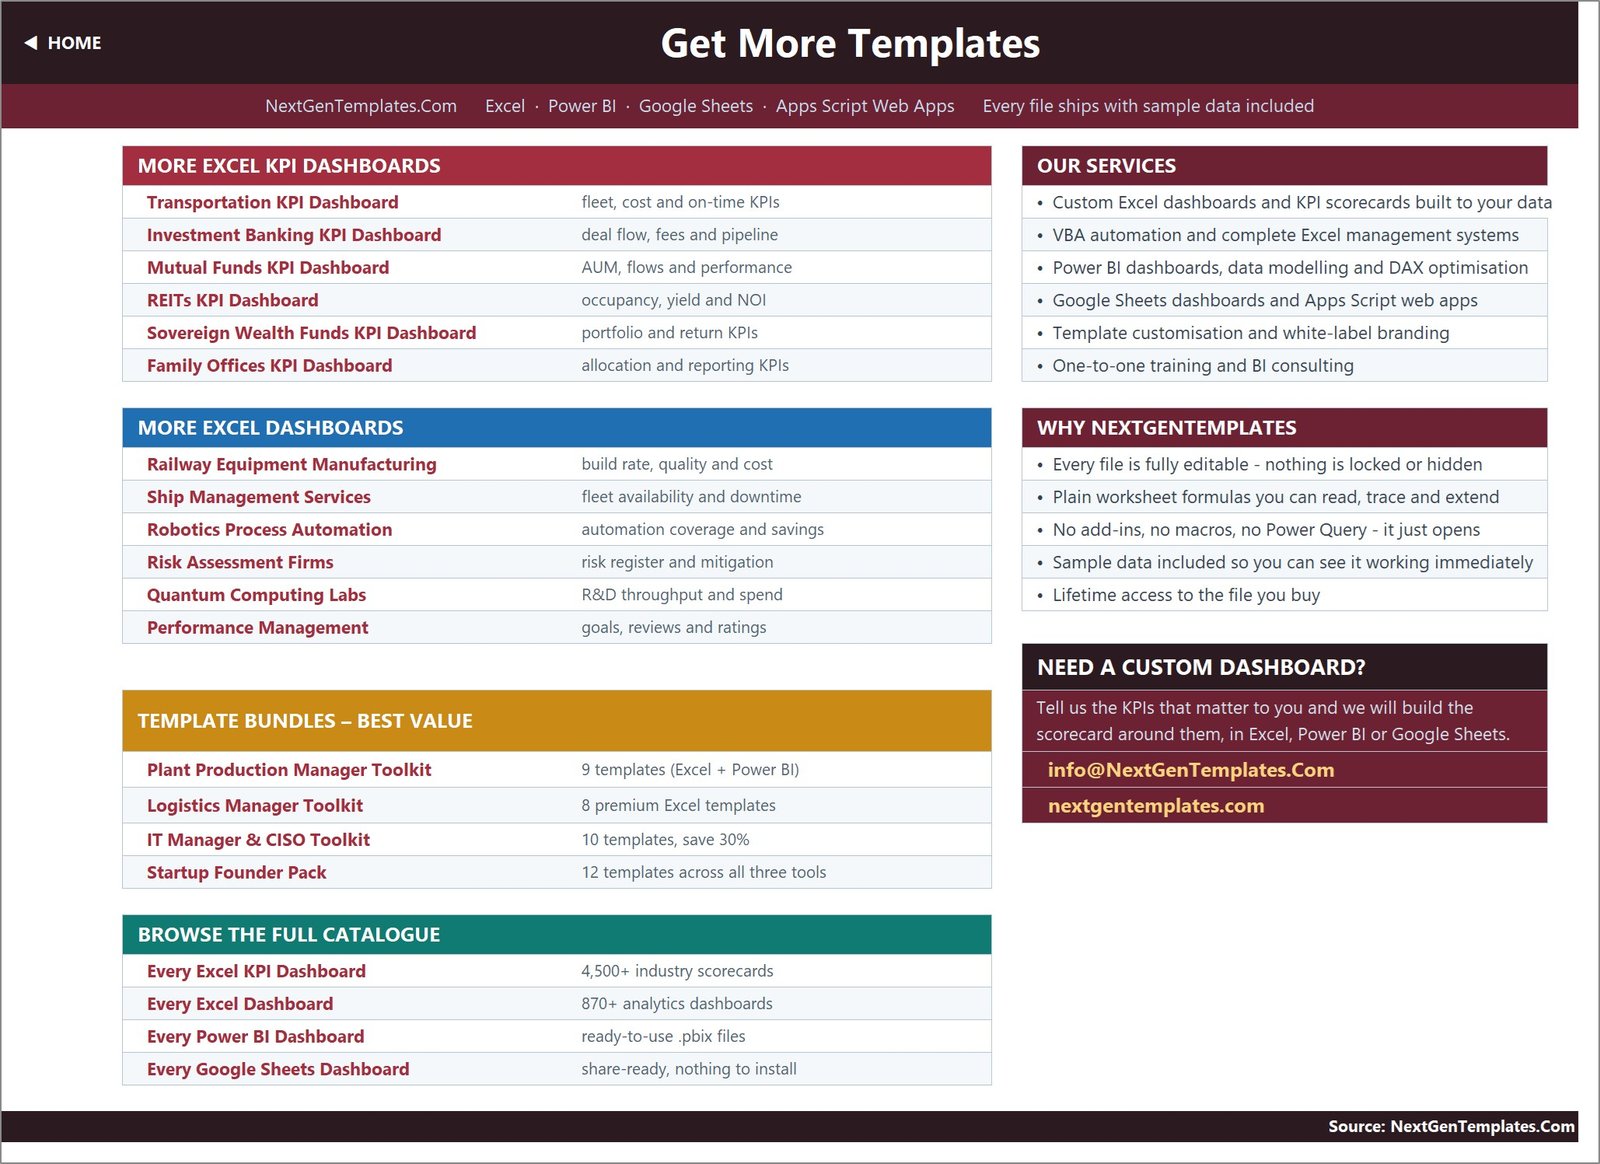
- Get More Templates – links back to the NextGenTemplates catalogue.
A Support sheet holds the helper calculations – the selected month, the arrow glyphs, the dropdown list, the chart series and the ranking helpers. You never need to edit it.
HVAC Contractor KPI Dashboard in Excel vs. Google Sheets vs. Paid Field-Service SaaS – Where This Fits
| What you get | This Excel template | Google Sheets edition | Field-service SaaS reporting |
|---|---|---|---|
| Cost | 19.99 one-off (12.99 on sale) | 13.99 one-off | Per-technician monthly subscription |
| Platform | Excel 2013+, Microsoft 365, Excel for the web | Google Sheets, any browser | Vendor cloud plus a mobile app |
| Setup time | Under 30 minutes – type your numbers over the sample year | Under 30 minutes | Weeks: data migration, dispatch setup, staff training |
| Real-time team collaboration | Via OneDrive or SharePoint co-authoring | Yes, native | Yes |
| Mobile access | Excel mobile app | Sheets mobile app | Yes, purpose-built |
| Customisable KPIs | Yes – rename or add on KPI Definition, up to 22 rows with no formula work | Yes | Only what the vendor exposes |
| Share with a link | OneDrive link | Yes | Yes, inside your licence |
| Year-1 cost at 5 technicians | 19.99 | 13.99 | Thousands, and it recurs |
| Dispatching and invoicing | No – this is reporting only | No | Yes |
| Refrigerant log and TRIR rows out of the box | Yes, two dedicated KPIs | Yes | Usually a custom report |
Who This Template Is For – and Who It’s Not For
It is for owner-operators and general managers of residential and light-commercial HVAC firms who already have the numbers – in a field-service app, an accounting package or a spreadsheet – and want one page that scores them monthly; service and install managers preparing a monthly operations review; and anyone who has to show a franchisor, a lender or an investor a consistent scorecard. HVAC Contractor KPI Dashboard in Excel
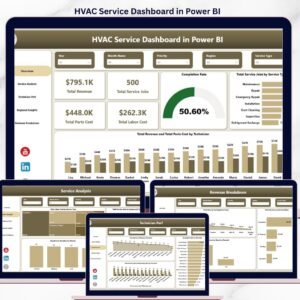
It is not for you if you want the workbook to pull data automatically – there is no connector and no query, and MTD and YTD are both typed in on the input sheets. It is not a dispatch board, a job-costing system or an invoicing tool. And it will not calculate your KPIs from raw job records: you feed it the monthly result for each KPI, not the underlying tickets. If you want slicers over a transaction table instead, the analytical HVAC Service Dashboard in Excel is the better fit.
How to Use the HVAC Contractor KPI Dashboard in Excel
- Open it and look around. A full year of sample 2025 data is already in, so every page is live from the first click.
- Set your reporting year. Cell E3 on KPI Input – Actual is the first month; change it and the Target sheet, the Prior Year sheet, the month dropdown and every sheet title re-base themselves. HVAC Contractor KPI Dashboard in Excel
- Edit the KPI list. On KPI Definition, rename what you do not measure and clear the rows you do not want. The dashboard row goes blank and the summary cards recount themselves.
- Type your numbers. Fill KPI Input – Actual, KPI Input – Target and KPI Input – PY, MTD and YTD for each month. Rates and indices run as averages; volumes such as Systems Installed accumulate.
- Pick a month in cell D6 on KPI Dashboard and read the scorecard.
- Drill in. Choose any KPI in cell B4 on KPI Trend to see its twelve-month story, then use KPI Analysis for the group roll-up and the bottom five.
Real-World Use Cases
Dana, owner of a nine-technician residential HVAC company. Her callback rate crept up over the summer. The Bottom 5 list on KPI Analysis put Callback and Warranty Rate first at 93.1 percent YTD achievement, and the KPI Trend page showed where the slide began. She ties a technician refresher to it and watches one chart each month. HVAC Contractor KPI Dashboard in Excel
Marcus, service manager at a light-commercial contractor. He runs a twenty-minute monthly operations review off two pages: the scorecard for the month just closed, then KPI Analysis so each group lead – Service Delivery, Sales and Installation, Maintenance Plans, Field Productivity, Compliance and Safety, Financial, Customer Experience – sees their own row.
Priya, controller at a three-branch group. She keeps one copy per branch, changes nothing but the input sheets, and compares Days Sales Outstanding and Install Gross Margin across the three on identical thresholds. HVAC Contractor KPI Dashboard in Excel
Frequently Asked Questions
Does this connect to my field-service software or accounting package?
No. There is no connector, no Power Query and no API. You read your monthly KPI values and type them into the three input sheets. That is deliberate – it is why the file opens on any machine with no add-in and no refresh step.
Are macros required?
No. It is a plain .xlsx with worksheet formulas only – VLOOKUP, MATCH, INDEX and COUNTIF. There is no VBA, no data model and nothing to enable.
Can I change the KPIs to mine?
Yes, and that is the point of the KPI Definition sheet. Rename, clear or add a KPI there – number, group, name, unit, formula, definition, type, owner, priority, frequency – and every other sheet follows. The sheets are wired for 22 KPI rows, and 15 are filled in.
The Home sheet mentions 14 KPIs. How many are there?
Fifteen. The file ships with 15 KPIs and everything that calculates – the summary cards, the grid, the group roll-up, the rankings – uses all 15. Two descriptive labels, on Home and on Read Me, still read 14 from an earlier draft. It is a wording slip in the documentation, not a missing KPI, and you can correct the text in seconds.
Does it calculate YTD for me?
No – YTD is typed alongside MTD on each input sheet, on purpose. That way you keep control of whether a KPI accumulates (Systems Installed, Unapplied Labour Hours) or runs as an average (rates, indices, per-unit values), instead of a formula guessing wrong.
Will the Excel, Power BI and Google Sheets editions match?
They are the same family and the same reporting logic, but they are separate builds. Pick the platform your team actually opens; do not buy two expecting an identical file.
Can I rebrand it for a franchise or a client?
Yes. Nothing is locked, hidden or password-protected – colours, logos, sheet names and headings are all editable.
About the Author
Built by PK – Microsoft Certified Professional with 15+ years of Excel, Google Sheets, and Power BI experience. Founder of NextGenTemplates, reaching 300K+ subscribers across YouTube channels. Every template is hand-built and tested before release.
Explore Related Templates
- HVAC Contractor KPI Dashboard in Power BI – the same scorecard for Power BI Desktop.
- HVAC Contractor KPI Dashboard in Google Sheets – the browser-based edition.
- HVAC Contractor KPI Scorecard in Excel – the card-style sibling with a comparison switch.
- Plumbing Business KPI Dashboard in Excel and Electrical Contractor KPI Scorecard in Excel – the same build for the other trades.
- Browse every KPI Dashboard template or the whole MS Excel catalogue.
Buy once, own it forever. Instant download, no subscription, no seat count and nothing to install. Replace the sample year with your own numbers and you have a monthly HVAC scorecard your service manager, install manager and controller can all read from the same page. HVAC Contractor KPI Dashboard in Excel
Last updated: 27 August 2026.
































Reviews
There are no reviews yet.