


The Insulation Contractor KPI Dashboard in Google Sheets tracks 14 insulation-trade KPIs across 5 KPI groups and 9 linked sheets, with a month picker that re-drives every Month-to-Date and Year-to-Date figure on the page. Ten KPIs are upper-the-better and four are lower-the-better, so a falling waste rate or a shorter scheduling lead time scores above 100% instead of looking like a loss. Setup takes under 10 minutes: type your numbers into three yellow input sheets and every card, traffic light and chart recalculates.
🌍 Join 8,400+ teams in 40+ countries using NextGenTemplates to replace paid SaaS tools with one-time-purchase Excel, Google Sheets, Power BI and HTML templates.
✅ Instant download · One-time payment · No subscription · No per-user fees · Lifetime access
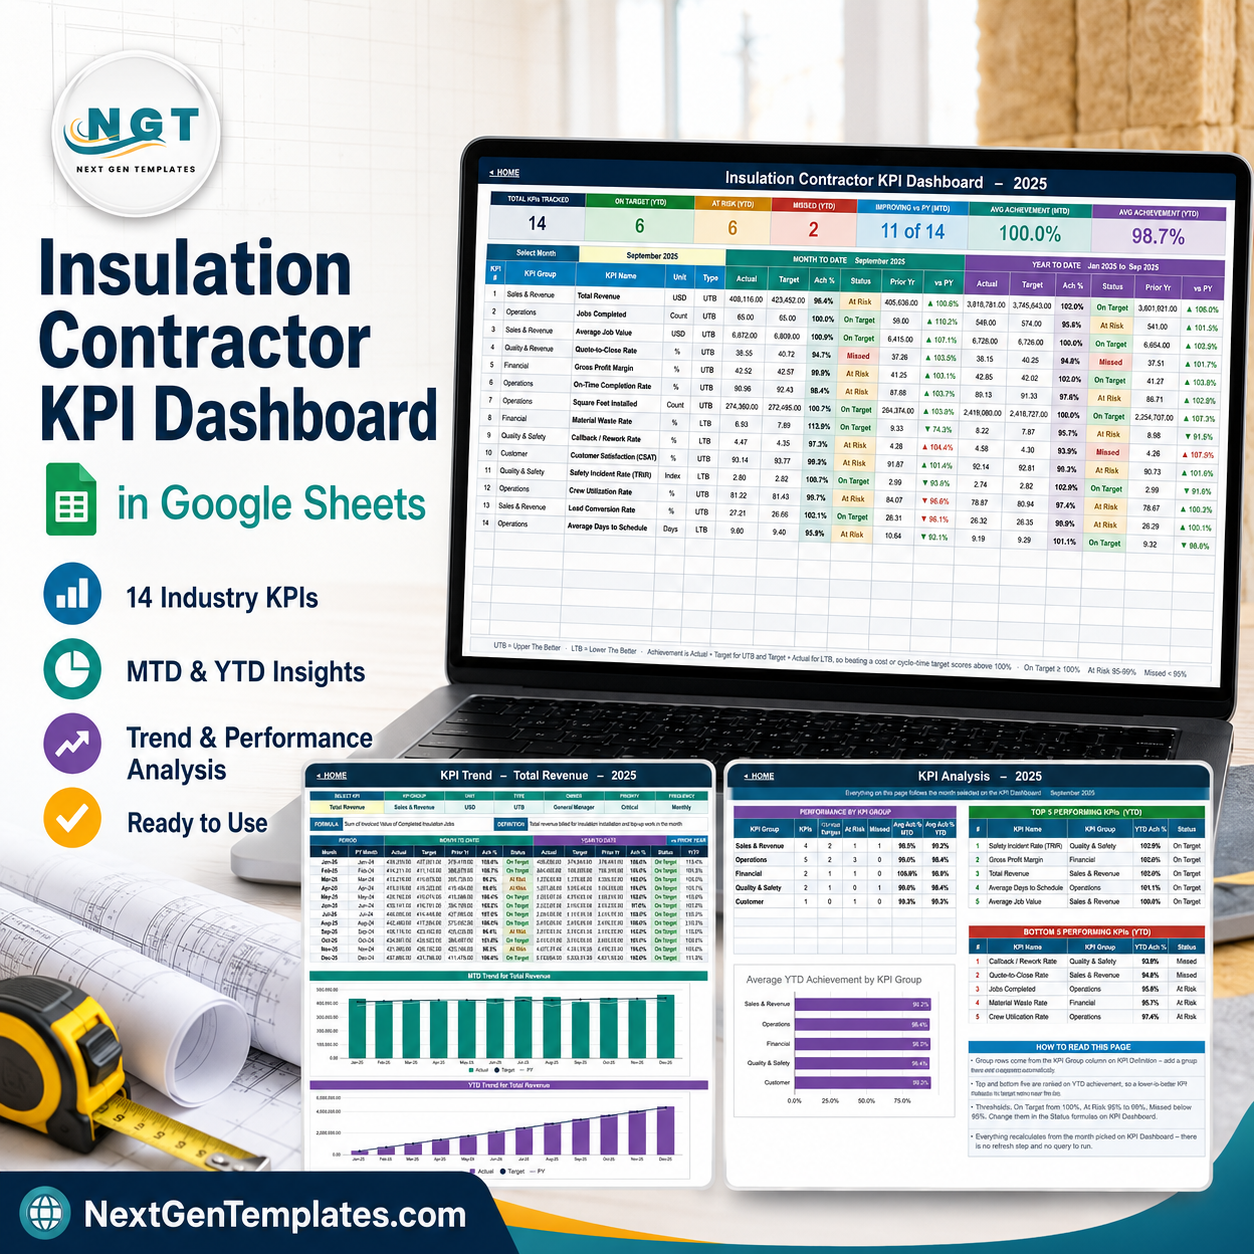
🔑 Key Features of the Insulation Contractor KPI Dashboard in Google Sheets
📌 14 insulation KPIs, grouped the way the business is run. Sales & Revenue holds 4 KPIs (Total Revenue, Average Job Value, Quote-to-Close Rate, Lead Conversion Rate). Operations holds 5 (Jobs Completed, On-Time Completion Rate, Square Feet Installed, Crew Utilization Rate, Average Days to Schedule). Financial holds 2, Quality & Safety holds 2, and Customer holds 1.
📌 Direction is built into the maths, not left to you. Every KPI carries a UTB or LTB flag. Achievement is Actual ÷ Target for upper-the-better KPIs and Target ÷ Actual for lower-the-better ones, so Material Waste Rate, Callback / Rework Rate, Safety Incident Rate (TRIR) and Average Days to Schedule score correctly when they fall.
📌 One month picker drives the whole workbook. Pick a month on the KPI Dashboard sheet and the seven header cards, the 14-row traffic-light grid, the KPI Trend sheet and the KPI Analysis sheet all follow it. There is no refresh step, no add-on and no query to run.
📌 Traffic-light bands you can edit. Status is On Target at 100% and above, At Risk from 95% to 99%, and Missed below 95%. The thresholds live in the Status formulas on the KPI Dashboard sheet, so you can move them to match your own tolerance.
📌 The KPI list is data, not code. Add, rename or delete a KPI on the KPI Definition sheet and every other sheet follows automatically — no formula edits. The same sheet stores each KPI’s unit, formula, plain-English definition, owner, priority and reporting frequency.
📌 Formula-driven Google Sheets, nothing to install. The whole workbook is native spreadsheet formulas and charts. No Apps Script, no add-on, no external connector, and it opens on desktop and the Google Sheets mobile app.
📦 What’s Inside the Insulation Contractor KPI Dashboard in Google Sheets
Page 1: Home
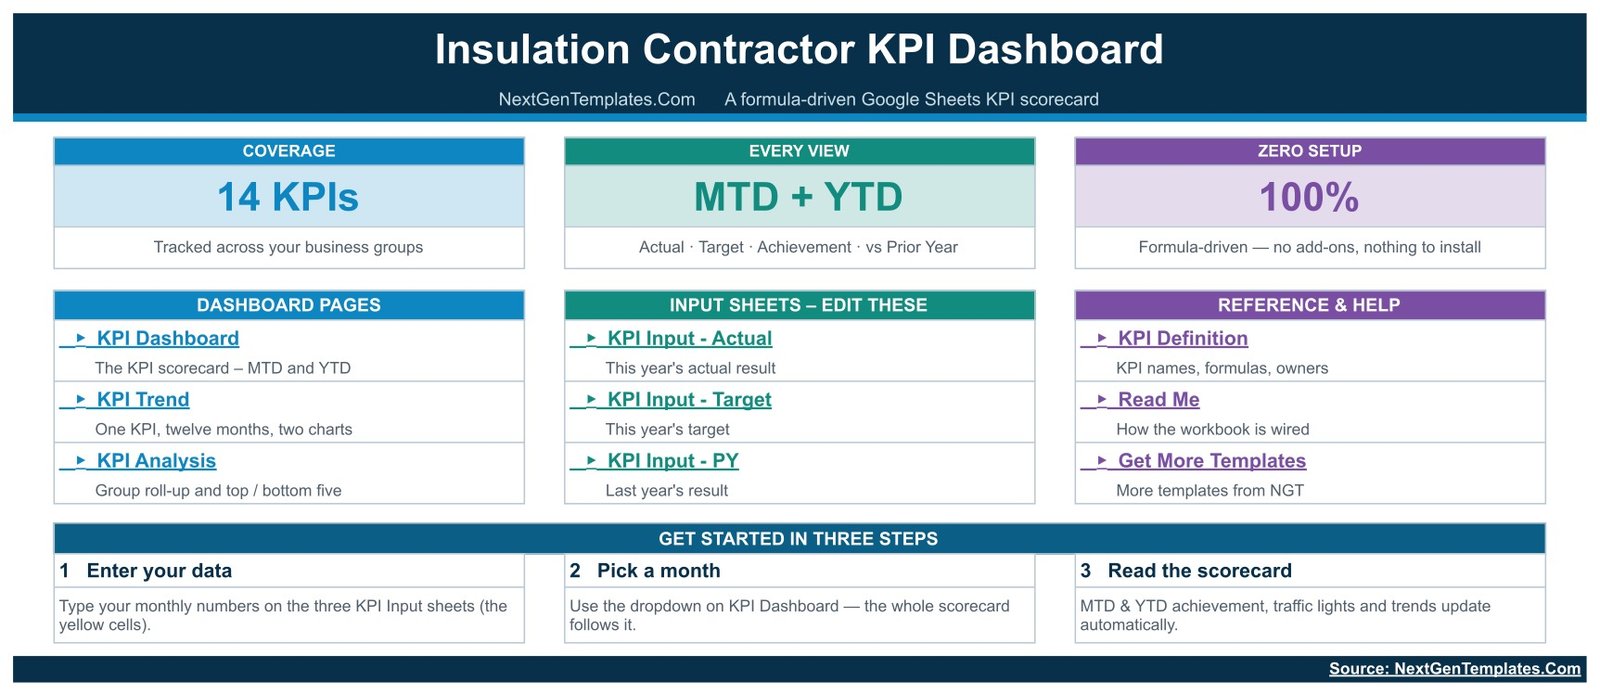
The navigation cover. It shows the coverage cards (14 KPIs, MTD + YTD, 100% formula-driven), links to the three dashboard pages, the three input sheets you edit, and the reference sheets — KPI Definition, Read Me and Get More Templates — plus a three-step “get started” strip.
Page 2: KPI Dashboard
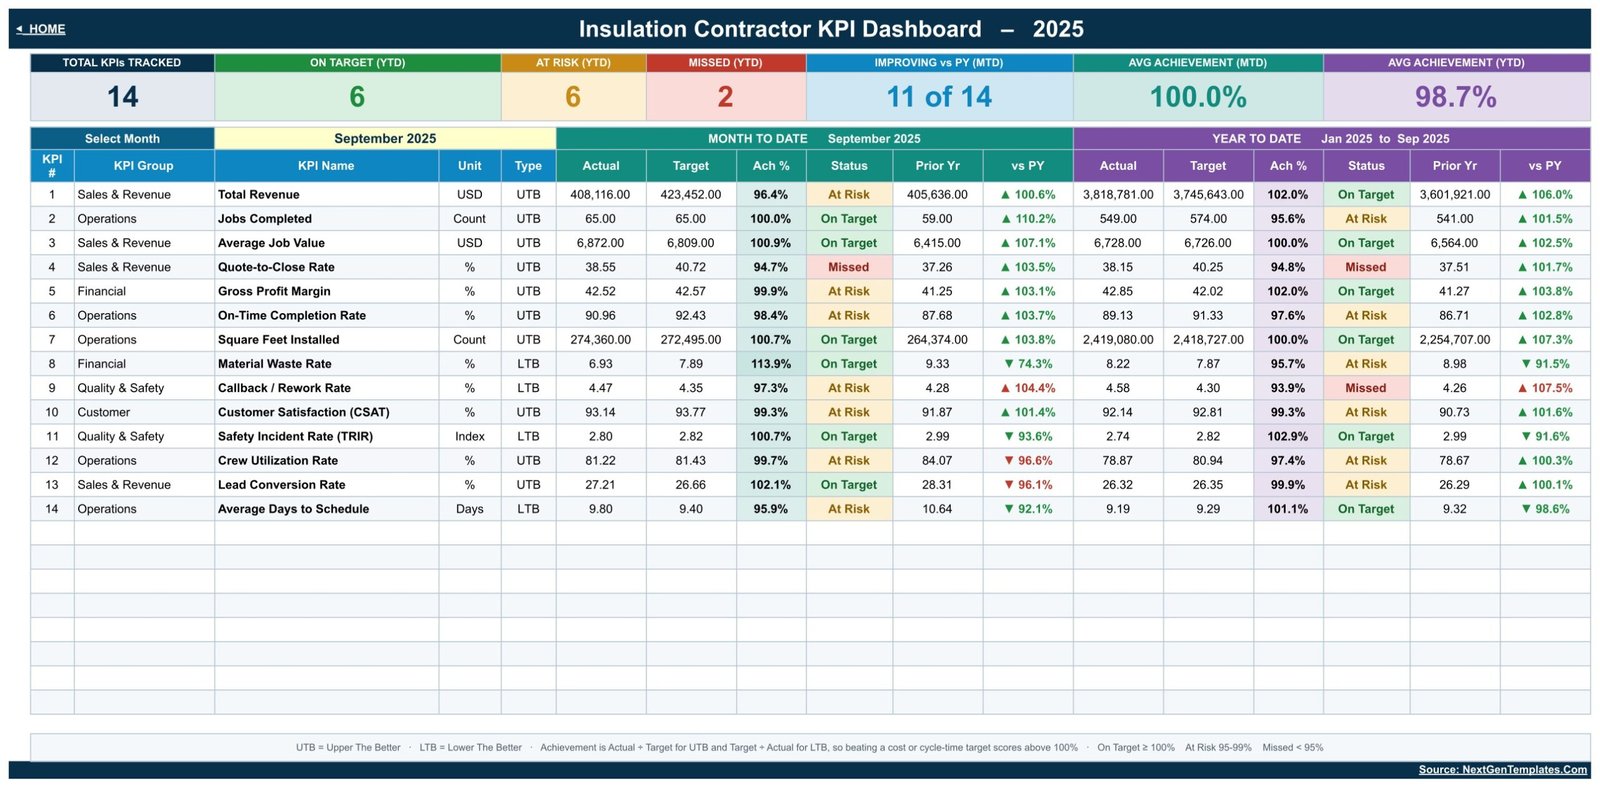
The scorecard. Seven header cards read Total KPIs Tracked, On Target (YTD), At Risk (YTD), Missed (YTD), Improving vs PY (MTD), Avg Achievement (MTD) and Avg Achievement (YTD). Below them a 14-row grid shows KPI Group, KPI Name, Unit, Type, then Actual, Target, Achievement %, Status, Prior Yr and vs PY for both Month to Date and Year to Date. A Select Month dropdown at the top left drives all of it.
Page 3: KPI Trend
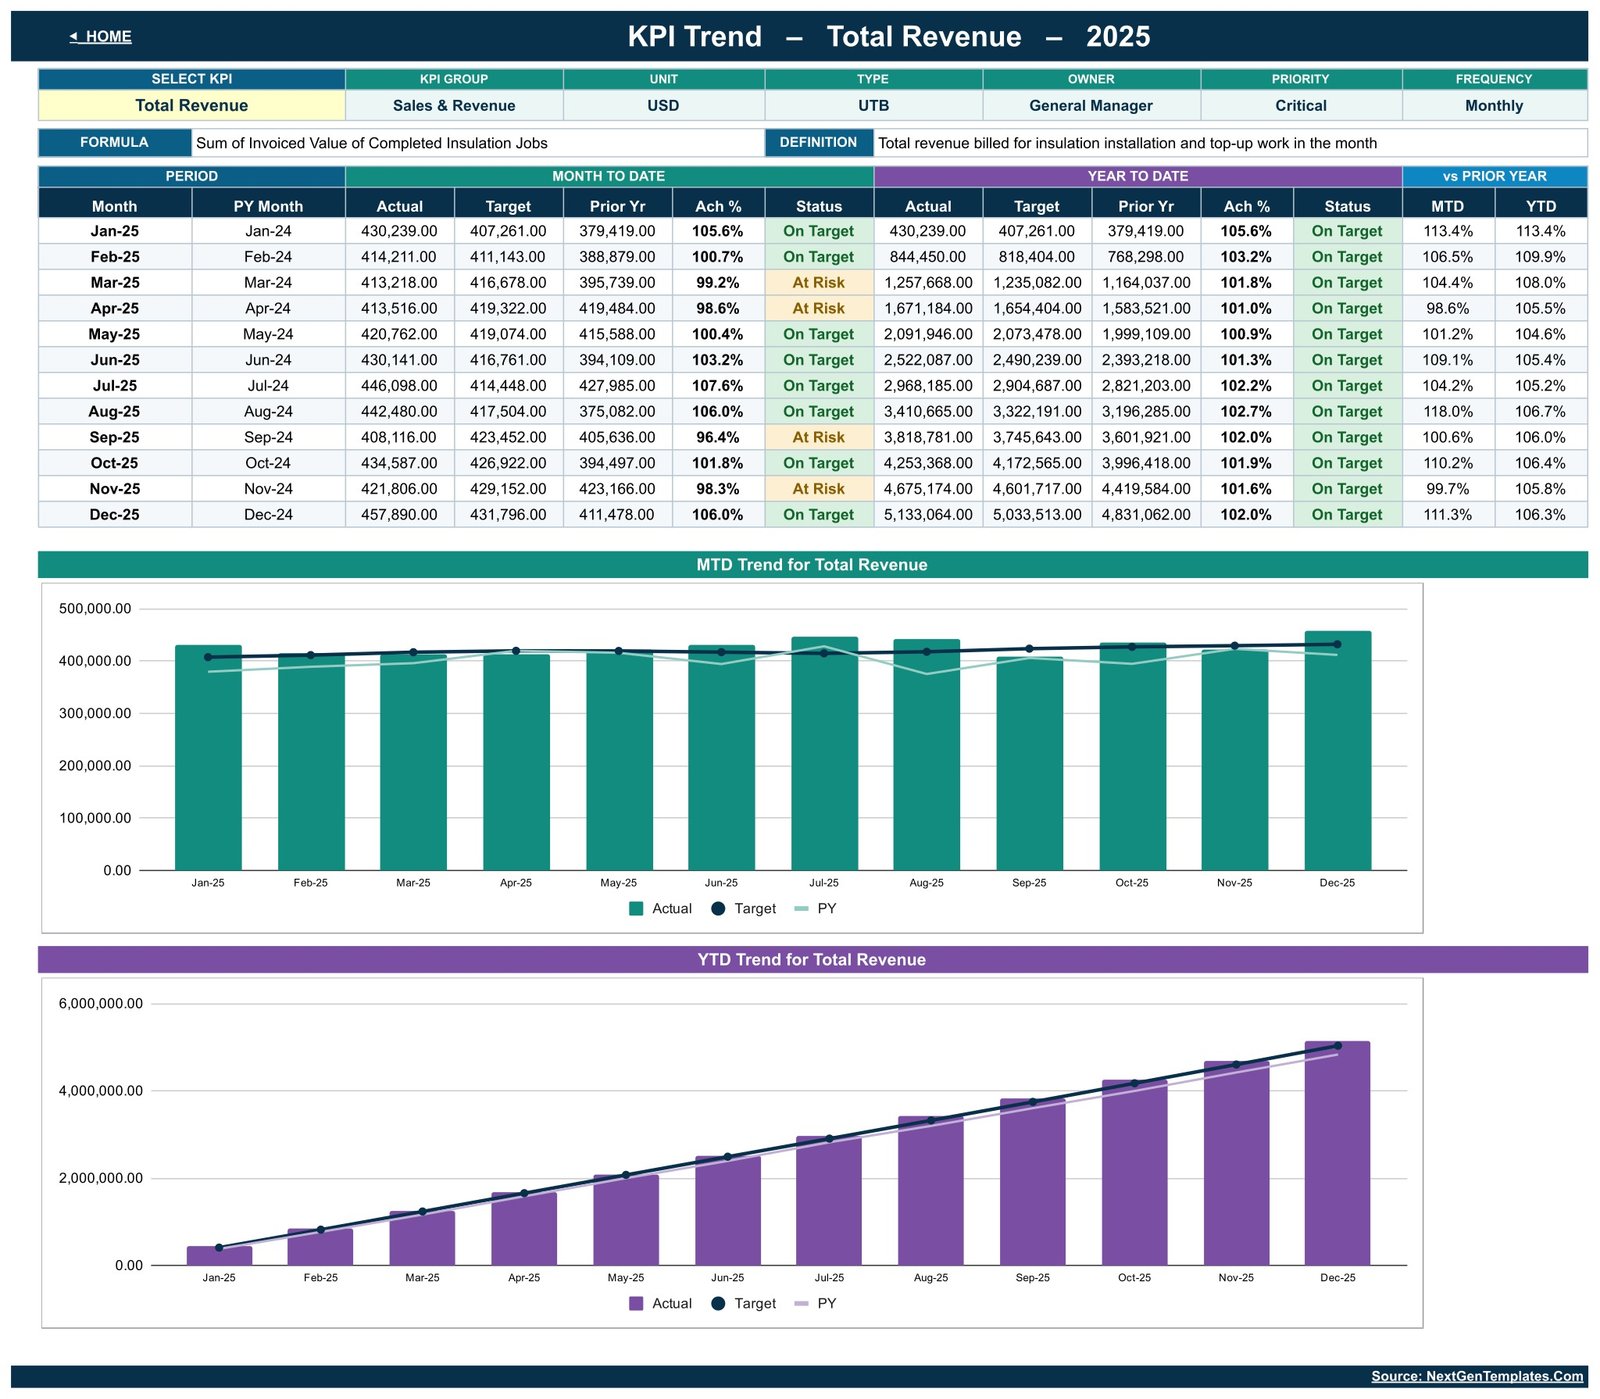
One KPI at a time, twelve months deep. A Select KPI dropdown pulls that KPI’s group, unit, type, owner, priority, frequency, formula and definition into a header strip, then a twelve-row table lists Actual, Target, Prior Yr, Achievement % and Status for both MTD and YTD, with vs Prior Year columns on the right. Two charts sit underneath: MTD Trend for Total Revenue and YTD Trend for Total Revenue, each plotting the selected metric by month against Target and PY.
Page 4: KPI Analysis
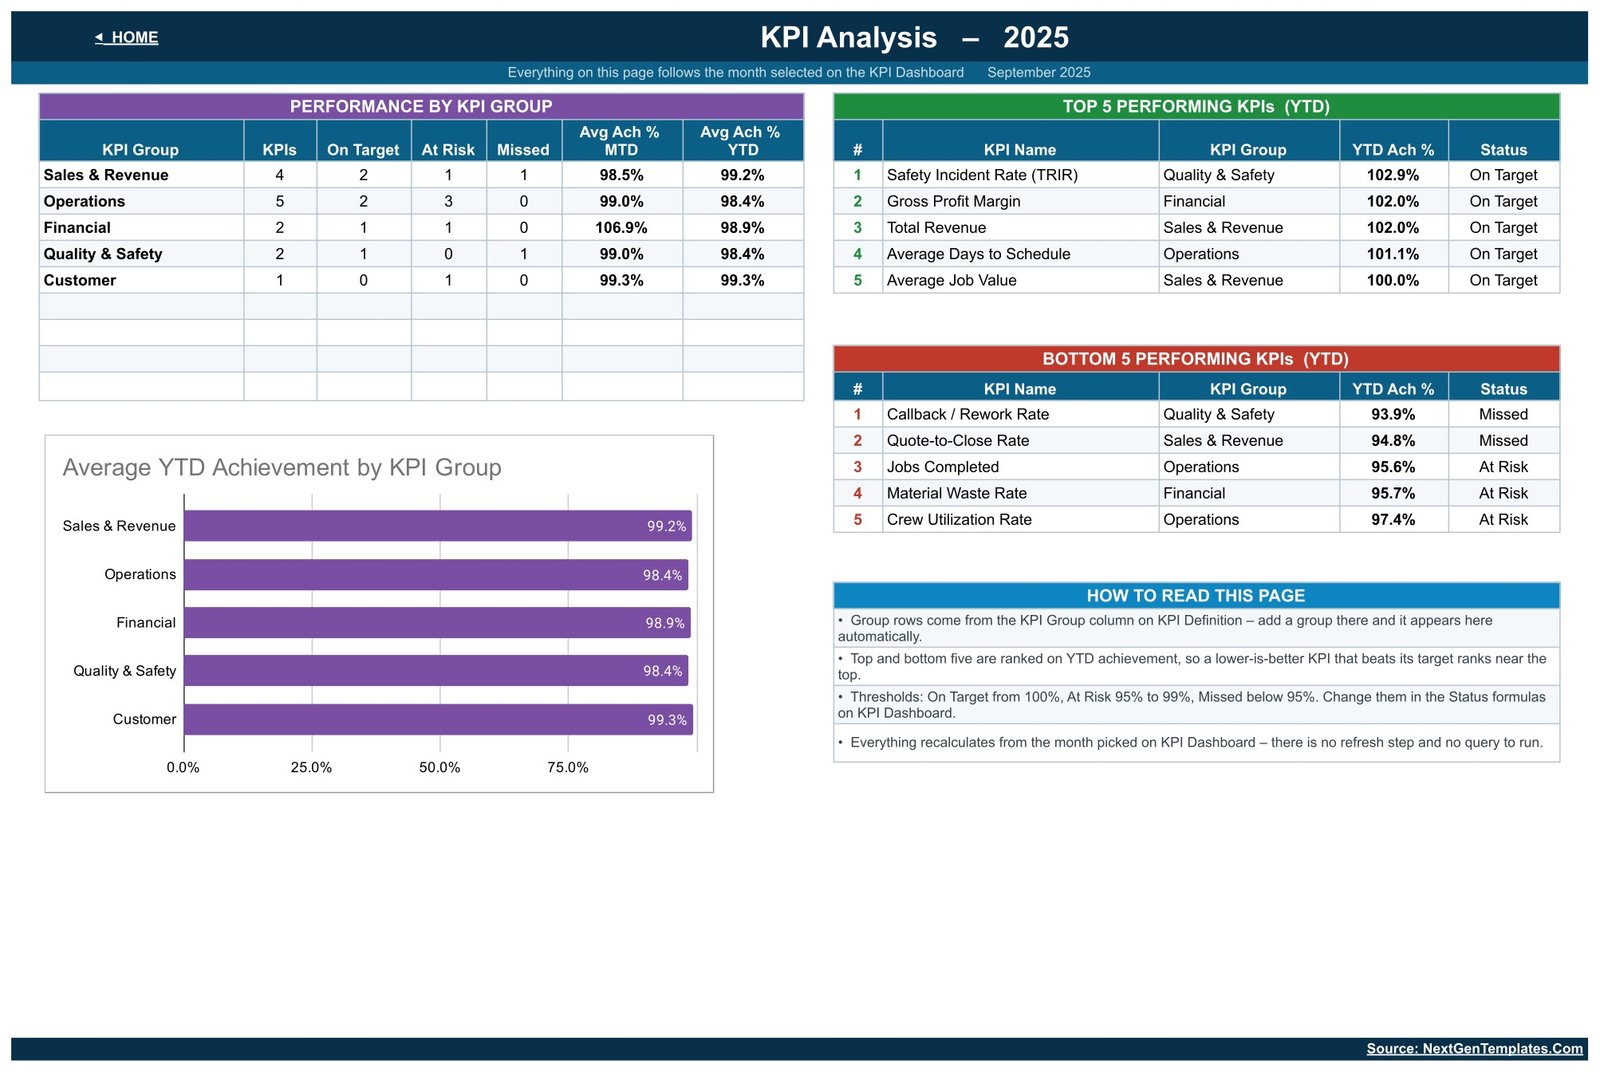
The roll-up. Performance by KPI Group counts KPIs, On Target, At Risk and Missed per group and averages MTD and YTD achievement. Top 5 Performing KPIs (YTD) and Bottom 5 Performing KPIs (YTD) rank every metric by YTD achievement, and the chart Average YTD Achievement by KPI Group compares the five groups side by side. A How To Read This Page panel explains the ranking and the thresholds.
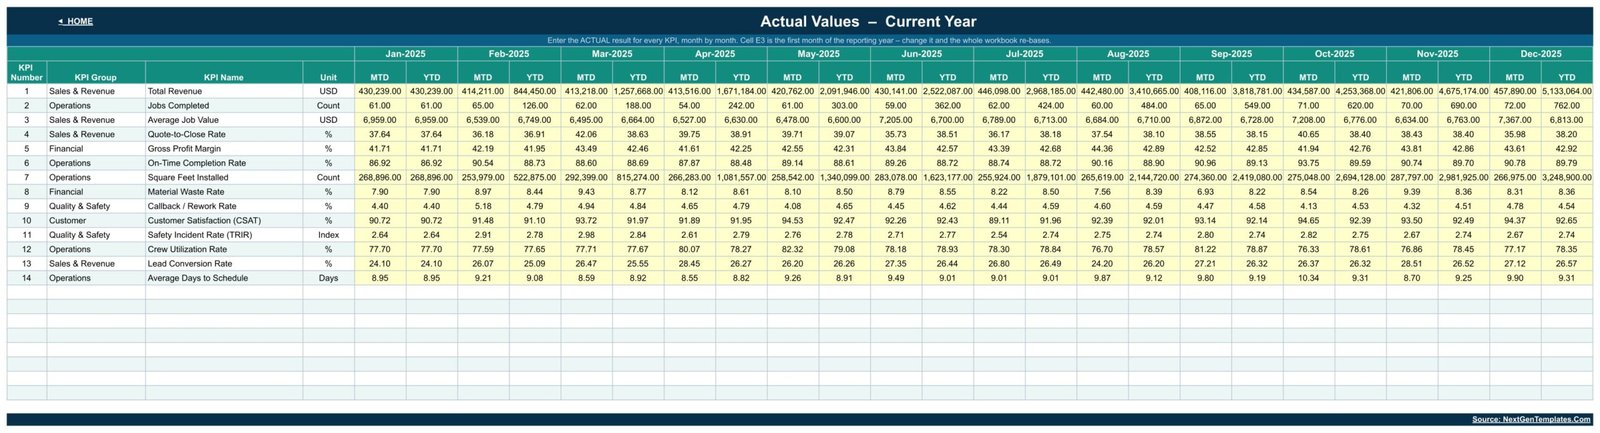
Page 5: KPI Input – Actual (Actual Values, Current Year)
Where you type. Every KPI gets a row and every month gets an MTD and a YTD column, all in editable yellow cells. Cell E3 holds the first month of the reporting year — change it and the whole workbook re-bases. Two identical sheets, KPI Input – Target and KPI Input – PY, hold this year’s targets and last year’s results.
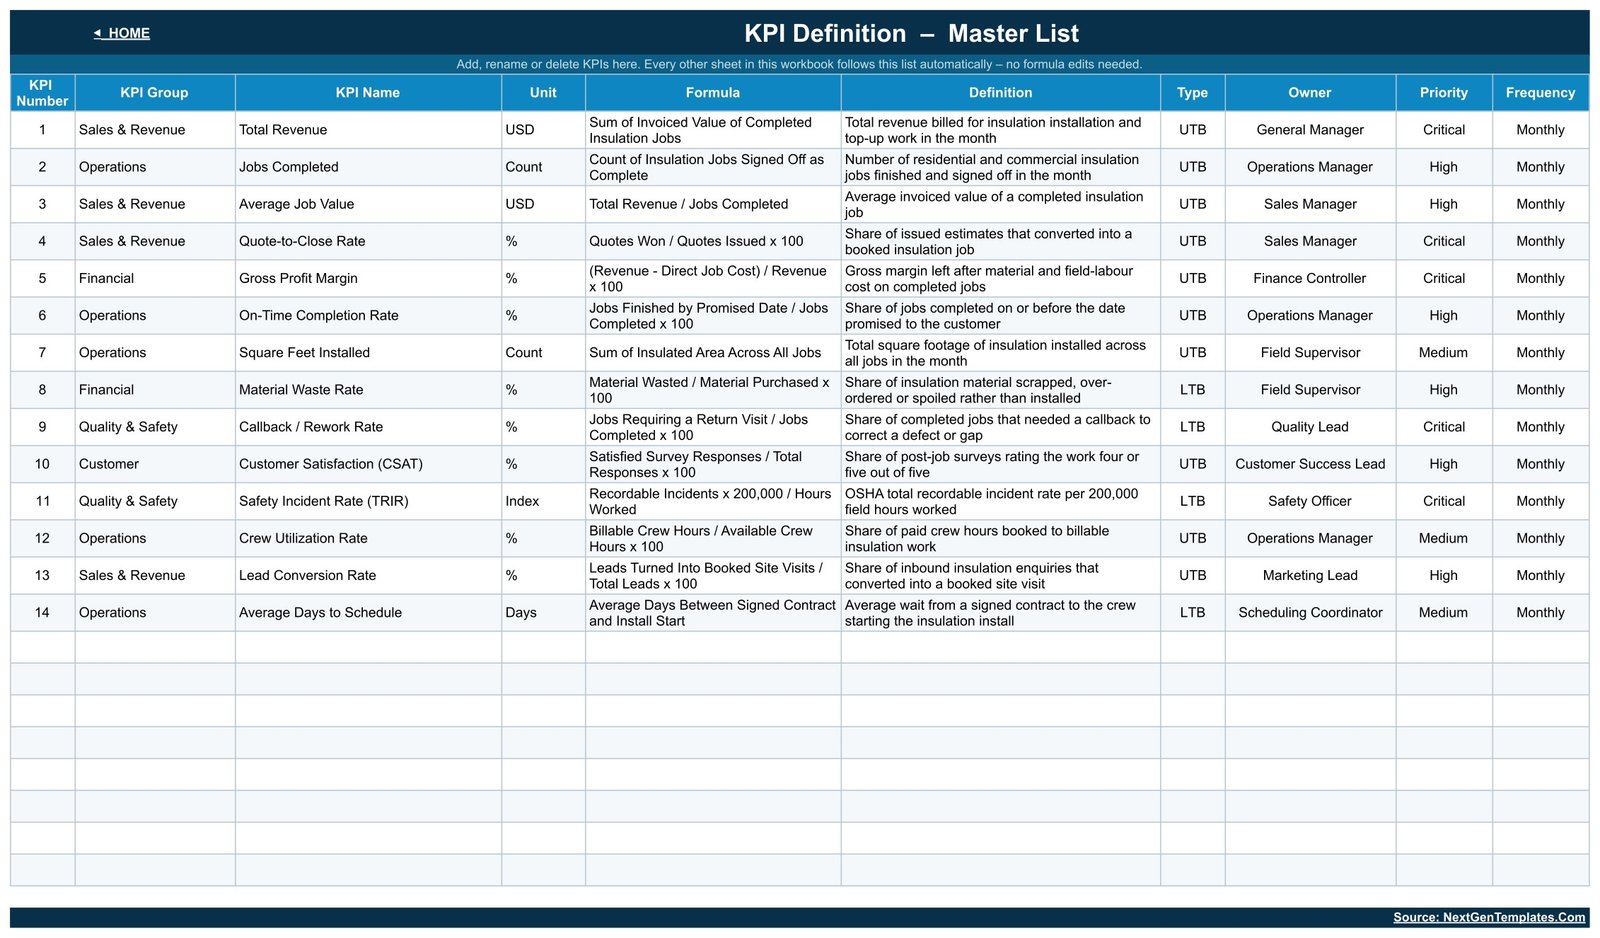
Page 6: KPI Definition – Master List
The control sheet. Each of the 14 KPIs carries its group, name, unit, calculation formula, definition, UTB/LTB type, owner, priority and frequency — for example Material Waste Rate is Material Wasted ÷ Material Purchased × 100, flagged LTB and owned by the Field Supervisor. Edit this list and every other sheet follows.
📊 Insulation Contractor KPI Dashboard in Google Sheets vs. Microsoft Excel Dashboard vs. Paid Field-Service SaaS — Where This Fits
| Feature | Insulation Contractor KPI Dashboard in Google Sheets | Microsoft Excel Dashboard | ServiceTitan / Jobber / Housecall Pro |
|---|---|---|---|
| Cost | $8.99 one-time ✅ | $12.99 one-time | $49-400 / month, often per technician |
| Platform | Google Sheets, browser only ✅ | Microsoft Excel desktop | Vendor cloud app |
| Setup time | Under 10 minutes ✅ | Under 10 minutes | Days to weeks, plus onboarding calls |
| Real-time team collaboration | Yes, native Google Sheets sharing ✅ | Only via OneDrive co-authoring | Yes |
| Mobile access | Google Sheets mobile app ✅ | Excel mobile, limited charts | Dedicated mobile app ✅ |
| Customizable KPI list | Edit the KPI Definition sheet, no code ✅ | Edit the definition sheet | Fixed metric set unless you buy a higher tier |
| Share with a link | Yes, view or edit link ✅ | File attachment or OneDrive link | Seat invite required |
| Lower-the-better KPI handling | Built in, 4 of the 14 KPIs ✅ | Built in | Varies by vendor |
| Year-1 cost at 5 users | $8.99 total ✅ | $12.99 total | $3,000-$12,000 |
| Job scheduling, dispatch, invoicing | No — reporting only | No | Yes ✅ |
For an insulation contractor who wants a monthly performance review their whole crew can open in a browser, without paying per technician for a field-service platform they only use for reports, the Insulation Contractor KPI Dashboard in Google Sheets sits in the sweet spot.
👥 Who This Template Is For — and Who It’s Not For
✅ This template is built for:
- Owners and general managers of residential or commercial insulation companies running 2 to 30 crews who want a single monthly scorecard.
- Operations and field supervisors who already track jobs, square footage and callbacks somewhere and need them side by side against target and last year.
- Insulation businesses that report to a board, a franchisor or a lender and need a consistent MTD and YTD pack every month.
- Teams that live in Google Workspace and want one shared link rather than emailed spreadsheet versions.
❌ This template is NOT for:
- Anyone needing a compliance record. This is a reporting spreadsheet — it does not check building codes or energy standards, does not certify R-value or thermal performance, is not an OSHA recordkeeping system, and does not track inspections or permits.
- Contractors wanting live job scheduling, dispatch, quoting or invoicing — buy a field-service platform for that and use this alongside it.
- Teams that need the numbers pulled automatically from an accounting or CRM system. Every figure here is typed in by hand each month.
- Anyone who needs daily or per-job granularity. The workbook is built for monthly reporting.
⚙️ How to Use the Insulation Contractor KPI Dashboard in Google Sheets
- Open the PDF in your download and click the “Make a copy” link to create your own editable copy in Google Drive.
- Open the KPI Definition sheet and edit the 14 KPI rows to match how your company measures work — rename, delete or add rows and set each one’s UTB or LTB type.
- Set cell E3 on KPI Input – Actual to the first month of your reporting year. The whole workbook re-bases to it.
- Type your monthly results into the yellow cells on KPI Input – Actual, your budget on KPI Input – Target, and last year’s figures on KPI Input – PY.
- Go to the KPI Dashboard sheet and pick a month from the Select Month dropdown. Every card, achievement percentage and traffic light updates.
- Use KPI Trend to inspect a single KPI across twelve months, and KPI Analysis for the group roll-up and the top and bottom five.
- Adjust the On Target, At Risk and Missed thresholds in the Status formulas on the KPI Dashboard sheet if your bands differ.
💼 Real-World Use Cases
Marcus owns a 14-person residential insulation company in Ohio. On the first Monday of each month he types the previous month’s revenue, jobs completed, square feet installed and callback count into the input sheets, picks the month, and walks his two crew leads through the traffic-light grid. Callback / Rework Rate sitting in the Bottom 5 for two months running is what triggered his retraining session — and it cost him nothing per user.
Priya is the operations manager at a commercial insulation contractor with four crews. She uses the KPI Trend sheet to look at Crew Utilization Rate month by month against target and prior year, and shares a view-only link with the owner instead of emailing a workbook. When utilization dipped below 80% she could point at the same chart the owner was already looking at.
Dan runs a spray-foam franchise and reports upward every quarter. He keeps the KPI Analysis page open during the review call: five group rows, the average YTD achievement bar chart, and the top and bottom five. His franchisor gets the same five numbers in the same shape every quarter, which ended the argument about whose spreadsheet was right.
❓ Frequently Asked Questions
What KPIs does the Insulation Contractor KPI Dashboard in Google Sheets track?
It tracks 14 KPIs: Total Revenue, Jobs Completed, Average Job Value, Quote-to-Close Rate, Gross Profit Margin, On-Time Completion Rate, Square Feet Installed, Material Waste Rate, Callback / Rework Rate, Customer Satisfaction (CSAT), Safety Incident Rate (TRIR), Crew Utilization Rate, Lead Conversion Rate and Average Days to Schedule.
How does it handle KPIs where a lower number is better?
Four of the 14 KPIs are flagged LTB — Material Waste Rate, Callback / Rework Rate, Safety Incident Rate (TRIR) and Average Days to Schedule. For those, achievement is Target ÷ Actual instead of Actual ÷ Target, so beating a cost or cycle-time target scores above 100% and lights up green.
Does this template help with building codes, R-value or OSHA compliance?
No. The Insulation Contractor KPI Dashboard in Google Sheets is a reporting spreadsheet only. It performs no code or energy-standard checking, certifies no thermal performance, and is not an OSHA recordkeeping system. The TRIR figure is a number you type in yourself and it evidences nothing on its own.
How is this different from the Insulation Contractor KPI Scorecard?
They are two different templates. This is the KPI Dashboard family: a month picker, a 14-row traffic-light grid, MTD and YTD side by side, and separate KPI Trend and KPI Analysis pages fed by three input sheets. The Insulation Contractor KPI Scorecard in Google Sheets is a simpler, flatter scorecard layout.
How long does setup take?
Under 10 minutes to open the copy and pick a month with the sample data in place. Loading a full year of your own actuals, targets and prior-year figures into the three input sheets typically takes 30 to 60 minutes the first time, then a few minutes each month.
How does it compare to ServiceTitan or Jobber?
Those are field-service platforms that schedule, dispatch and invoice, priced from roughly $49 to $400 a month and often per technician. The Insulation Contractor KPI Dashboard in Google Sheets does none of that — it is an $8.99 one-time monthly reporting layer you can run alongside them or on its own.
Can I change the KPIs to match my own company?
Yes. The KPI Definition sheet is the master list. Rename, delete or add KPI rows there and set each one’s unit, formula, UTB or LTB type, owner, priority and frequency. The KPI Dashboard, KPI Trend and KPI Analysis sheets all follow that list automatically with no formula edits.
👤 About the Author
Built by PK — Microsoft Certified Professional with 15+ years of Excel, Google Sheets, and Power BI experience. Founder of NextGenTemplates, reaching 300K+ subscribers across YouTube channels (@PK-AnExcelExpert, @NextGenTemplates, @NeoTechNavigators). Every template is hand-built and tested before release.
🔗 Explore Related Templates
Also available as: the same 14-KPI dashboard is built for two other tools — the Insulation Contractor KPI Dashboard in Excel for teams working offline in Microsoft Excel, and the Insulation Contractor KPI Dashboard in Power BI for anyone already publishing to a Power BI workspace.
Different template, same trade: the Insulation Contractor KPI Scorecard in Google Sheets and the Insulation Contractor KPI Scorecard in Excel are the flatter scorecard layout rather than this month-picker dashboard — pick one or the other, not both.
Neighbouring trades: the Drywall Contractor KPI Dashboard in Google Sheets and the Masonry Contractor KPI Dashboard in Google Sheets use the same engine with trade-specific KPIs — useful if you run more than one crew type. Browse the full range of Google Sheets templates or the Google Sheets KPI Dashboards category.
📖 Click here to read the Detailed Blog Post
🎥 Visit our YouTube channel for step-by-step video tutorials
👉 YouTube.com/@NextGenTemplates
Watch the step-by-step video Demo:
📅 Last updated: September 2026
Compatibility and Requirements
- Works in Google Sheets. You need a free Google account and a web browser.
- You pick the month and the KPI from dropdowns on the KPI Dashboard and KPI Trend sheets. Google explains dropdowns in Create an in-cell dropdown list.
































Reviews
There are no reviews yet.