

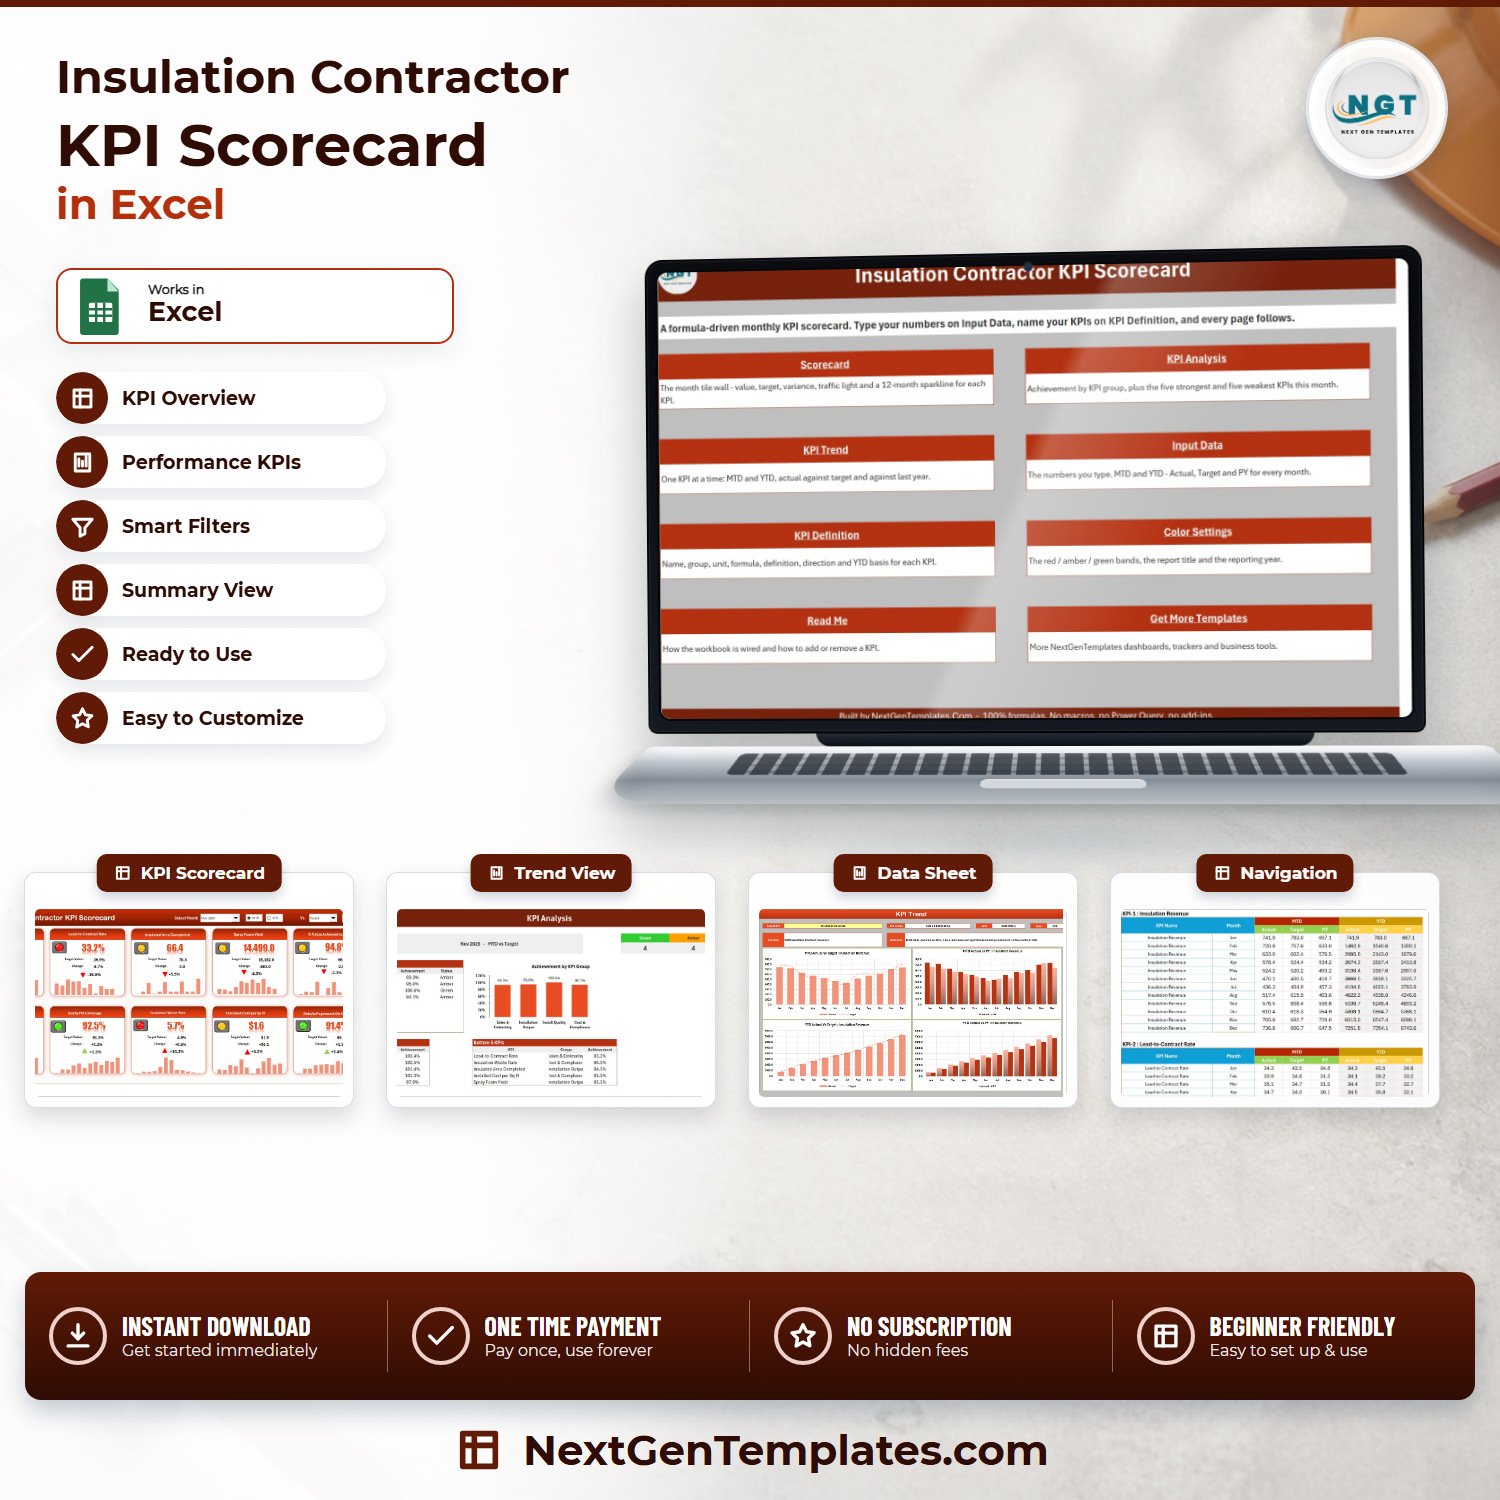


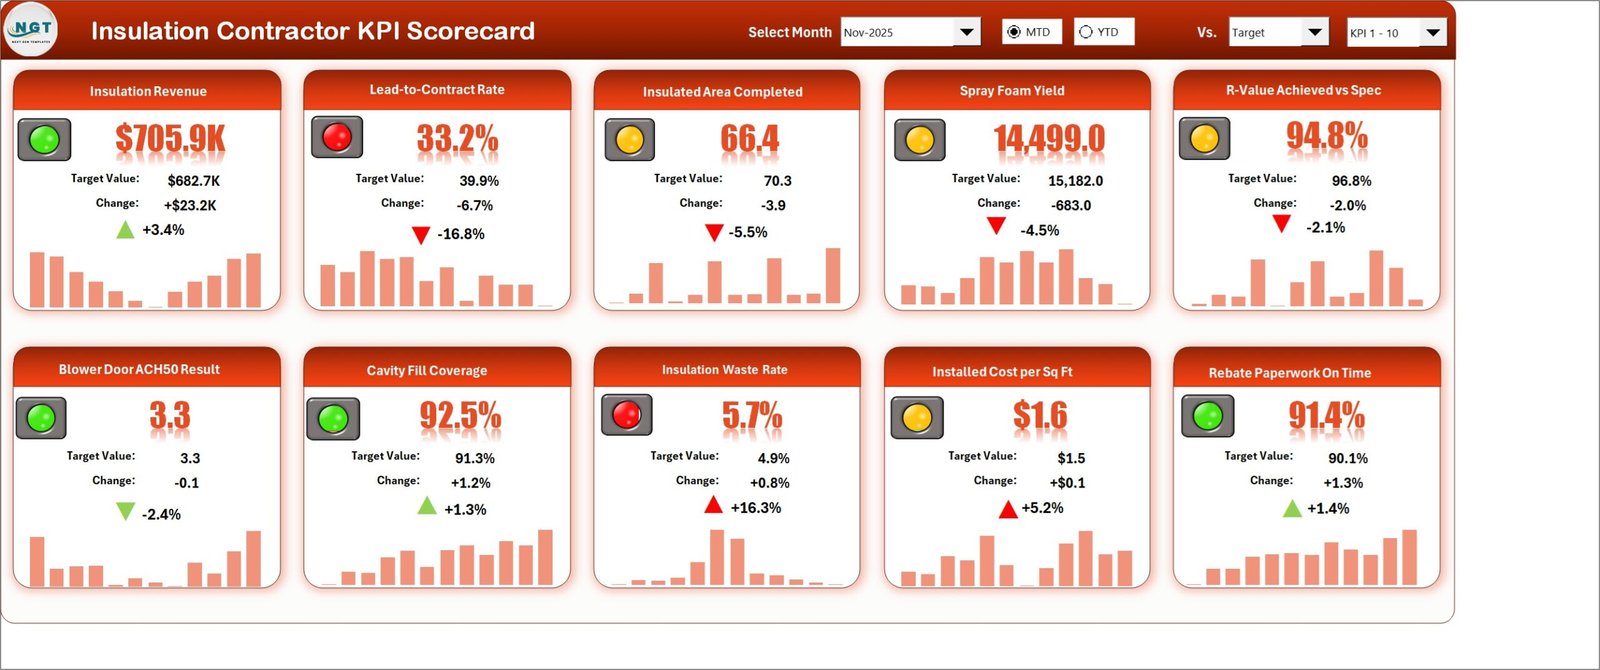
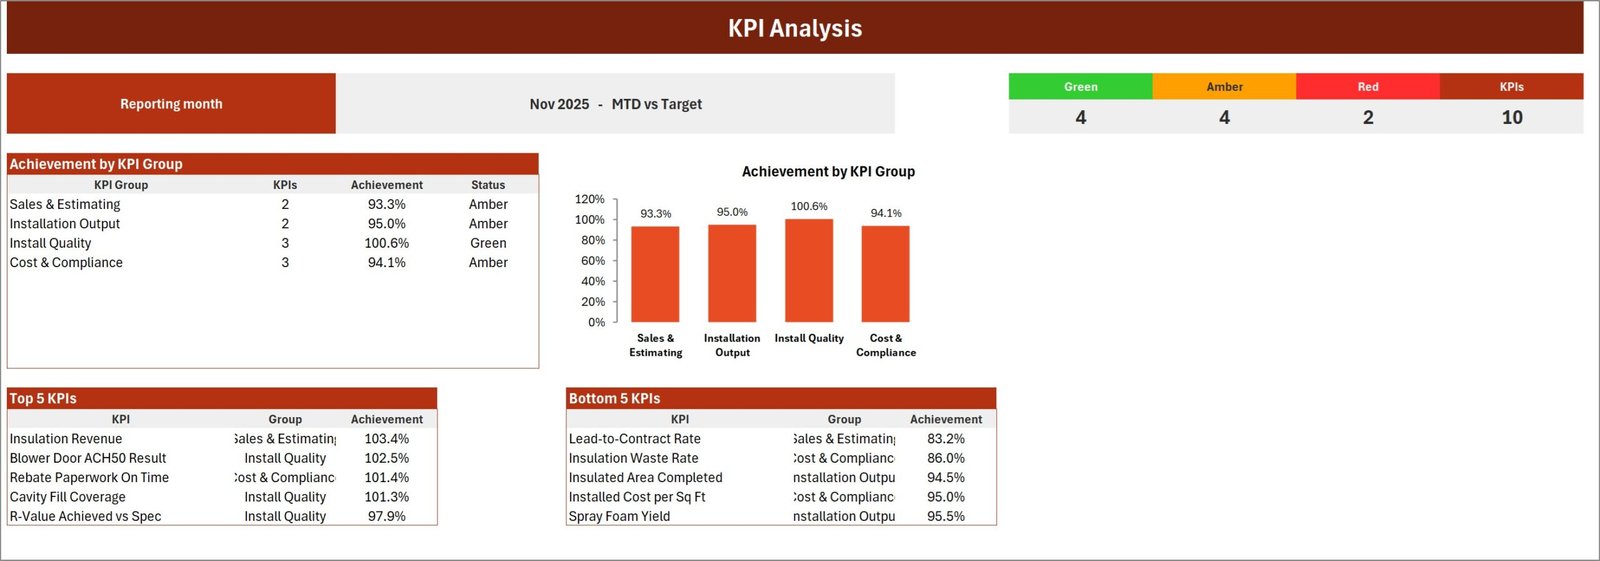
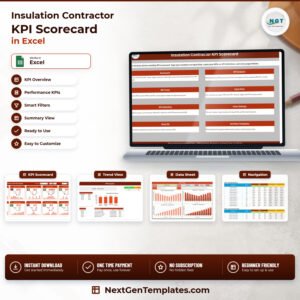
The Insulation Contractor KPI Scorecard in Excel puts ten insulation KPIs on one page with a month picker, an MTD/YTD switch and direction-aware traffic lights. The sample file ships loaded with a full 2025 year: November 2025 reads 4 Green, 4 Amber and 2 Red across four KPI groups, so you can see exactly how a real month looks before you type a single figure of your own. It is 100% formulas – no macros, no Power Query, no add-ins – and it opens on any Excel from 2016 onward. Every one of the nine sheets is shown in the gallery below, so nothing about this workbook is a surprise after checkout. Instant download, and the user manual PDF is inside the same ZIP. Insulation Contractor KPI Scorecard in Excel Insulation Contractor KPI Scorecard in Excel
Which product is this? NextGenTemplates ships three families with near-identical names. This is the KPI Scorecard line: a monthly, formula-driven tile wall built around a month picker and a KPI Definition sheet you rename. It is not the slicer-driven Excel KPI Dashboard line, and it is not an analytical Excel Dashboard built on a transaction table. If you want to compare months interactively across a large dataset, buy the dashboard. If you want a board-ready monthly scorecard you can fill in twenty minutes, this is the one. Insulation Contractor KPI Scorecard in Excel
Key Features of the Insulation Contractor KPI Scorecard in Excel
- Ten insulation KPIs in four groups – Sales & Estimating (2), Installation Output (2), Install Quality (3) and Cost & Compliance (3).
- Direction-aware traffic lights – seven KPIs are Upper-the-Better and three are Lower-the-Better, so Insulation Waste Rate, Installed Cost per Sq Ft and Blower Door ACH50 Result going up shows red, not green.
- A month picker plus an MTD / YTD toggle – and a Vs. selector that compares actual against Target, against the same period last year (PY), or against the Prior Month.
- A 12-month sparkline on every tile, alongside value, target, absolute change and percentage change.
- KPI Analysis page – Green/Amber/Red counts, achievement by KPI group as a table and a column chart, and Top 5 / Bottom 5 KPIs for the selected month.
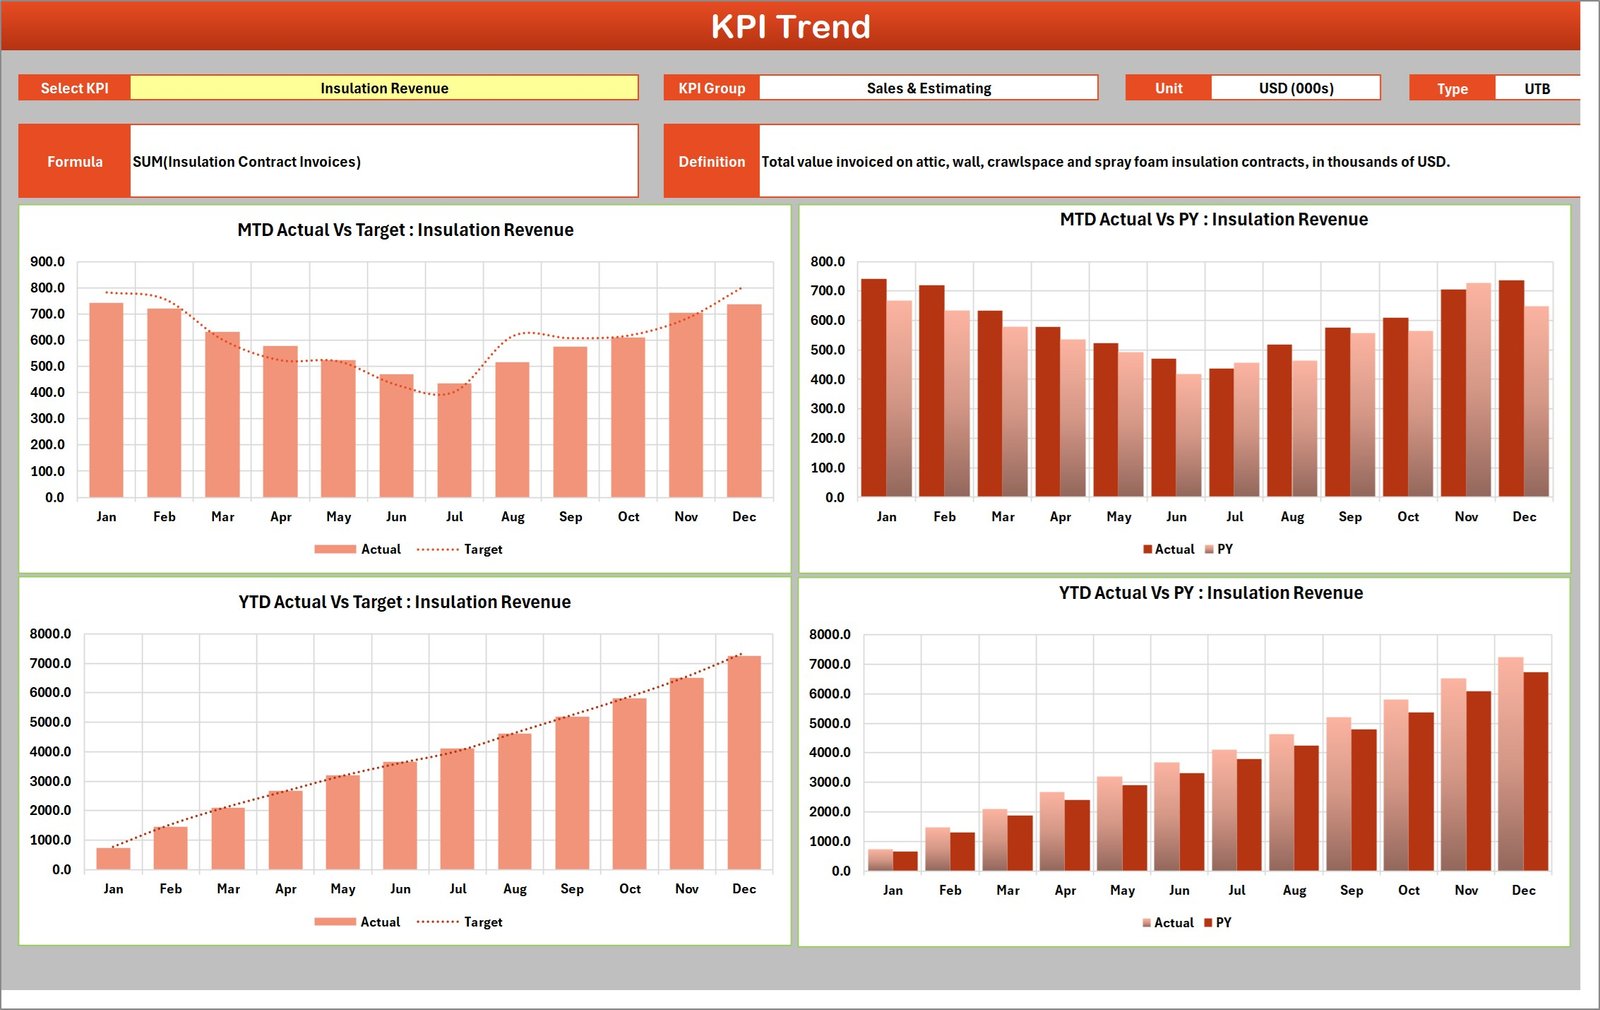
- KPI Trend page – one KPI at a time with four charts: MTD vs Target, MTD vs PY, YTD vs Target and YTD vs PY, plus that KPI’s group, unit, direction, formula and definition.
- Room for 20 KPIs – ten ship filled in; the Scorecard header has a KPI 1-10 / KPI 11-20 set picker for the rest.
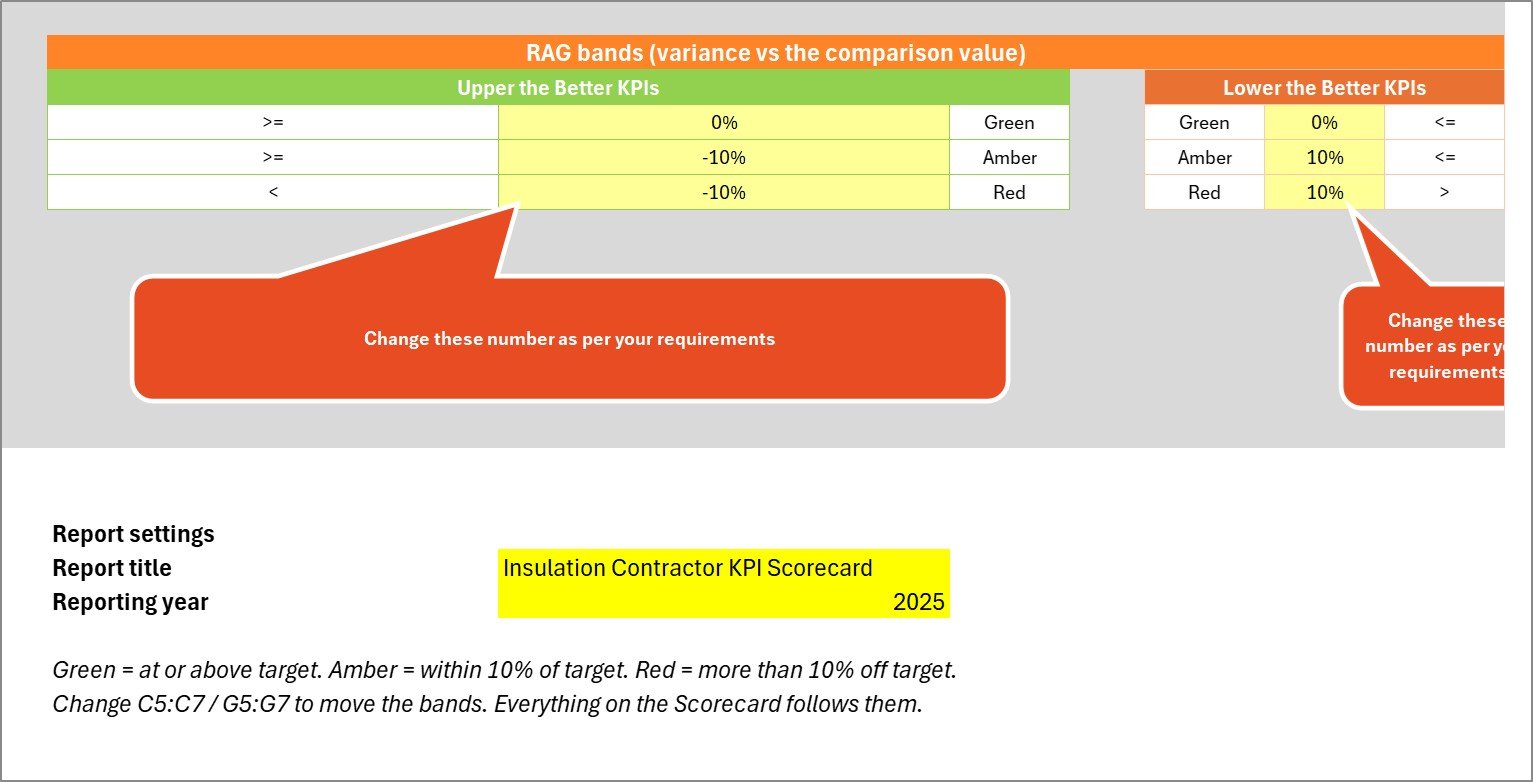
- Editable RAG bands – Green at or above target, Amber within 10%, Red more than 10% off. Change the percentages on Color Settings and every page follows.
- Rename any KPI – the whole workbook looks KPIs up by name, and a Check column turns red if you create a duplicate.
- No macros to enable – formulas, conditional formatting, camera pictures and sparklines only.
The Ten Insulation KPIs You Get Out of the Box
These are the exact metrics in the sample file, with the November 2025 figures you can see in the gallery. Rename any of them on the KPI Definition sheet and the whole workbook follows.
| KPI | Group | Unit | Direction | Nov-25 actual vs target |
|---|---|---|---|---|
| Insulation Revenue | Sales & Estimating | USD (000s) | Upper the better | 705.9 vs 682.7 – Green |
| Lead-to-Contract Rate | Sales & Estimating | % | Upper the better | 33.2 vs 39.9 – Red |
| Insulated Area Completed | Installation Output | K Sq Ft | Upper the better | 66.4 vs 70.3 – Amber |
| Spray Foam Yield | Installation Output | Bd Ft/Set | Upper the better | 14,499 vs 15,182 – Amber |
| R-Value Achieved vs Spec | Install Quality | % | Upper the better | 94.8 vs 96.8 – Amber |
| Blower Door ACH50 Result | Install Quality | ACH50 | Lower the better | 3.26 vs 3.34 – Green |
| Cavity Fill Coverage | Install Quality | % | Upper the better | 92.5 vs 91.3 – Green |
| Insulation Waste Rate | Cost & Compliance | % | Lower the better | 5.7 vs 4.9 – Red |
| Installed Cost per Sq Ft | Cost & Compliance | USD | Lower the better | 1.61 vs 1.53 – Amber |
| Rebate Paperwork On Time | Cost & Compliance | % | Upper the better | 91.4 vs 90.1 – Green |
What’s Inside the Insulation Contractor KPI Scorecard in Excel
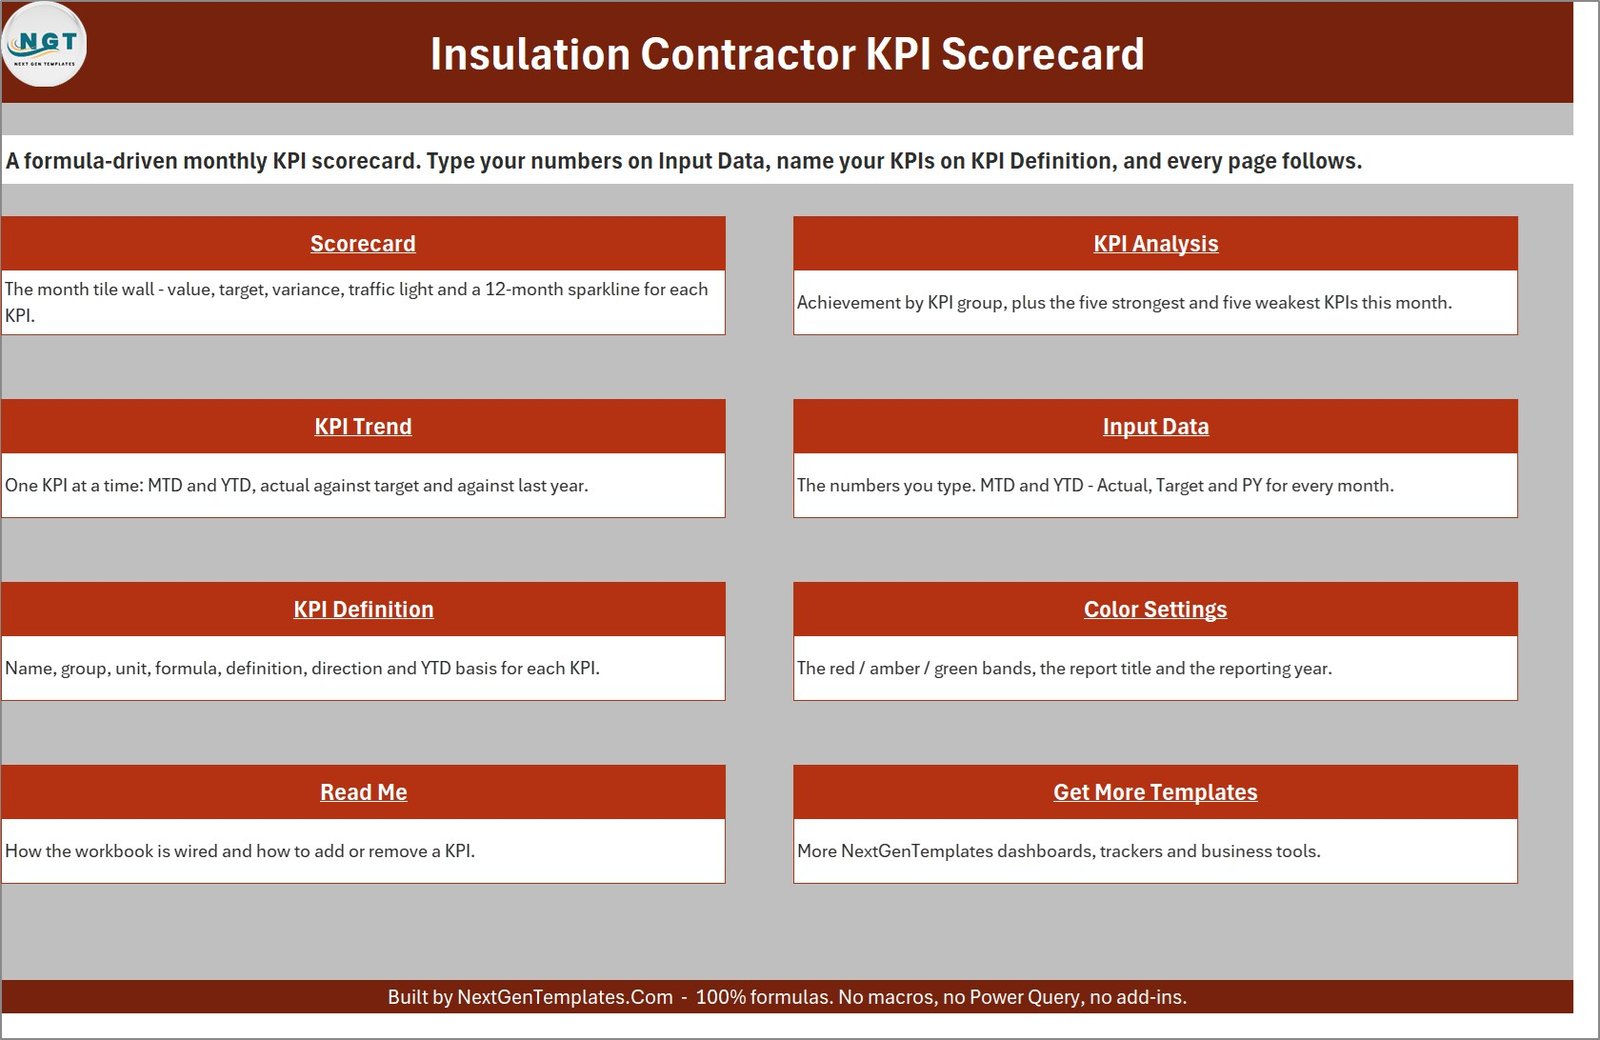
Nine sheets, and the Home page links to all of them:
- Home – eight navigation tiles, each with a one-line description of the sheet it opens.
- Scorecard – the ten-tile month wall with the header controls.
- KPI Analysis – group roll-up, RAG counts and the Top 5 / Bottom 5 tables.
- KPI Trend – the four-chart single-KPI view.
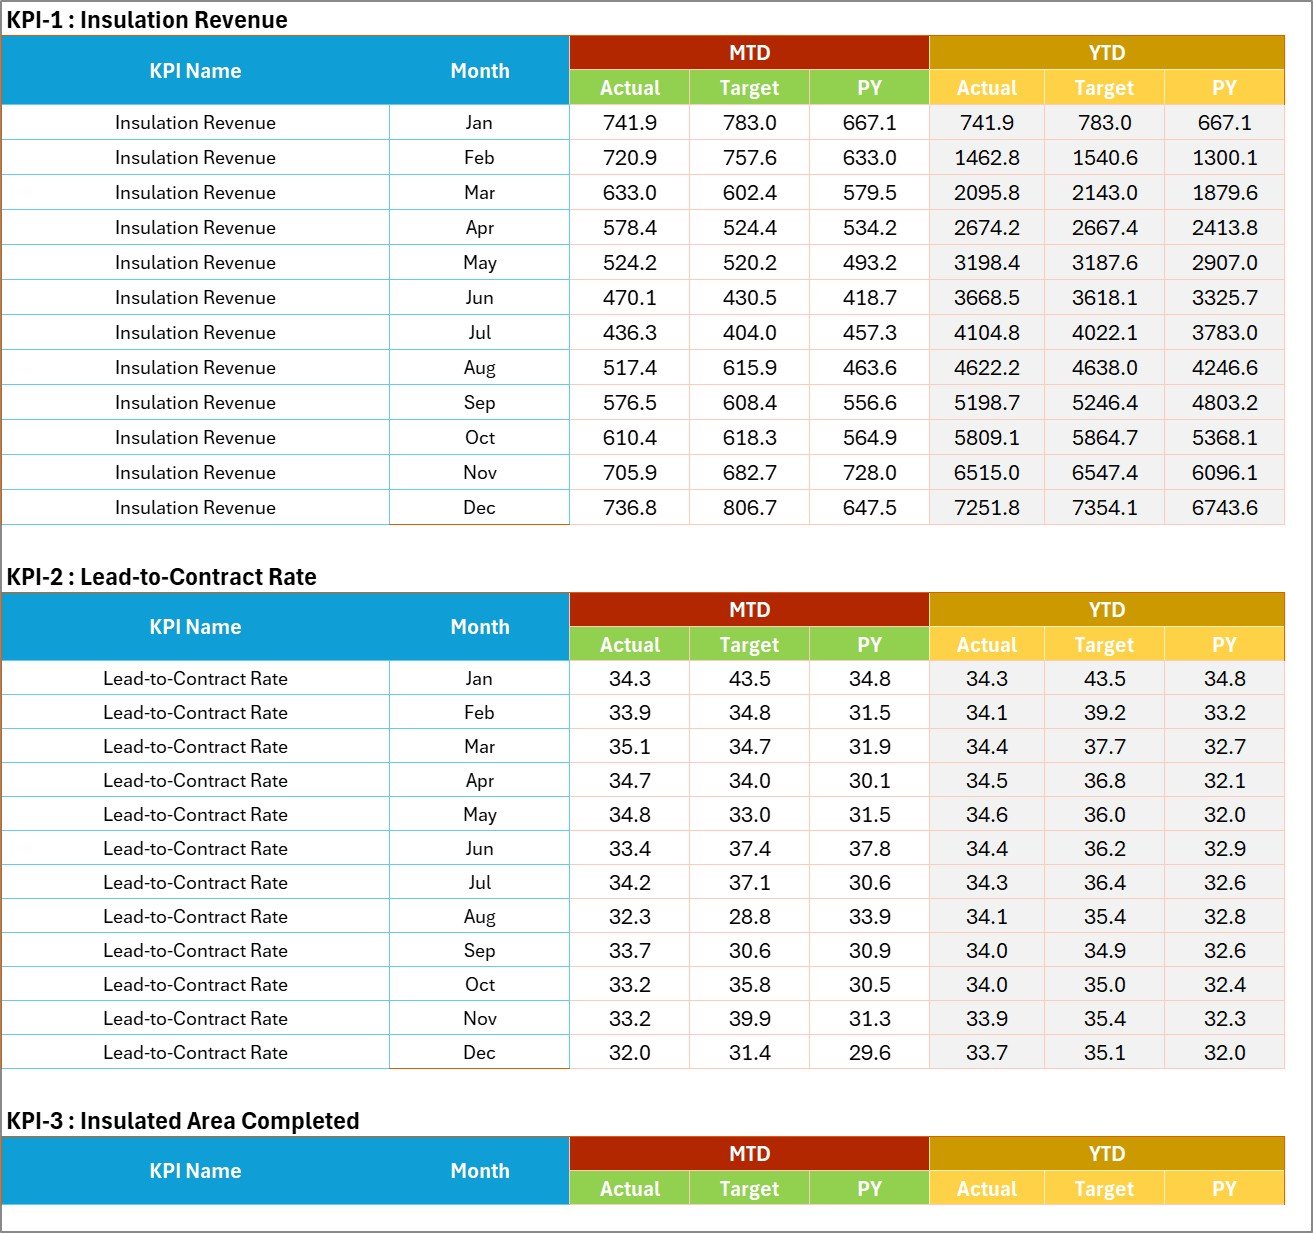
- Input Data – one numbered block per KPI, twelve rows each, with MTD Actual / Target / PY and YTD Actual / Target / PY columns.
- KPI Definition – name, group, unit, formula, definition, direction (UTB/LTB) and YTD basis for each KPI.
- Color Settings – the RAG bands, the report title and the reporting year.
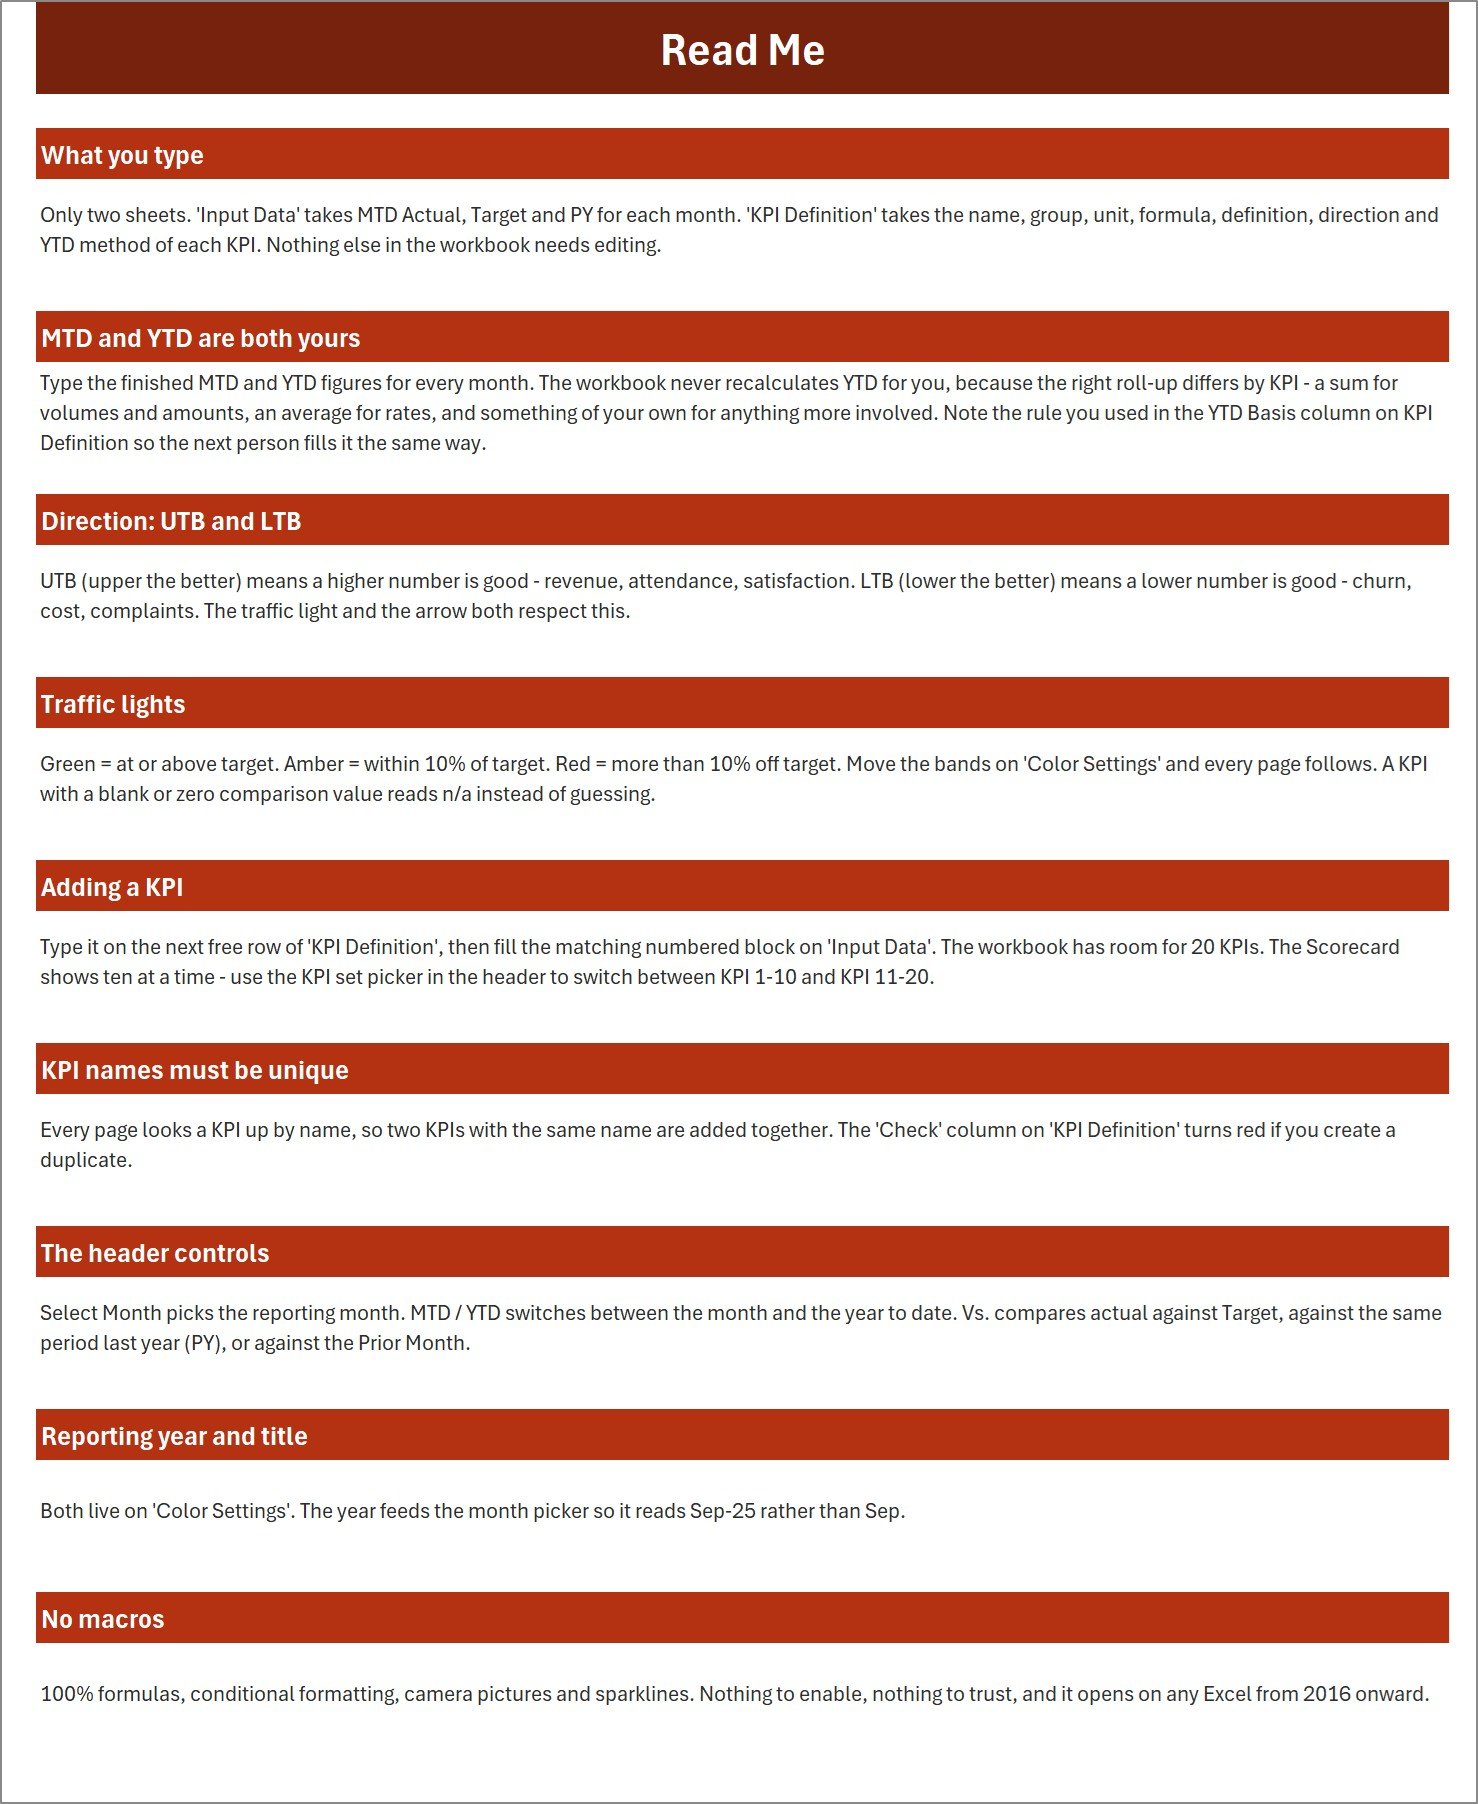
- Read Me – what you type, how UTB/LTB works, how to add a KPI.
- Get More Templates – links to the rest of the NextGenTemplates catalogue.
Excel Scorecard vs. Google Sheets vs. Paid Construction SaaS – Where This Fits Insulation Contractor KPI Scorecard in Excel
| This scorecard (Excel) | Google Sheets scorecard | Procore / Buildertrend | |
|---|---|---|---|
| Cost | $9.99 one-off | $8.99 one-off | $300+ per month, typical |
| Platform | Excel 2016+ desktop | Browser, any device | Browser and mobile app |
| Setup time | Under 30 minutes | Under 30 minutes | Weeks, with onboarding |
| Real-time team collaboration | No – single workbook | Yes | Yes |
| Mobile access | Excel mobile, read-friendly | Yes | Yes |
| Customisable KPI names | Yes – all 20 slots | Yes | Limited to the vendor’s fields |
| Share with a link | No – send the file | Yes | Yes |
| Year-1 cost at 5 users | $9.99 | $8.99 | $3,600+ |
| Pulls job costs automatically | No – you type the month’s figures | No | Yes |
| Works with no internet | Yes | No | No |
Who This Template Is For – and Who It’s Not For
It fits insulation and weatherisation contractors running 4-40 installers – attic blow-in, wall batt, crawlspace and spray foam – who already keep job figures in Excel or in an accounting package, and who need one page to take into a Monday review, a rebate-program review or a bank meeting. It fits an owner who wants Insulation Waste Rate and Installed Cost per Sq Ft sitting next to Lead-to-Contract Rate and Blower Door ACH50 Result, month after month, in the same shape. Insulation Contractor KPI Scorecard in Excel
It does not fit if you want the numbers to arrive on their own. This workbook has no connector to Buildertrend, Procore, Knowify, QuickBooks, a utility rebate portal or any energy-modelling package – you type the month’s figures on Input Data. It also does not recalculate YTD for you: you supply YTD as well as MTD, because the right roll-up is a sum for revenue and insulated area but an average for rates like R-Value Achieved vs Spec. It is not an estimating, takeoff or job-costing tool, it does not perform an energy model or a Manual J, it sends no emails or alerts, and it is not a rebate-submission system – Rebate Paperwork On Time here is a percentage you type, not a filing. Insulation Contractor KPI Scorecard in Excel
How to Use the Insulation Contractor KPI Scorecard in Excel
- Unzip and open the .xlsx. Nothing to enable – there are no macros.
- On Color Settings, set the report title and the reporting year, and adjust the Amber/Red bands if 10% is not your tolerance.
- On KPI Definition, rename the ten KPIs to your own, and set Unit, Type (UTB or LTB) and YTD Basis for each. Add more on the free rows, up to 20.
- On Input Data, fill the numbered block for each KPI – twelve months of MTD and YTD Actual, Target and PY.
- Go to Scorecard, pick your month, choose MTD or YTD and pick your comparison. Every tile, light and sparkline updates.
- Use KPI Analysis for the group roll-up and KPI Trend for the single-KPI story before you present.
Real-World Use Cases
Ray, owner of a 14-installer insulation crew in Ohio. His foam sets were running short and nobody could say by how much. He now shows the Spray Foam Yield tile – 14,499 board feet per set against a 15,182 target, amber – with twelve months of sparkline behind it, and orders material against a number instead of a hunch.
Alicia, operations manager for a weatherisation firm. Her Monday pack was five screenshots. She now sends one Scorecard page and one KPI Analysis page: Install Quality is the only green group at 100.6%, Sales & Estimating the weakest at 93.3%, and the meeting starts at the problem rather than at the agenda.
Dev, an estimator watching assessments stop converting. Lead-to-Contract Rate at 33.2% against a 39.9% target, sitting bottom of the Bottom 5 table at 83.2% achievement, made the case for reworking the home-assessment follow-up that nothing else had. Insulation Contractor KPI Scorecard in Excel
Frequently Asked Questions
Does this connect to Buildertrend, Procore, Knowify or QuickBooks?
No. There is no connector, no import and no API. You type each month’s figures on the Input Data sheet. That is deliberate – it is what keeps the file to a few hundred KB and macro-free.
Are macros required?
No. The workbook is 100% formulas, conditional formatting, camera pictures and sparklines. There is no security prompt to clear and no .xlsm to whitelist.
Can I change the KPI names to my own?
Yes – all of them. Every page looks a KPI up by name, so renaming on KPI Definition flows through the Scorecard, KPI Analysis and KPI Trend automatically. A Check column warns you if two KPIs end up with the same name.
Does it handle Lower-the-Better metrics properly?
Yes, and that is the point of the Type column. Blower Door ACH50 Result, Insulation Waste Rate and Installed Cost per Sq Ft are all set to LTB, so beating the target downward shows green with a green down arrow, and drifting upward shows red – the opposite of how the seven Upper-the-Better KPIs behave.
Does it calculate year-to-date for me?
No, and the Read Me says so plainly. You type YTD alongside MTD, because the correct roll-up differs by KPI – a sum for Insulation Revenue and Insulated Area Completed, an average for rates like Cavity Fill Coverage. Record the rule you used in the YTD Basis column. Insulation Contractor KPI Scorecard in Excel
How many KPIs can it hold?
Twenty. Ten ship filled in with insulation metrics; the Scorecard shows ten at a time and the header’s KPI set picker switches between KPI 1-10 and KPI 11-20.
Is this the same as your Excel KPI Dashboard?
No. The Excel KPI Dashboard line is slicer-driven and built for interactive analysis across a dataset. This scorecard is a monthly reporting page driven by a month picker. Many contractors own both; they answer different questions.
Does it prove compliance with a utility rebate program?
No. Rebate Paperwork On Time is one of the ten KPIs, and it is a percentage you calculate and type. The workbook lodges nothing, keeps no customer records, holds no homeowner data and satisfies no program requirement.
About the Author
Built by PK – Microsoft Certified Professional with 15+ years of Excel, Google Sheets, and Power BI experience. Founder of NextGenTemplates, reaching 300K+ subscribers across YouTube channels. Every template is hand-built and tested before release.
Explore Related Templates
Same scorecard, other trades: Drywall Contractor KPI Scorecard in Excel, Carpentry Workshop KPI Scorecard in Excel, Masonry Contractor KPI Scorecard in Excel, HVAC Contractor KPI Scorecard in Excel and Roofing Contractor KPI Scorecard in Excel. Step up to the interactive line with the Excel KPI Dashboard family, or browse every KPI Dashboard template and the full MS Excel catalogue. A Concrete Contractor KPI Scorecard in Excel is being prepared alongside this one and is not on sale yet.
Prefer Google Sheets? The identical scorecard – same ten insulation KPIs, same four groups, same RAG logic – is being released as the Insulation Contractor KPI Scorecard in Google Sheets, a browser-based edition you can share with a link. It goes on sale at the same time as this Excel edition; if you want the shareable version, look for it under the same name in the Google Sheets catalogue.
Buy once, own it forever. Instant download, the user manual PDF included in the ZIP, and free bug fixes to this file. Questions before you buy? Email [email protected]. Insulation Contractor KPI Scorecard in Excel
Last updated: 31 August 2026.
Watch the demo video:
Compatibility and Requirements
- Works in Microsoft Excel desktop (Excel 2016 or later, or Microsoft 365).
- The workbook uses formulas, conditional formatting, camera pictures and sparklines only, so there are no macros to enable.
- The Scorecard uses conditional formatting for its traffic lights. Microsoft explains the feature in Use conditional formatting to highlight information in Excel.
More Questions About This Template
Is there a Google Sheets version of this scorecard?
Yes. See the Insulation Contractor KPI Scorecard in Google Sheets.
Is there an interactive dashboard version for insulation contractors?
Yes. The Insulation Contractor KPI Dashboard in Excel is the dashboard edition, and there is also an Insulation Contractor KPI Dashboard in Power BI.
How many sheets does the workbook have?
Nine: Home, Scorecard, KPI Analysis, KPI Trend, Input Data, KPI Definition, Color Settings, Read Me and Get More Templates.
Can I change the Amber and Red bands?
Yes. Green is at or above target, Amber is within 10% and Red is more than 10% off. You can change the percentages on the Color Settings sheet and every page follows.
Related Insulation and Contractor Templates
- Insulation Contractor KPI Scorecard in Google Sheets: the same scorecard in a browser-based edition
- Insulation Contractor KPI Dashboard in Excel: the interactive dashboard line for insulation
- Insulation Contractor KPI Dashboard in Power BI: the Power BI edition
- Insulation Contractor KPI Dashboard in Google Sheets: the dashboard in Google Sheets
- KPI Dashboard Library (Excel): 15 KPI templates in one download
Browse all Excel KPI dashboards.
































Reviews
There are no reviews yet.