

The Construction KPI Dashboard in Power BI is a powerful and interactive tool designed to help construction managers, project supervisors, and stakeholders track and optimize key performance indicators (KPIs) throughout the construction process. This customizable dashboard provides real-time insights into critical aspects of construction projects, such as project costs, timelines, safety performance, labor efficiency, and material usage.
By using this Construction KPI Dashboard in Power BI, construction teams can effectively monitor and manage various project metrics, ensuring that projects are completed on time, within budget, and with the required quality standards. Whether you’re overseeing a small project or managing multiple large-scale projects, this dashboard offers the flexibility and tools you need to optimize construction performance and achieve project success.
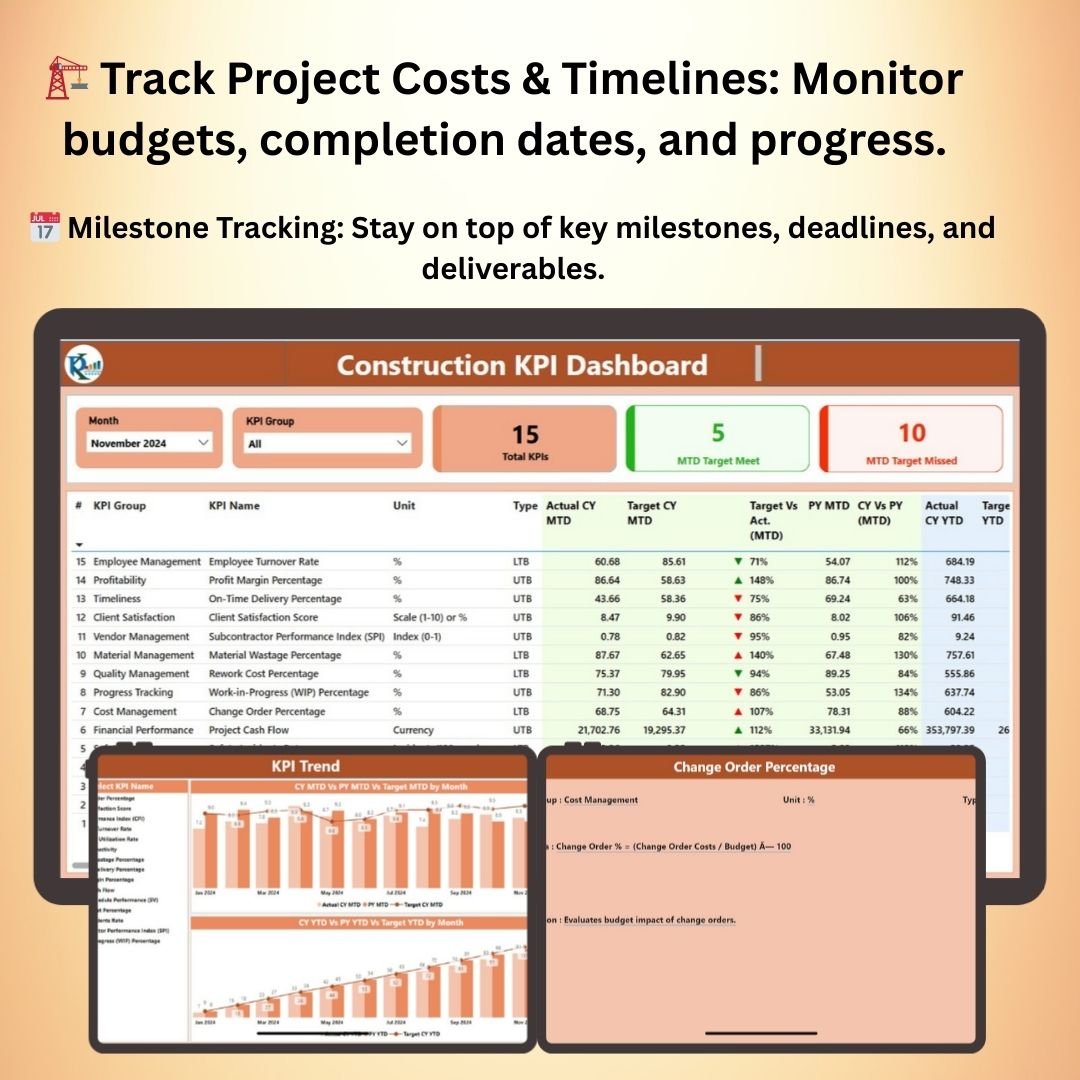
Key Features of the Construction KPI Dashboard in Power BI
🏗️ Comprehensive Construction Performance Tracking
Monitor critical KPIs such as project costs, completion timelines, labor productivity, and material usage. Get a detailed view of your project’s performance to ensure you meet deadlines and stay within budget.
⚡ Real-Time Project Monitoring
Track project progress, identify delays, and manage costs in real time. Get up-to-date data on construction timelines, labor performance, and resource utilization to make quick adjustments as needed.
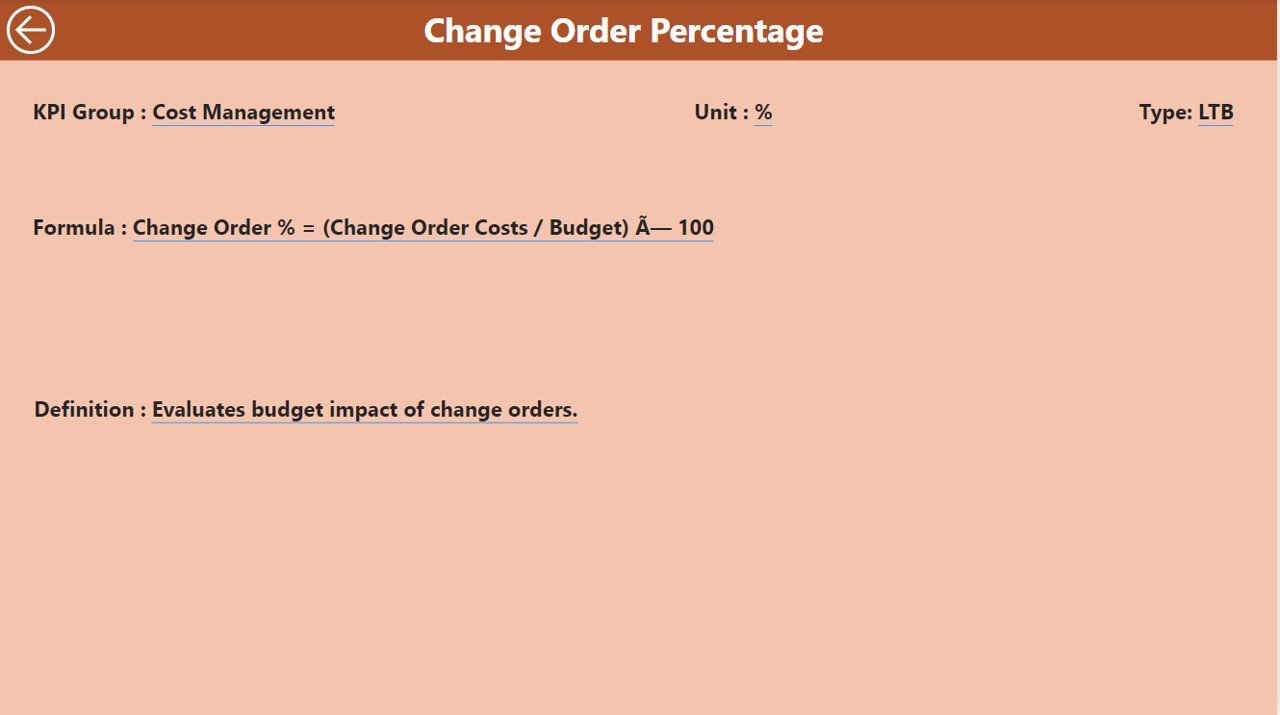
📈 Cost & Budget Management
Analyze project costs, compare actual expenses against the budget, and track cost overruns to ensure that the project stays financially viable. Identify areas where savings can be achieved without compromising on quality or safety.
📅 Timeline & Milestone Tracking
Track key project milestones, deadlines, and deliverables. Identify potential delays early and ensure that all milestones are met on time to maintain the project schedule.
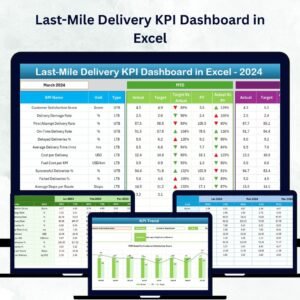
🖥️ Interactive & User-Friendly Interface
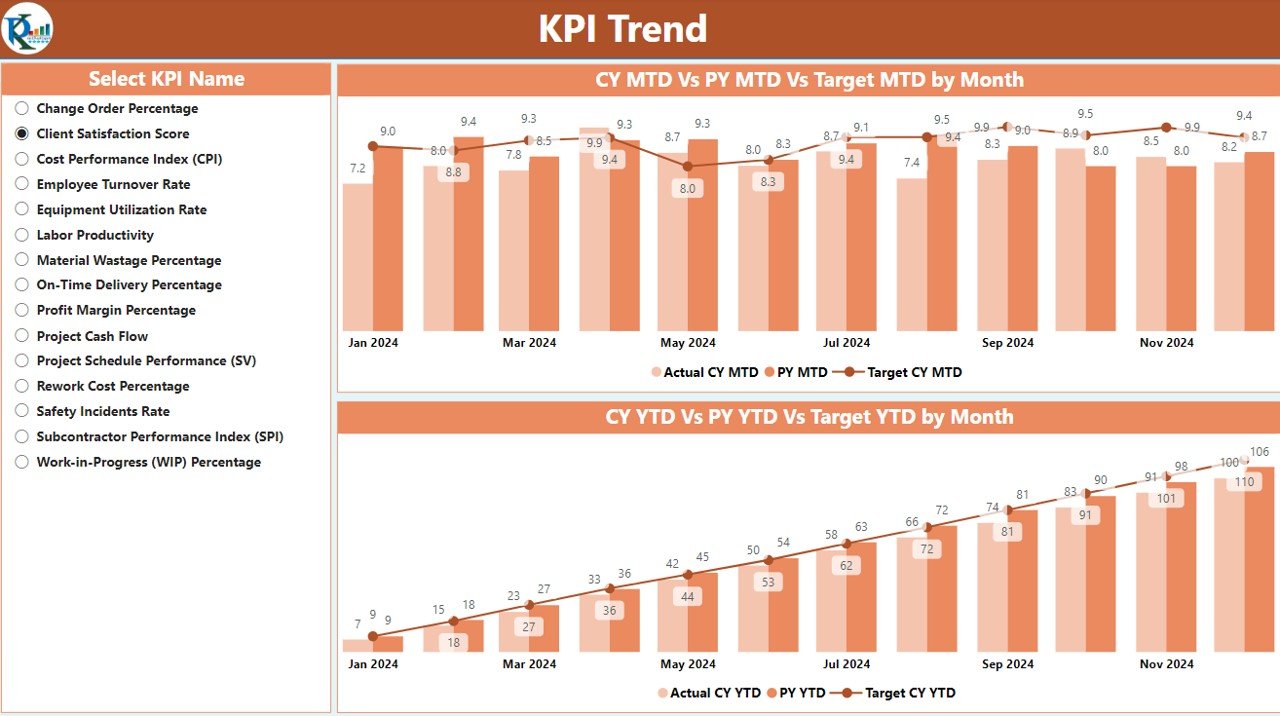
The Power BI dashboard is easy to use and provides interactive features such as dynamic charts, filters, and slicers. Quickly explore your project data and drill down into performance details to make informed decisions.
Why You’ll Love the Construction KPI Dashboard in Power BI

✅ Track Construction Progress & Performance
Monitor the progress of your construction projects, ensuring that milestones and deadlines are met. Track the status of key activities and adjust timelines as necessary to stay on track.
✅ Optimize Project Costs & Budgeting
Track costs in real time and ensure that your project remains within budget. Use insights to identify areas where costs can be reduced and resources can be better allocated.
✅ Monitor Labor Efficiency & Resource Utilization
Evaluate labor performance and track resource utilization to ensure efficient workforce management. Identify inefficiencies and optimize labor resources to improve project delivery.
✅ Ensure Safety & Compliance
Track safety performance metrics to ensure that the construction site complies with safety regulations. Minimize accidents and incidents by staying on top of safety KPIs.
✅ Make Data-Driven Construction Decisions
Leverage real-time data to make informed decisions about project timelines, costs, resources, and safety measures. Stay on top of every aspect of your construction project and drive improvements where needed.
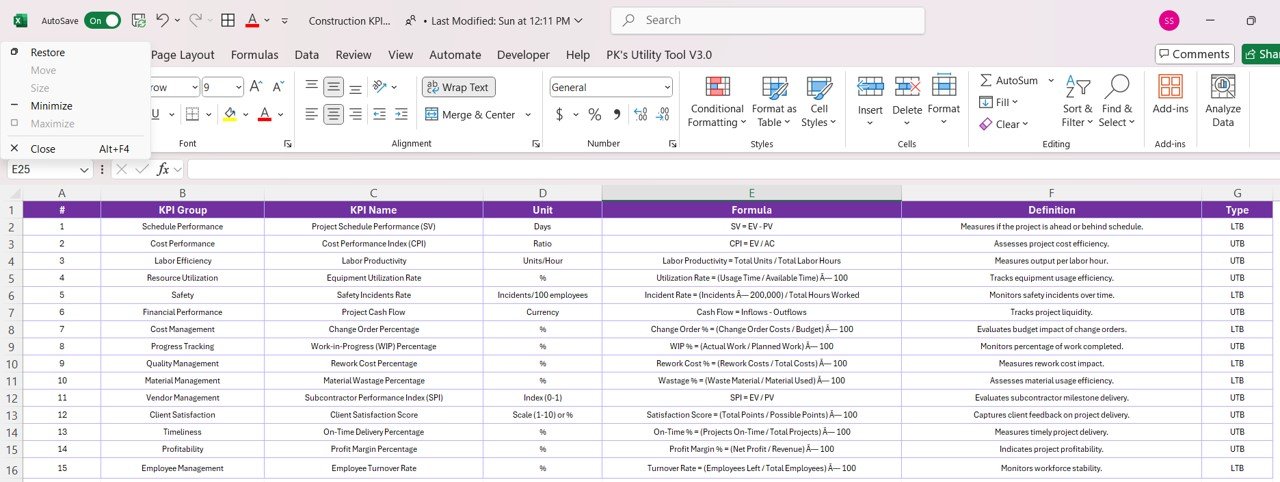
What’s Inside the Construction KPI Dashboard Template?
- Project Cost & Budget Tracking: Track actual project costs versus budgeted expenses and identify cost overruns or savings opportunities.
- Timeline & Milestone Monitoring: Monitor project milestones, delivery timelines, and key deliverables.
- Labor & Resource Utilization: Track workforce performance, labor hours, and resource utilization across multiple projects.
- Safety Performance Analysis: Monitor safety metrics, including accident rates, safety audits, and compliance with safety regulations.
- Real-Time Performance Insights: Access real-time updates on all key metrics, allowing for timely adjustments and decision-making.
- Customizable KPIs: Adjust the dashboard to track specific metrics that are most relevant to your construction projects.
How to Use the Construction KPI Dashboard in Power BI
1️⃣ Download the Template: Instantly access your Construction KPI Dashboard in Power BI.
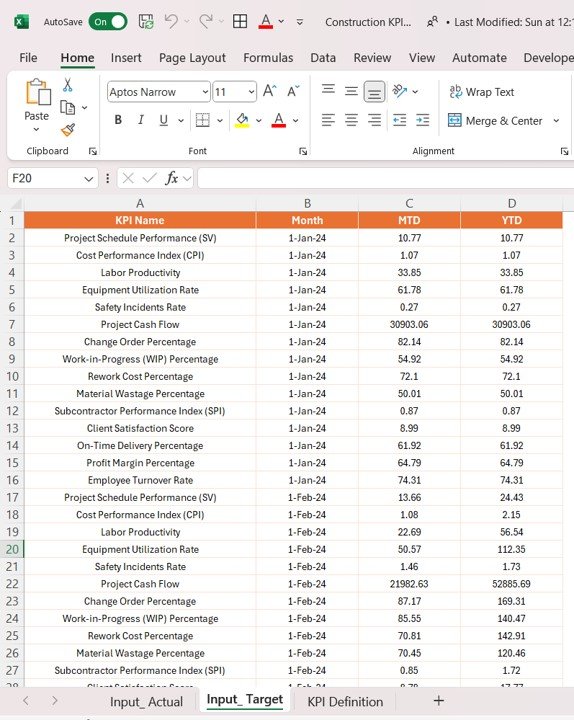
2️⃣ Input Project Data: Enter data such as project costs, timelines, labor hours, and safety metrics.
3️⃣ Track & Monitor KPIs: Use the dashboard to monitor key construction project metrics in real time.
4️⃣ Analyze & Optimize: Use insights from the dashboard to make informed decisions about project budgeting, timelines, and workforce allocation.
Who Can Benefit from the Construction KPI Dashboard in Power BI?
🔹 Construction Project Managers & Supervisors
🔹 Construction Company Owners & Stakeholders
🔹 Labor & Resource Managers
🔹 Health & Safety Officers
🔹 Business Analysts in Construction
🔹 Anyone Involved in Managing and Monitoring Construction Projects
Track, analyze, and optimize your construction projects with the Construction KPI Dashboard in Power BI. Monitor project performance, manage budgets, track labor efficiency, and ensure safety compliance to keep projects on track and improve overall construction performance.
Click here to read the Detailed blog post
Visit our YouTube channel to learn step-by-step video tutorials
Youtube.com/@PKAnExcelExpert


Reviews
There are no reviews yet.