

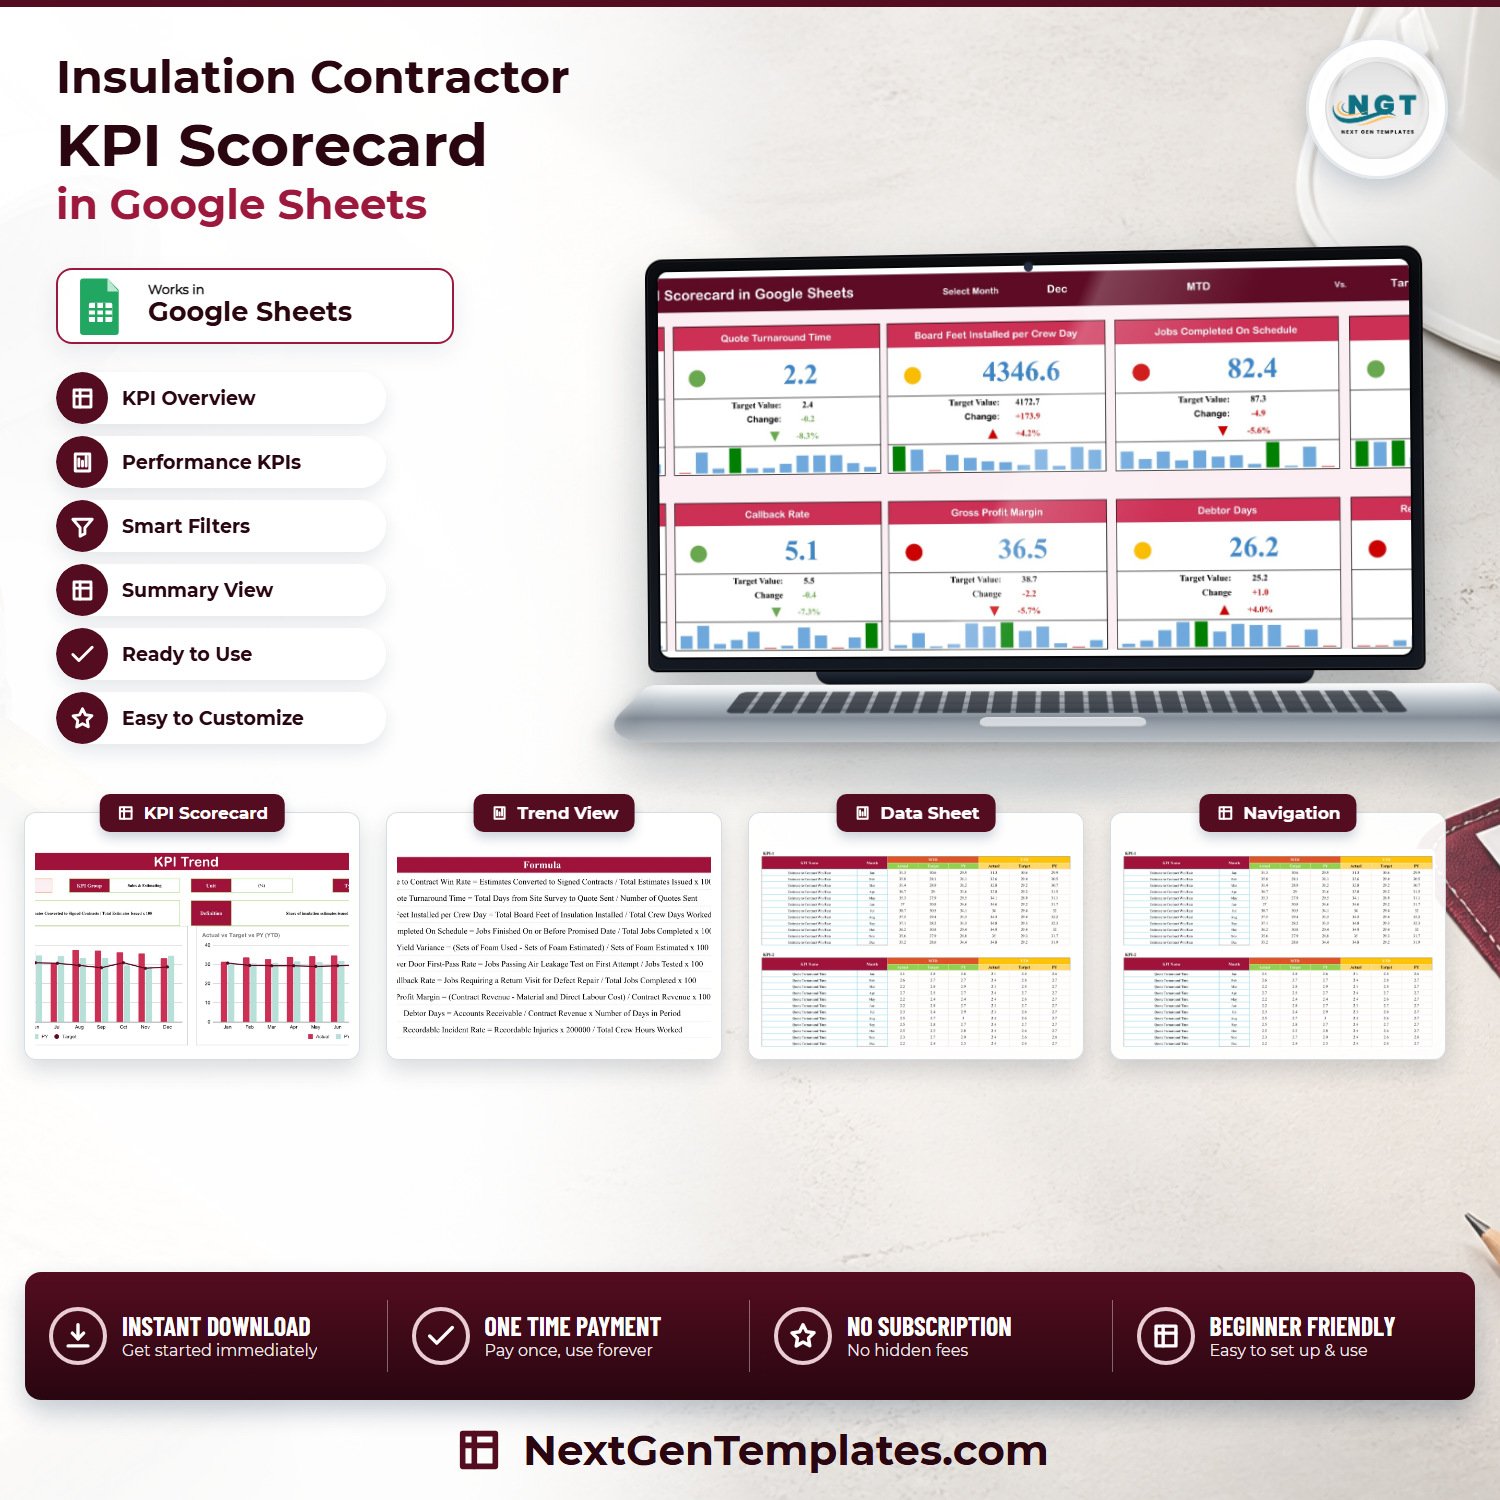

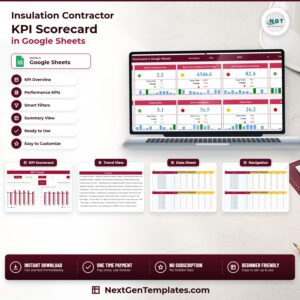
The Insulation Contractor KPI Scorecard in Google Sheets is a one-page monthly performance scorecard for spray foam, batt, blown-in and retrofit insulation contractors. Ten insulation KPIs sit on a single screen with red, amber and green traffic lights, a target value, a variance and a twelve-month sparkline on every card — so an owner or operations manager can see in about ten seconds where December actually landed against plan.
This is the KPI Scorecard template, not an analytics dashboard. It answers one question — are we on target this month, yes or no — and it answers it for estimating, production, quality, cash and safety at the same time. There are no pivot tables to refresh and no add-ons to install. You type twelve months of figures onto one data sheet and every card, arrow, light and chart recalculates.
🔑 Key Features of the Insulation Contractor KPI Scorecard in Google Sheets
- Ten insulation KPIs in five groups — Sales & Estimating, Production & Installation, Quality & Callbacks, Financial and Safety, all visible without scrolling.
- Red / amber / green traffic light on every card — each KPI scores itself against your target using the built-in RAG band table, not a fixed rule of thumb.
- Direction-aware scoring (UTB / LTB) — the scorecard knows that a higher Blower Door First-Pass Rate is good and a higher Callback Rate is bad, and flips the band logic per KPI.
- Select Month picker — move the whole scorecard from January to December with one dropdown.
- MTD / YTD switch — the same ten cards read month-to-date or year-to-date from a single control.
- Compare vs Target or vs Prior Year — one dropdown changes what all ten cards are measured against.
- Twelve-month sparkline on each card — the selected month is highlighted in green so the current reading and the trend sit together.
- Dedicated KPI Trend page — pick any one KPI and see Actual vs Target vs PY for both MTD and YTD across Jan to Dec, with its formula and definition pulled in automatically.
- Built-in KPI Definition sheet — group, unit, plain-English definition, exact formula and UTB/LTB direction for all ten metrics.
- One simple data sheet — twelve rows per KPI, six columns, no hidden helper tabs to maintain.
- Fully unlocked formulas — rename a KPI, change its unit, or switch its direction to match how your own company measures foam and batt.
- One-time purchase, no subscription — share it with your estimator, your production manager and your bookkeeper through normal Google Sheets sharing.
📦 What Is Inside the Insulation Contractor KPI Scorecard in Google Sheets
1. KPI Scorecard
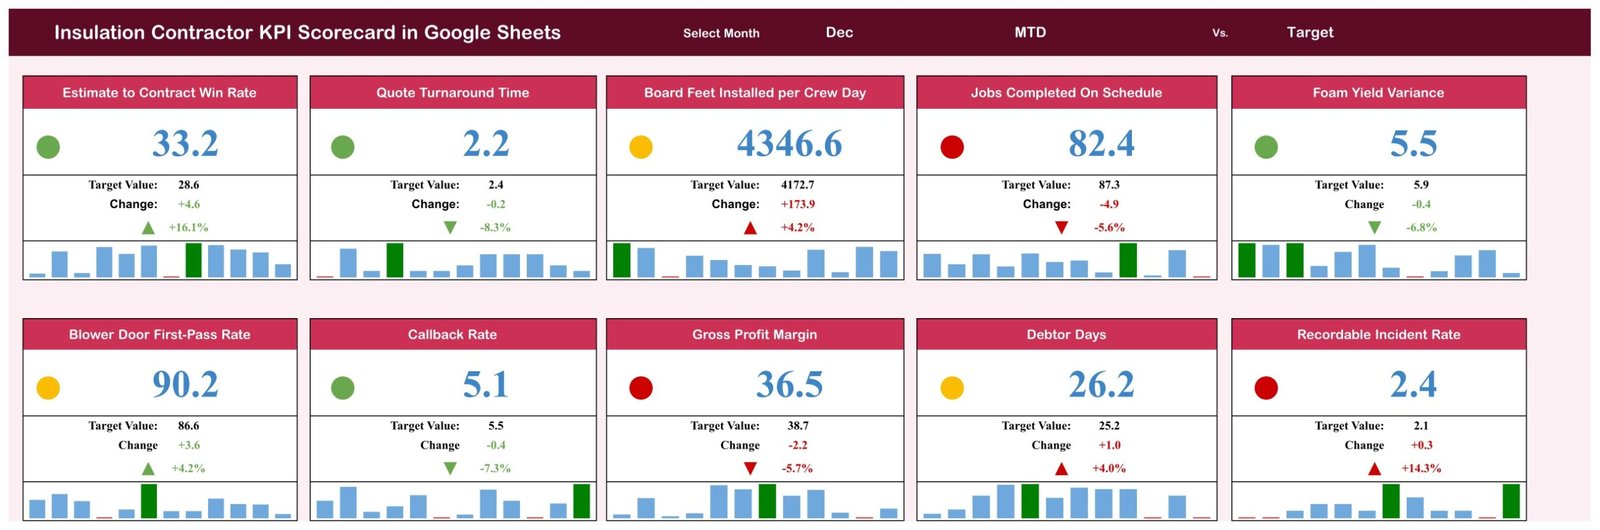
The front page. A header strip carries the template name and three controls — Select Month, the MTD / YTD actual type, and the Vs. Target / Vs. PY comparison basis. Below it, ten cards in two rows of five. Each card shows the KPI name, a coloured traffic light, the current value, the Target Value, the absolute Change, an up or down arrow with the change percentage, and a twelve-month sparkline.
In the December sample month that ships with the file, the mix is four green, three amber and three red — a realistic month rather than an all-green demo. Estimate to Contract Win Rate reads 33.2% against a 28.6% target, Quote Turnaround Time 2.2 days against 2.4, and Foam Yield Variance 5.5% against 5.9%. Jobs Completed On Schedule is red at 82.4% against 87.3%, Gross Profit Margin red at 36.5% against 38.7%, and Recordable Incident Rate red at 2.4 against a 2.1 target. Board Feet Installed per Crew Day, Blower Door First-Pass Rate and Debtor Days sit amber inside the tolerance band.
2. KPI Trend
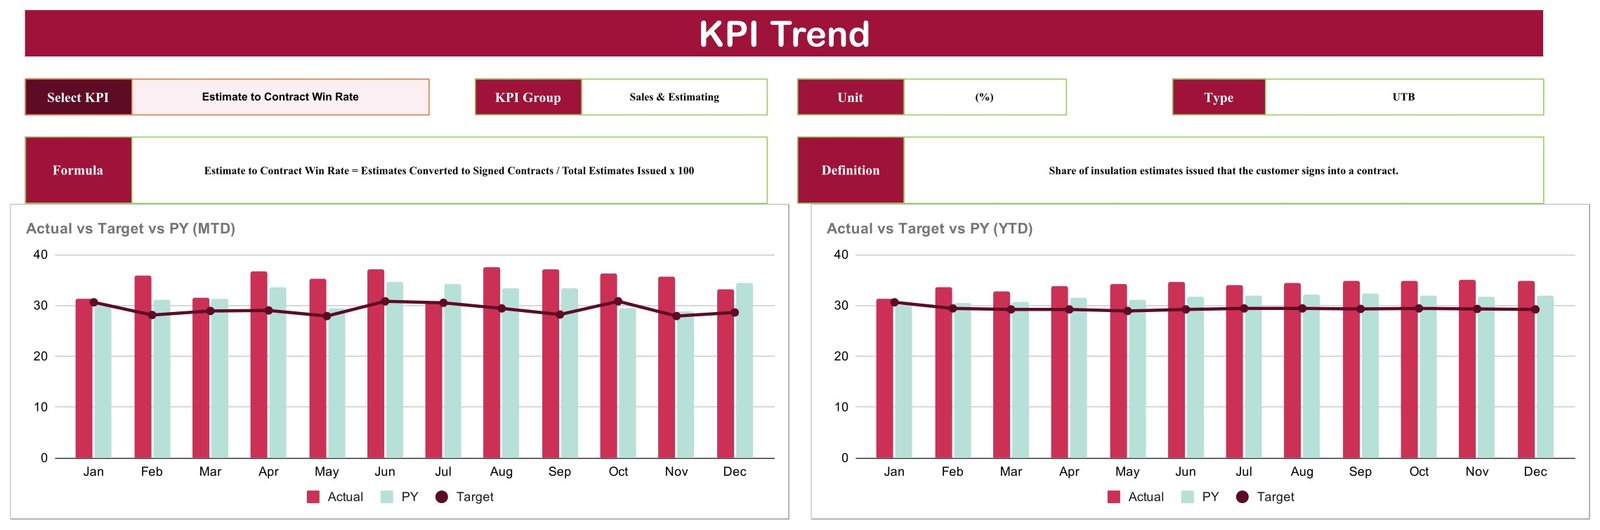
Choose one KPI from the Select KPI dropdown and the page rebuilds around it. The KPI Group, Unit and Type (UTB or LTB) fill in automatically, along with the metric’s Formula and a one-sentence Definition. Two column-and-line charts sit underneath: Actual vs Target vs PY (MTD) and Actual vs Target vs PY (YTD), both running January to December. Actual and prior year are columns, target is the line, so a month that broke the target line is obvious at a glance.
3. KPI Definition

A single reference table — number, KPI Group, KPI Name, Unit, Formula, Definition and Type — for all ten metrics. It is the page you send to a new production manager so everyone agrees what “on schedule” and “yield variance” actually mean before the numbers get argued about.
4. KPI Data
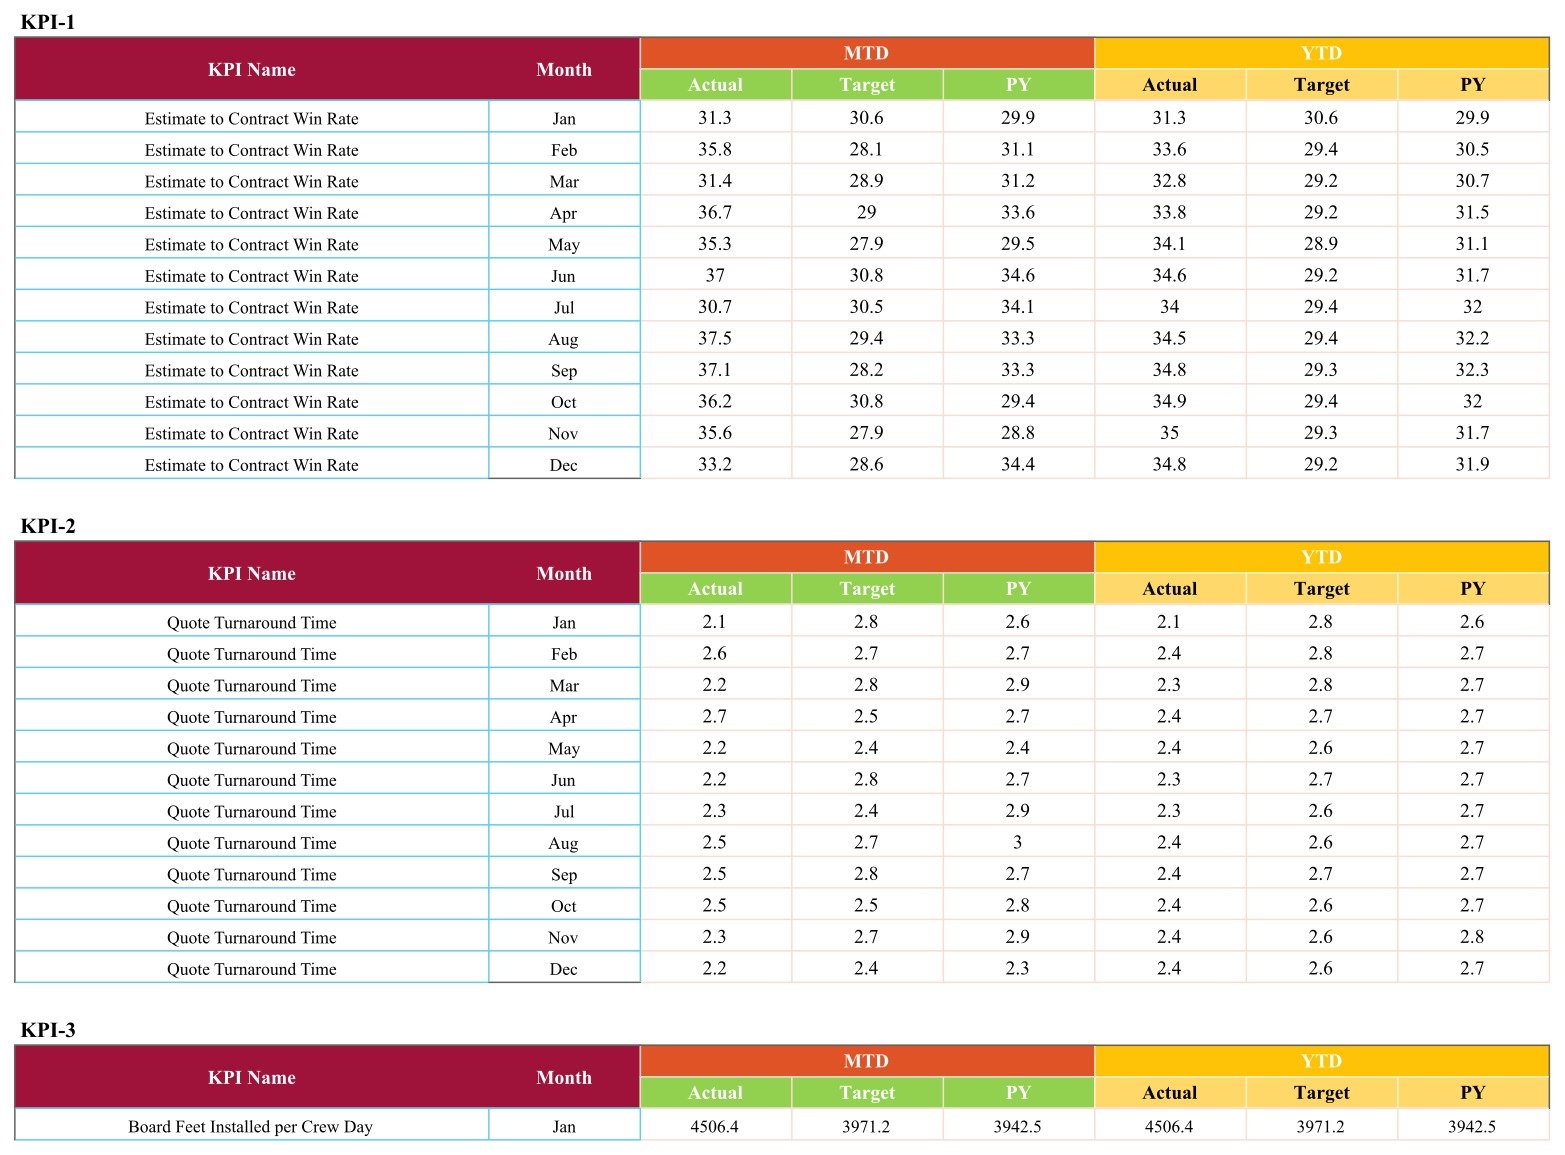
The only sheet you type on. Ten blocks, labelled KPI-1 to KPI-10, each with twelve month rows and six figure columns: MTD Actual, Target, PY and YTD Actual, Target, PY. Enter your own numbers over the sample data and the scorecard, the lights and both trend charts update immediately.
📐 The Ten Insulation KPIs, and How Each One Is Calculated
| # | KPI Group | KPI Name | Unit | Formula | Type |
|---|---|---|---|---|---|
| 1 | Sales & Estimating | Estimate to Contract Win Rate | % | Estimates Converted to Signed Contracts / Total Estimates Issued × 100 | UTB |
| 2 | Sales & Estimating | Quote Turnaround Time | Days | Total Days from Site Survey to Quote Sent / Number of Quotes Sent | LTB |
| 3 | Production & Installation | Board Feet Installed per Crew Day | Bd Ft | Total Board Feet of Insulation Installed / Total Crew Days Worked | UTB |
| 4 | Production & Installation | Jobs Completed On Schedule | % | Jobs Finished On or Before Promised Date / Total Jobs Completed × 100 | UTB |
| 5 | Production & Installation | Foam Yield Variance | % | (Sets of Foam Used − Sets of Foam Estimated) / Sets of Foam Estimated × 100 | LTB |
| 6 | Quality & Callbacks | Blower Door First-Pass Rate | % | Jobs Passing Air Leakage Test on First Attempt / Jobs Tested × 100 | UTB |
| 7 | Quality & Callbacks | Callback Rate | % | Jobs Requiring a Return Visit for Defect Repair / Total Jobs Completed × 100 | LTB |
| 8 | Financial | Gross Profit Margin | % | (Contract Revenue − Material and Direct Labour Cost) / Contract Revenue × 100 | UTB |
| 9 | Financial | Debtor Days | Days | Accounts Receivable / Contract Revenue × Number of Days in Period | LTB |
| 10 | Safety | Recordable Incident Rate | Per 200k Hrs | Recordable Injuries × 200,000 / Total Crew Hours Worked | LTB |
UTB means upper-the-better and LTB means lower-the-better. The traffic light reads the variance against target through a RAG band table that is itself on the sheet: for an upper-the-better KPI a variance at or below 0% is red, up to 10% is amber, and above 10% is green; for a lower-the-better KPI the logic is mirrored. That is why 2.2 days of quote turnaround shows green while 26.2 debtor days shows amber — both are “down is good” metrics being scored on how far they sit from your own target, not on whether the number went up or down.
📊 Insulation Contractor KPI Scorecard in Google Sheets vs. Excel vs. Job-Management Software — Where This Fits
| What you need | This Google Sheets scorecard | The Excel version | JobNimbus / Buildertrend / ServiceTitan |
|---|---|---|---|
| Cost | One-time, under $15 | One-time, under $17 | Monthly subscription per user |
| Setup time | Make a copy, type your figures | Download, open, type your figures | Weeks of onboarding and data migration |
| Works on a phone in the truck | Yes, through the Sheets app | Limited | Yes |
| Team access | Normal Google Sheets sharing, no extra seats | Emailed file or shared drive | Paid seat per person |
| Insulation-specific KPIs out of the box | Yes — board feet per crew day, foam yield variance, blower door first-pass | Yes, same ten | Generic job metrics, needs custom reports |
| Works offline | No | Yes | Partly |
| Pulls figures automatically from your accounting system | No — you enter them monthly | No | Yes |
| You own and can edit every formula | Yes | Yes | No |
The honest positioning: if you already run ServiceTitan or Buildertrend and pay for reporting seats, this scorecard is a monthly summary layer, not a replacement. If you run your insulation business on quotes, spreadsheets and a bookkeeper — which most crews under thirty people do — this is the whole reporting system, and it costs less than one hour of a technician’s time.
🖥 Also Available in Microsoft Excel
The same ten insulation KPIs, the same five groups and the same traffic-light logic are also published as the Insulation Contractor KPI Scorecard in Excel, at nextgentemplates.com/product/insulation-contractor-kpi-scorecard-in-excel/. Choose the Excel edition if your team works offline, keeps files on a shared network drive, or already reports out of Excel; choose this Google Sheets edition if you want your estimator, production manager and bookkeeper looking at the same live copy from a phone or a laptop without emailing files around. The two are priced separately and sold separately — you do not need both.
👥 Who This Template Is For — and Who It Is Not For
A good fit for:
- Spray foam and batt insulation contractors running two to twenty crews.
- Owner-operators who want a one-page monthly number review instead of a stack of job reports.
- Production managers tracking board feet per crew day and foam yield variance against an estimate.
- Retrofit and weatherisation firms that have to evidence blower door first-pass rates.
- Estimators who want their win rate and quote turnaround measured next to production and margin.
- Bookkeepers and office managers who already close the month in a spreadsheet.
Not a good fit for:
- Anyone wanting live sync with QuickBooks, Xero, Procore or a CRM — this is a manual-entry reporting template.
- Job-level costing, scheduling or crew dispatch — it reports monthly totals, not individual jobs.
- Teams that need more than twelve months of history in one file without extending the data sheet.
- Anyone who cannot use Google Sheets at all — take the Excel edition instead.
⚙ How to Use the Insulation Contractor KPI Scorecard in Google Sheets
- Open the PDF in your download and click the “Make a copy” link inside it. Google Drive creates your own editable copy — the original stays untouched.
- Read the KPI Definition sheet first. Agree with your team what each of the ten KPIs means before anyone types a number.
- Go to the KPI Data sheet. For each block, KPI-1 to KPI-10, replace the sample figures with your own MTD and YTD Actual, Target and PY values for each month.
- Set your own targets. The Target column is what drives every traffic light, so put your real budget in, not an aspiration.
- Return to the KPI Scorecard. Pick the month, choose MTD or YTD and choose whether to compare against Target or Prior Year.
- Work the reds and ambers. Open the KPI Trend page for any card that is off, and check whether it is a one-month blip or a run.
- Rename or repoint a KPI if you need to. Everything is unlocked — change a name and a formula on the definition sheet and the scorecard follows.
- Share it read-only with the wider team and keep edit rights with whoever owns the monthly close.
💼 Real-World Use Cases
- Monday morning production meeting. One screen, ten numbers, three reds. The meeting is about the reds.
- Foam waste investigation. Foam Yield Variance goes amber two months running — the trend page shows it started when a new crew came on.
- Estimator review. Win rate and quote turnaround side by side: quoting faster is only worth it if the win rate holds.
- Cash chase. Debtor Days drifting above target tells the office manager to start collections before the quarter closes.
- Safety reporting. Recordable Incident Rate per 200,000 crew hours in the same monthly pack as production and margin.
- Bank or bonding pack. A twelve-month Actual vs Target vs Prior Year chart per KPI, exported straight to PDF.
- Blower door compliance. First-pass rate tracked monthly so retest costs stop being invisible.
❓ Frequently Asked Questions
Is this the KPI Scorecard or the KPI Dashboard?
This is the KPI Scorecard — the one-page, month-picker, traffic-light format with a KPI Trend page and a KPI Definition sheet. NextGenTemplates also publishes an analytical KPI Dashboard line and a general Dashboard line with similar names. They are different products with different layouts, and several are linked at the bottom of this page.
Do I need a paid Google Workspace account?
No. A free personal Google account is enough.
How do I actually get the file?
Your download is a PDF. Inside it is a “Make a copy” link. Click it while signed in to Google and a private copy lands in your own Drive.
Can I change the KPIs?
Yes. Nothing is locked. Rename any KPI, change its unit, edit its formula text, and switch it between UTB and LTB on the definition sheet.
Does it connect to QuickBooks, Xero or my CRM?
No. Figures are entered manually once a month on the KPI Data sheet. That is deliberate — it keeps the file portable and free of add-ons.
Why is a KPI amber when it beat its target?
The RAG bands score how far the variance is from target, not merely which side of it you landed. Beating target by less than 10% is amber; beating it by more than 10% turns the light green. The bands are on the sheet and you can change them.
How many months of data does it hold?
Twelve, January to December, with both MTD and YTD columns. Copy the file each year, or extend the data sheet if you want more.
Can my whole crew see it?
Yes. Share it like any Google Sheet, read-only for the team and edit access for whoever owns the numbers. There are no per-seat fees.
Is there an Excel version?
Yes — the Insulation Contractor KPI Scorecard in Excel carries the same ten KPIs. It is sold separately.
What support is included?
Email support for setup questions, plus free tutorials on the NextGenTemplates YouTube channel.
👤 About the Author
Built by the NextGenTemplates team, who have spent more than a decade making Excel, Google Sheets and Power BI reporting tools for small trade and service businesses. The KPI set here follows how insulation contractors actually measure work — board feet per crew day rather than generic “productivity”, foam yield variance against the estimated set count, and blower door first-pass rate as the quality gate — so the scorecard reads like something from inside the industry rather than a renamed sales template.
🔗 Explore Related Templates
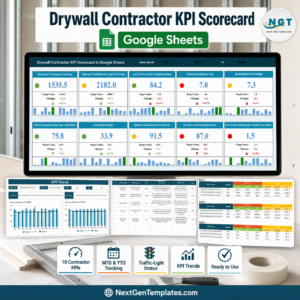
- Drywall Contractor KPI Scorecard in Google Sheets — the same scorecard format for drywall and finishing crews.
- Carpentry Workshop KPI Scorecard in Google Sheets — ten workshop KPIs in the same one-page layout.
- Roofing Contractor KPI Dashboard in Google Sheets — the analytical KPI Dashboard line, a different and more chart-heavy format.
- Plumbing Business KPI Dashboard in Google Sheets — field-service KPIs for a plumbing operation.
- Electrical Contractor KPI Dashboard in Google Sheets — technician performance and first-time fix rate.
- Masonry Contractor KPI Scorecard in Excel — the same scorecard idea for masonry, in Excel.<
Watch the step-by-step video Demo:
Compatibility and Requirements
- Works in Google Sheets. You need a free Google account and a web browser.
- You pick the month, the MTD or YTD view and the comparison basis from dropdowns on the KPI Scorecard sheet. Google explains dropdowns in Create an in-cell dropdown list.
Related Insulation and Contractor Templates
- Insulation Contractor KPI Scorecard in Excel: the same ten insulation KPIs in Excel
- Insulation Contractor KPI Dashboard in Google Sheets: the dashboard format for the same trade
- Insulation Contractor KPI Dashboard in Power BI: the Power BI edition
- Insulation Contractor KPI Dashboard in Excel: the dashboard format in Excel
- Google Sheets Business Pack (Pro): 14 business templates in one download
Browse all Google Sheets KPI dashboards and Google Sheets templates.




























Reviews
There are no reviews yet.