

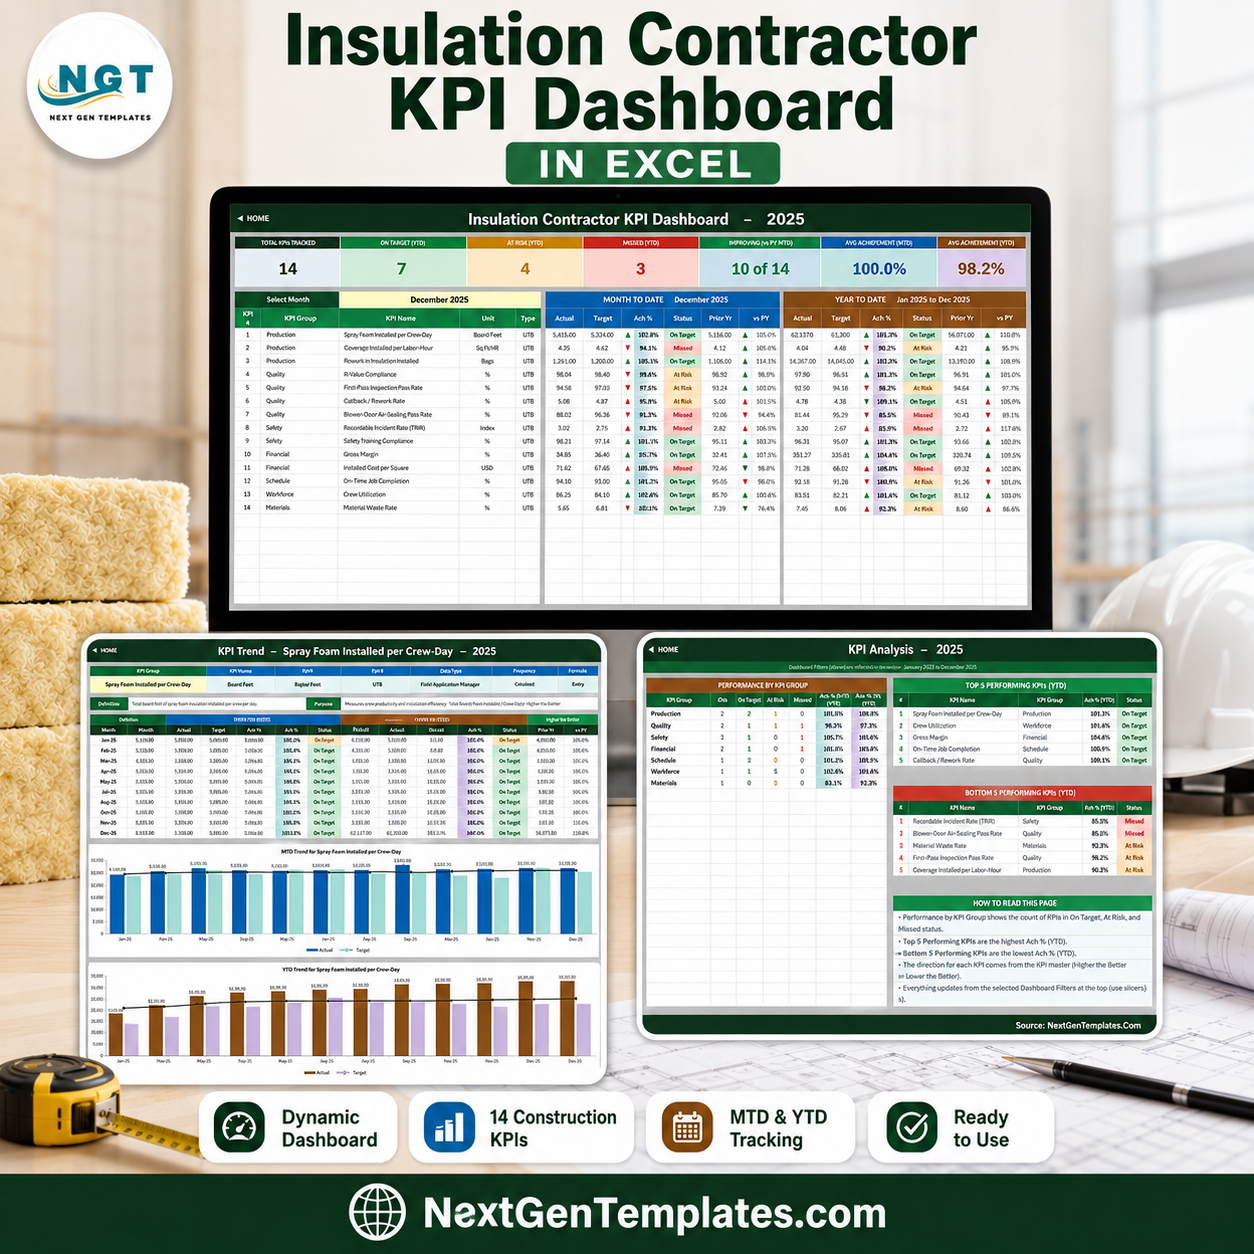

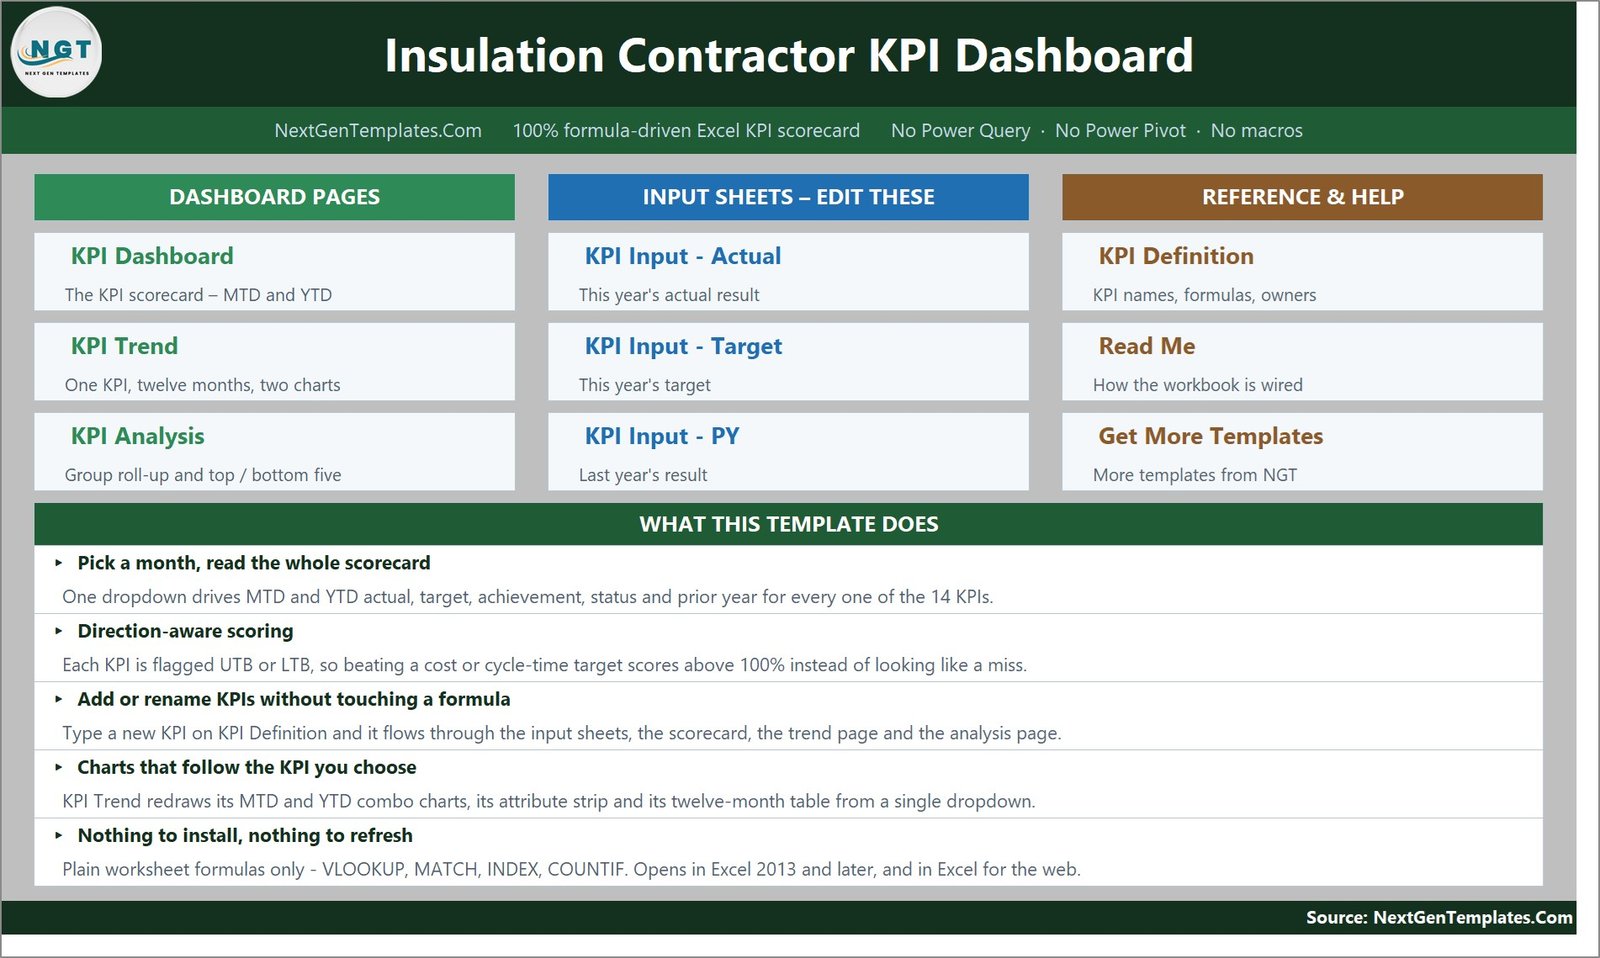
The Insulation Contractor KPI Dashboard in Excel is a month-picker KPI scorecard built for spray-foam, batt and blown-in insulation contractors. It tracks 14 insulation KPIs across 7 groups – Production, Quality, Safety, Financial, Schedule, Workforce and Materials – and shows MTD and YTD actual, target, achievement %, traffic-light status, prior year and year-on-year movement for every one of them from a single dropdown. It is 100% worksheet formulas: no macros, no Power Query, no Power Pivot, no add-ins, no data model. It opens in Excel 2013 and later and in Excel for the web. Sample 2025 data is included so you can see it working the second you open it, and every cell is unlocked so you can rename a KPI, move a target or change a threshold. Instant download, lifetime access to the file you buy. Insulation Contractor KPI Dashboard in Excel
Which template is this? NextGenTemplates ships three similarly named lines and they are genuinely different products. This is the KPI Dashboard line – a month picker, traffic lights, and dedicated KPI Trend and KPI Analysis pages. It is not the analytical dashboards that chart a transaction table through slicers, and it is not the lighter, ten-KPI Insulation Contractor KPI Scorecard in Excel. They complement each other rather than duplicate each other. Insulation Contractor KPI Dashboard in Excel
Key Features of the Insulation Contractor KPI Dashboard in Excel
- One dropdown drives the whole scorecard. Cell D6 on KPI Dashboard lists the twelve months of the reporting year. Pick December 2025 and all 14 rows, the seven summary cards and the entire KPI Analysis page follow it. There is no refresh step and no query to run.
- Direction-aware scoring. Each KPI carries a UTB (upper the better) or LTB (lower the better) flag. This build ships 10 UTB and 4 LTB – Callback / Rework Rate, Recordable Incident Rate (TRIR), Installed Cost per Square and Material Waste Rate are the lower-is-better four. Achievement is Actual / Target for UTB and Target / Actual for LTB, so beating a waste, cost, callback or incident-rate target scores above 100% rather than reading as a miss, and a rising incident rate shows a red arrow. Insulation Contractor KPI Dashboard in Excel
- Traffic lights with editable thresholds. On Target from 100%, At Risk 95-99%, Missed below 95%. The thresholds sit in plain formulas in columns L and U on KPI Dashboard – change them there to match your own governance.
- Seven summary cards. Total KPIs Tracked, On Target (YTD), At Risk (YTD), Missed (YTD), Improving vs PY (MTD), Avg Achievement (MTD) and Avg Achievement (YTD). In the shipped December 2025 sample they read 14, 7, 4, 3, 10 of 14, 100.0% and 98.2%.
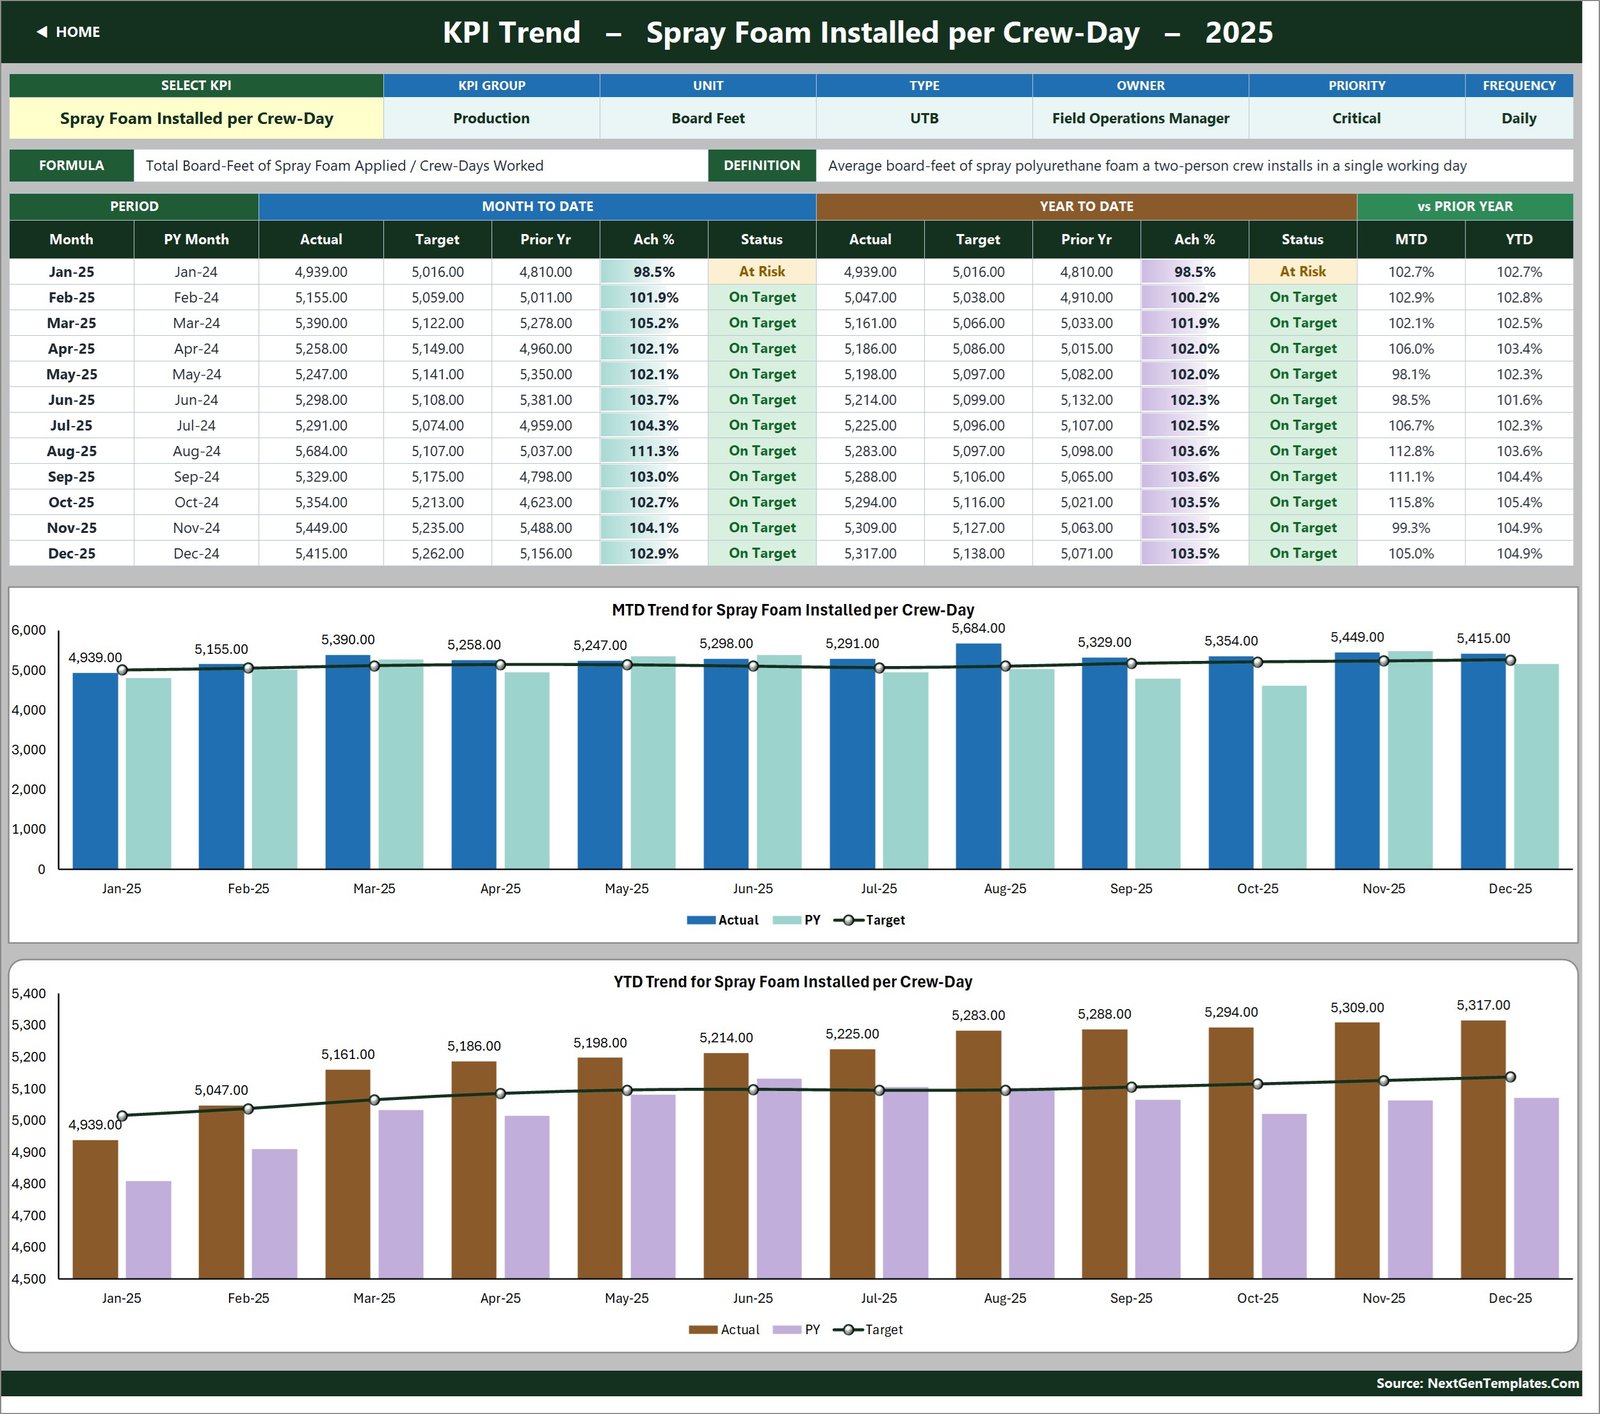
- A KPI Trend page for one KPI at a time. A second dropdown on KPI Trend lists every KPI name; the attribute strip (group, unit, type, owner, priority, frequency), the formula, the definition, the twelve-month table and both charts all redraw together.
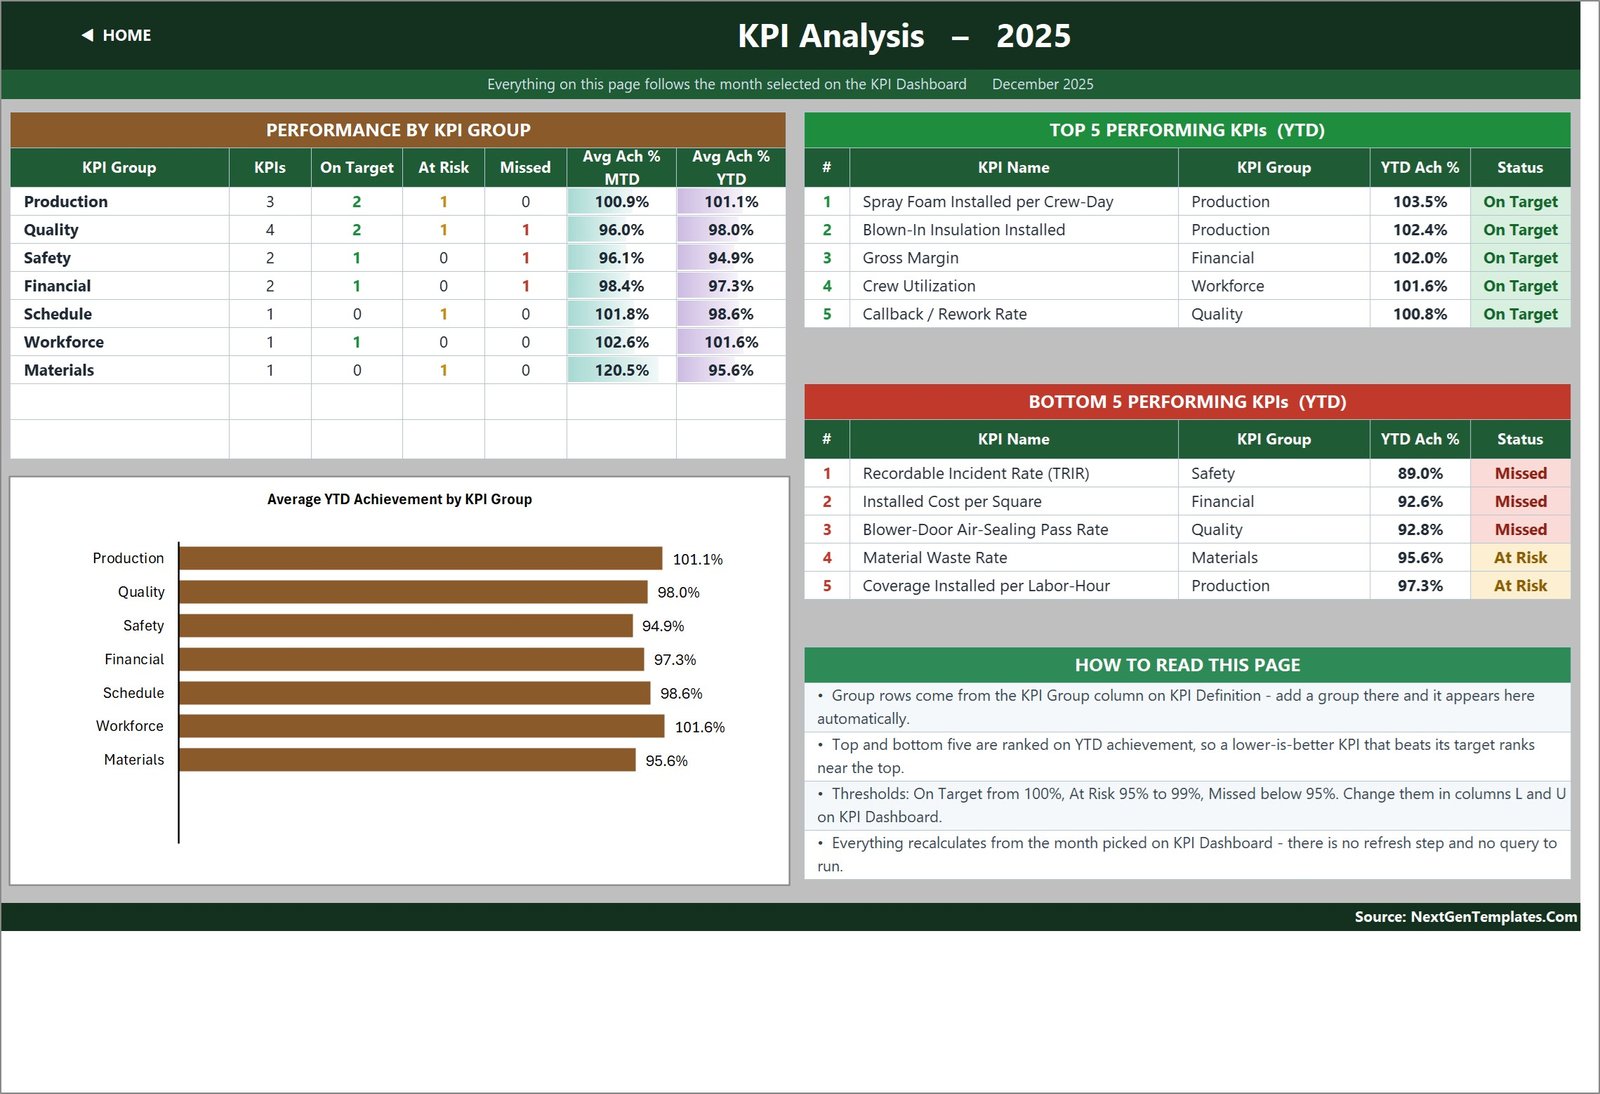
- Three live charts. “MTD Trend for [KPI]” and “YTD Trend for [KPI]” are combo charts – actual and prior-year columns with a target line – and “Average YTD Achievement by KPI Group” is a bar chart on the analysis page.
- Group roll-up plus top and bottom five. KPI Analysis counts On Target / At Risk / Missed per KPI group, averages MTD and YTD achievement per group, and ranks the best and worst five KPIs on YTD achievement.
- Room to grow without formula work. The sheets are wired for 22 KPIs; 14 are filled in and the remaining rows are live and empty. Type a KPI on KPI Definition and it flows through the three input sheets, the scorecard, the trend dropdown and the analysis page automatically. Insulation Contractor KPI Dashboard in Excel
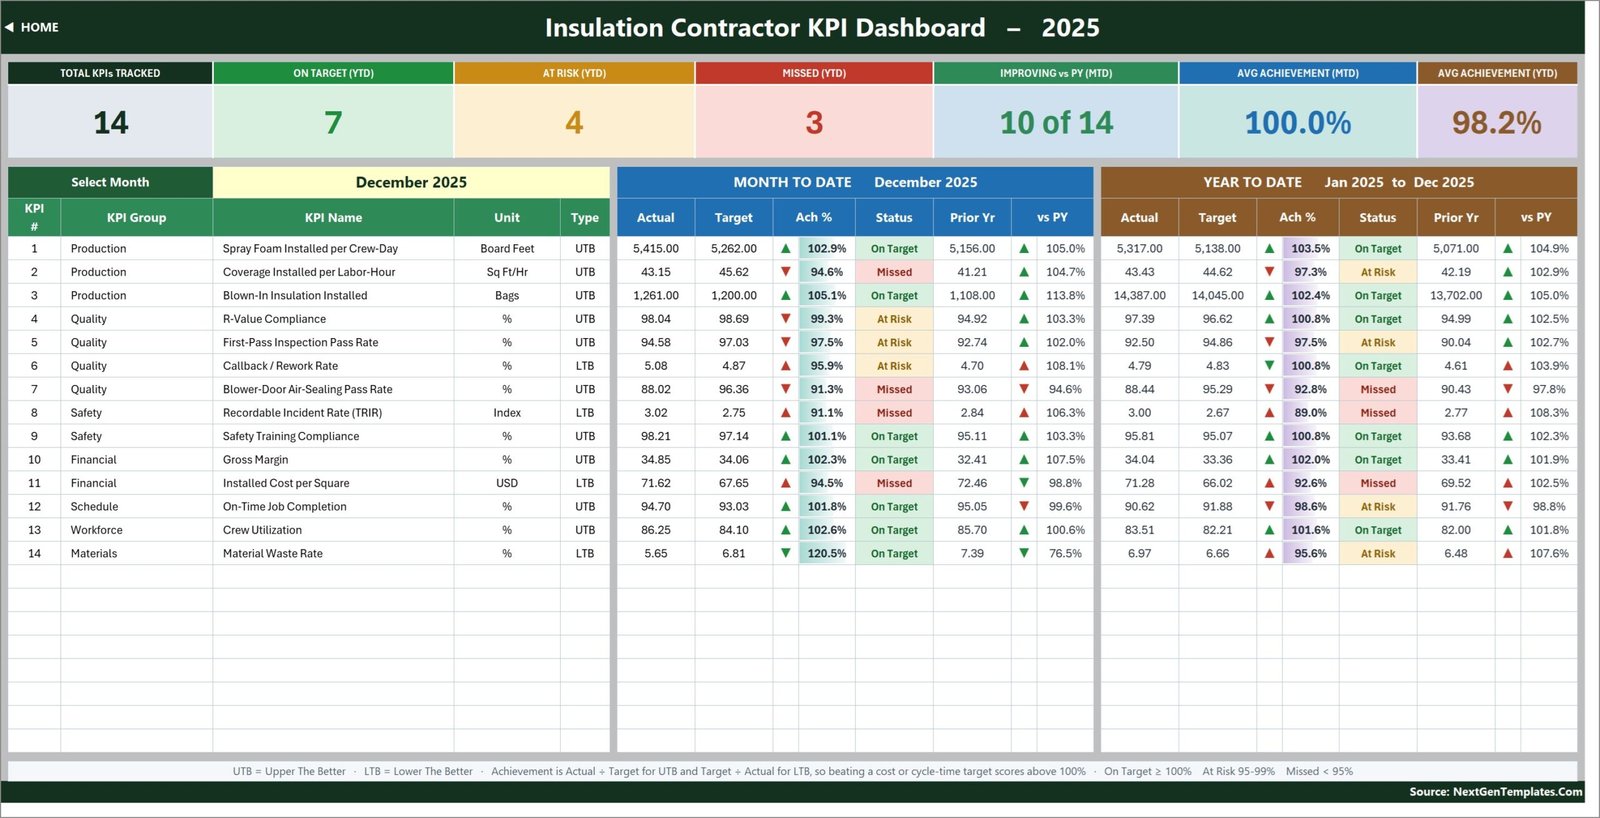
The 14 KPIs This Template Ships With
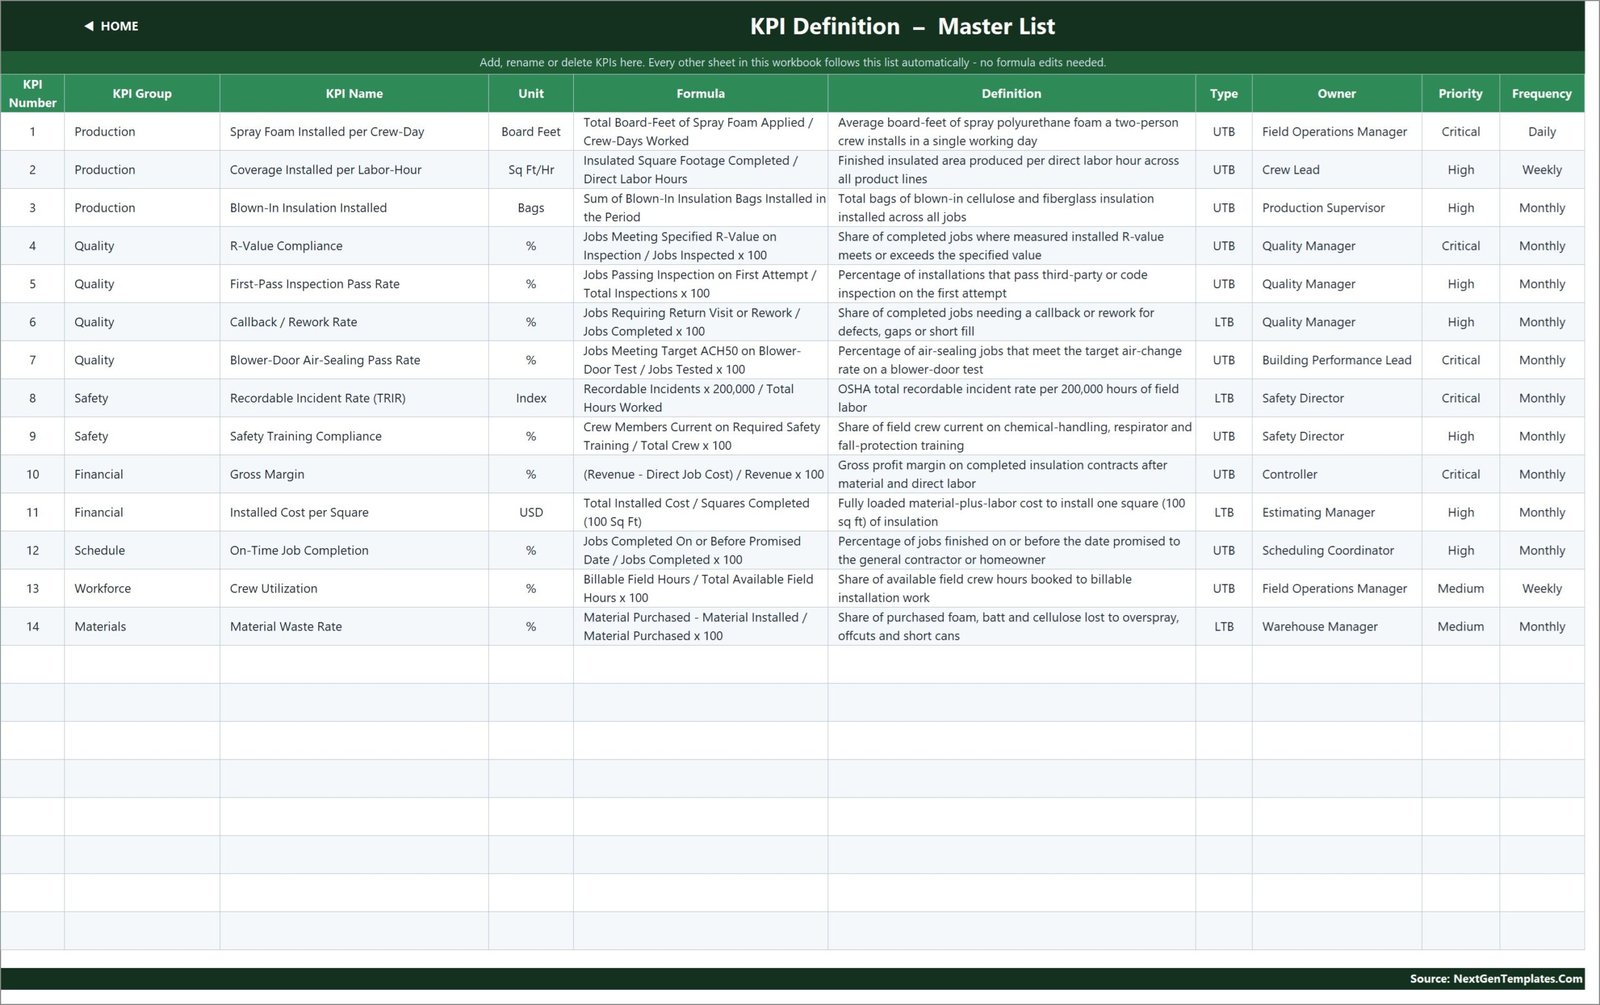
Every KPI below is on KPI Definition with its own group, unit, formula, plain-English definition, UTB/LTB flag, owner, priority and frequency. Rename any of them in one place and the whole workbook follows.
- Production (3): Spray Foam Installed per Crew-Day (Board Feet, UTB), Coverage Installed per Labor-Hour (Sq Ft/Hr, UTB), Blown-In Insulation Installed (Bags, UTB).
- Quality (4): R-Value Compliance (%, UTB), First-Pass Inspection Pass Rate (%, UTB), Callback / Rework Rate (%, LTB), Blower-Door Air-Sealing Pass Rate (%, UTB).
- Safety (2): Recordable Incident Rate / TRIR (Index, LTB), Safety Training Compliance (%, UTB).
- Financial (2): Gross Margin (%, UTB), Installed Cost per Square (USD, LTB).
- Schedule (1): On-Time Job Completion (%, UTB).
- Workforce (1): Crew Utilization (%, UTB).
- Materials (1): Material Waste Rate (%, LTB).
Each row also carries an owner (Field Operations Manager, Crew Lead, Production Supervisor, Quality Manager, Building Performance Lead, Safety Director, Controller, Estimating Manager, Scheduling Coordinator, Warehouse Manager) and a Critical / High / Medium priority, so the scorecard doubles as a simple accountability list.
What Is Inside the Insulation Contractor KPI Dashboard in Excel
The download is a ZIP holding the .xlsx workbook and the Excel KPI Dashboard User Manual (PDF). The workbook has ten visible sheets plus one hidden helper sheet:
- Home – a nine-tile launcher plus a plain-English summary of what the file does.
- KPI Dashboard – the scorecard: month picker, seven summary cards, and one row per KPI with a full MTD block and a full YTD block.
- KPI Trend – one KPI, twelve months, two combo charts.
- KPI Analysis – group roll-up, bar chart, top 5 and bottom 5 on YTD achievement.
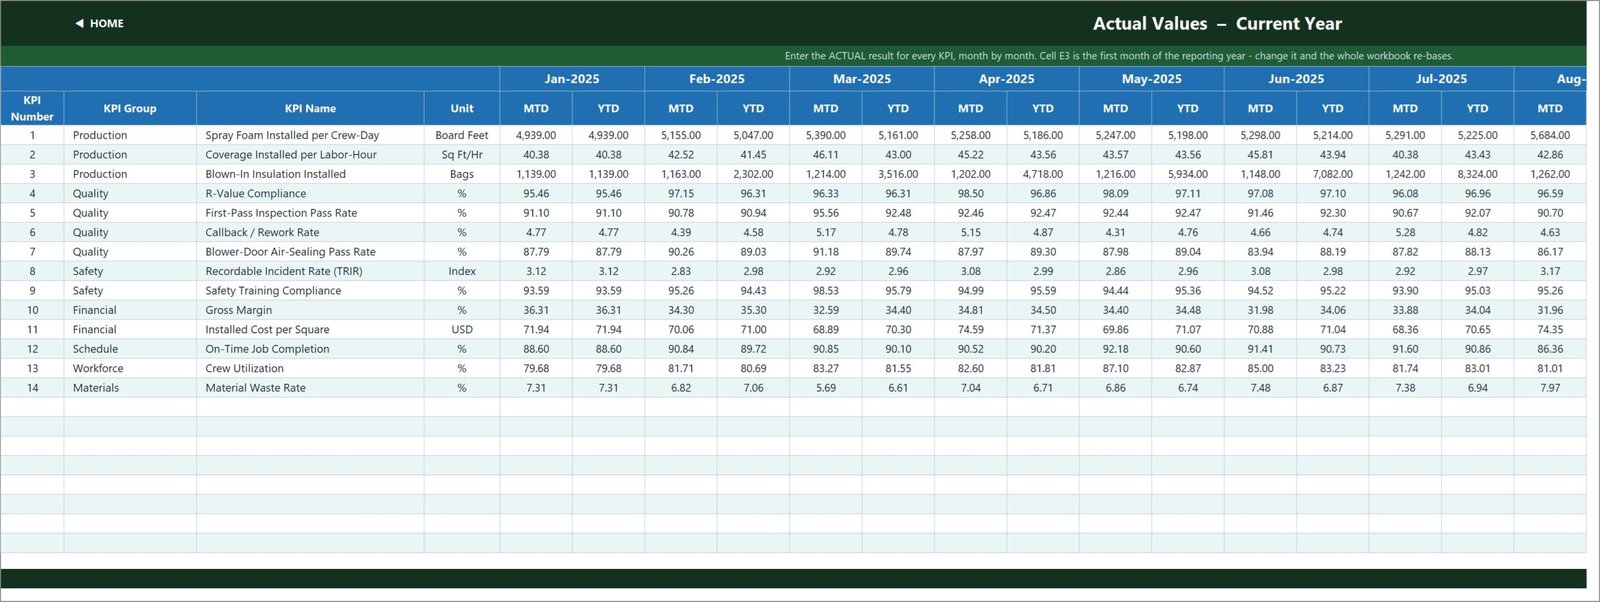
- KPI Input – Actual – this year’s numbers, an MTD and a YTD column for each of the twelve months.
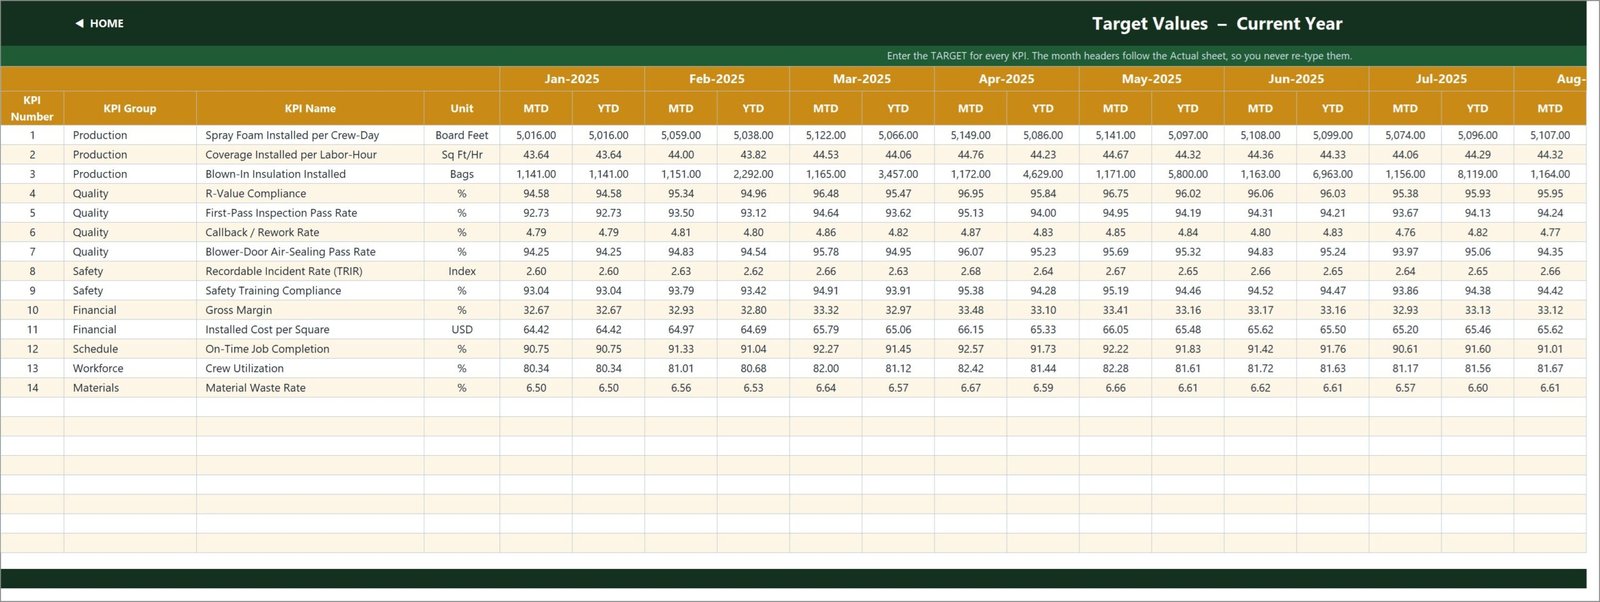
- KPI Input – Target – this year’s targets, same shape, month headers inherited from the Actual sheet.
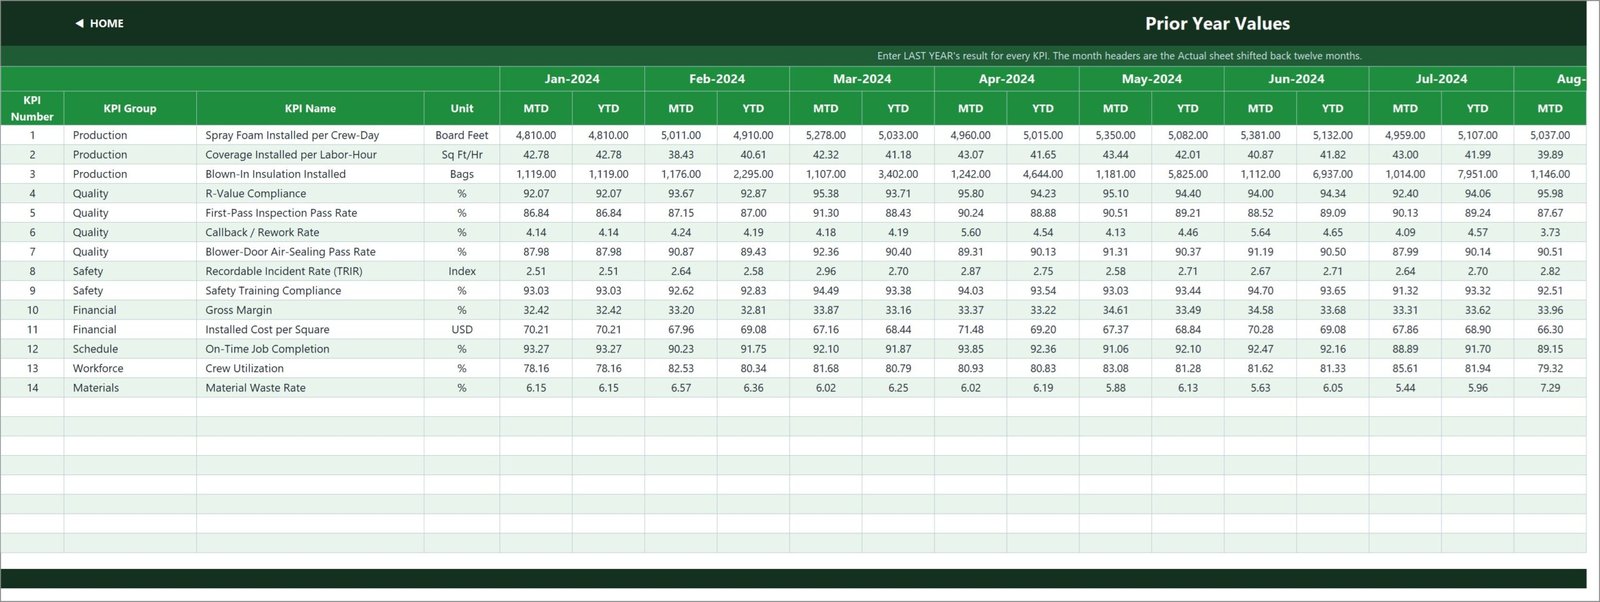
- KPI Input – PY – last year’s numbers, month headers shifted back twelve months automatically.
- KPI Definition – the master KPI list that every other sheet reads.
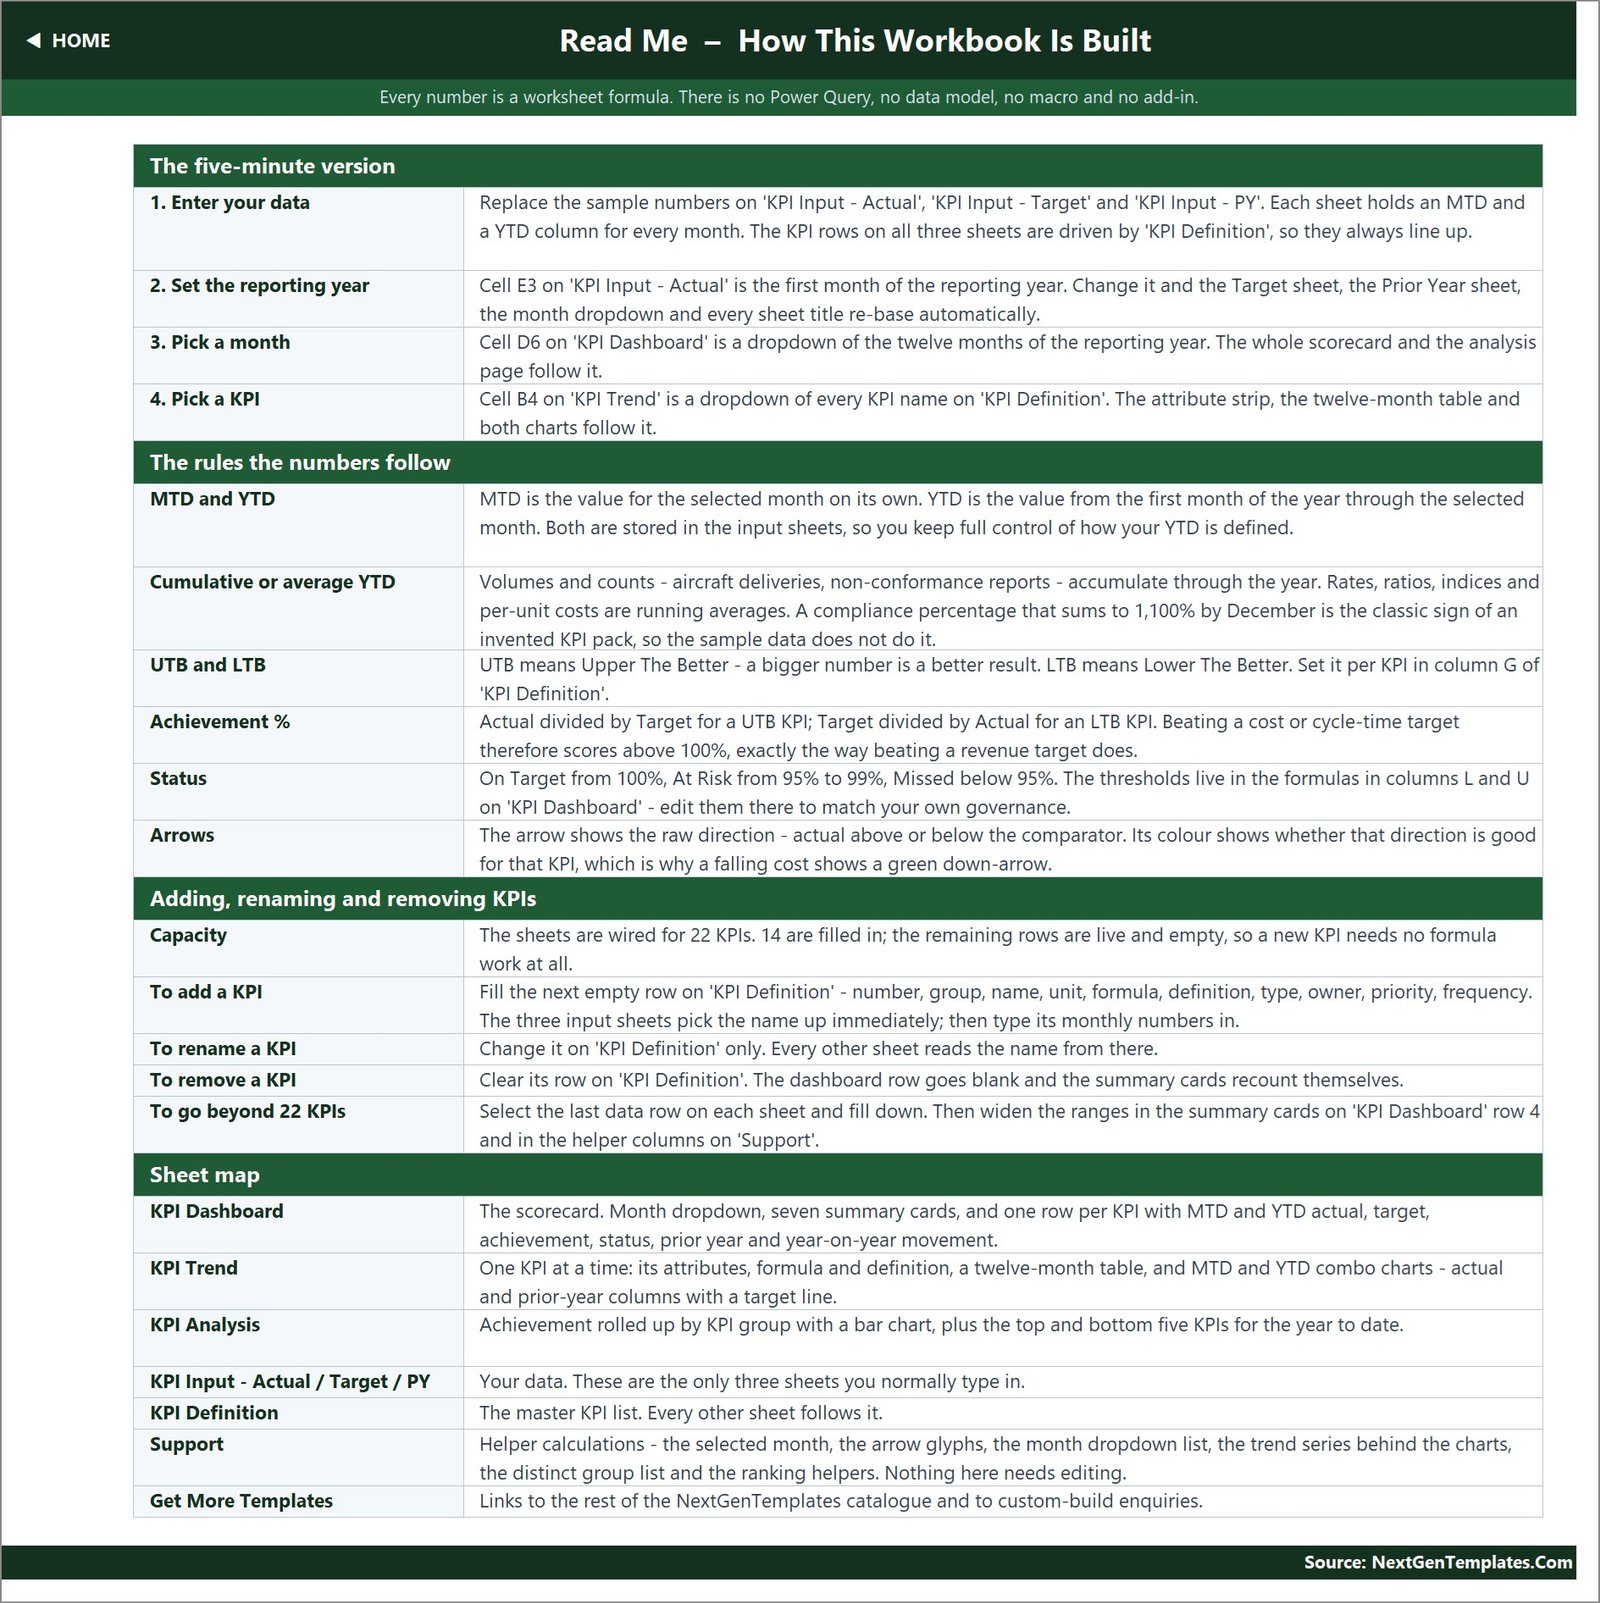
- Read Me – how the workbook is wired, in one page.
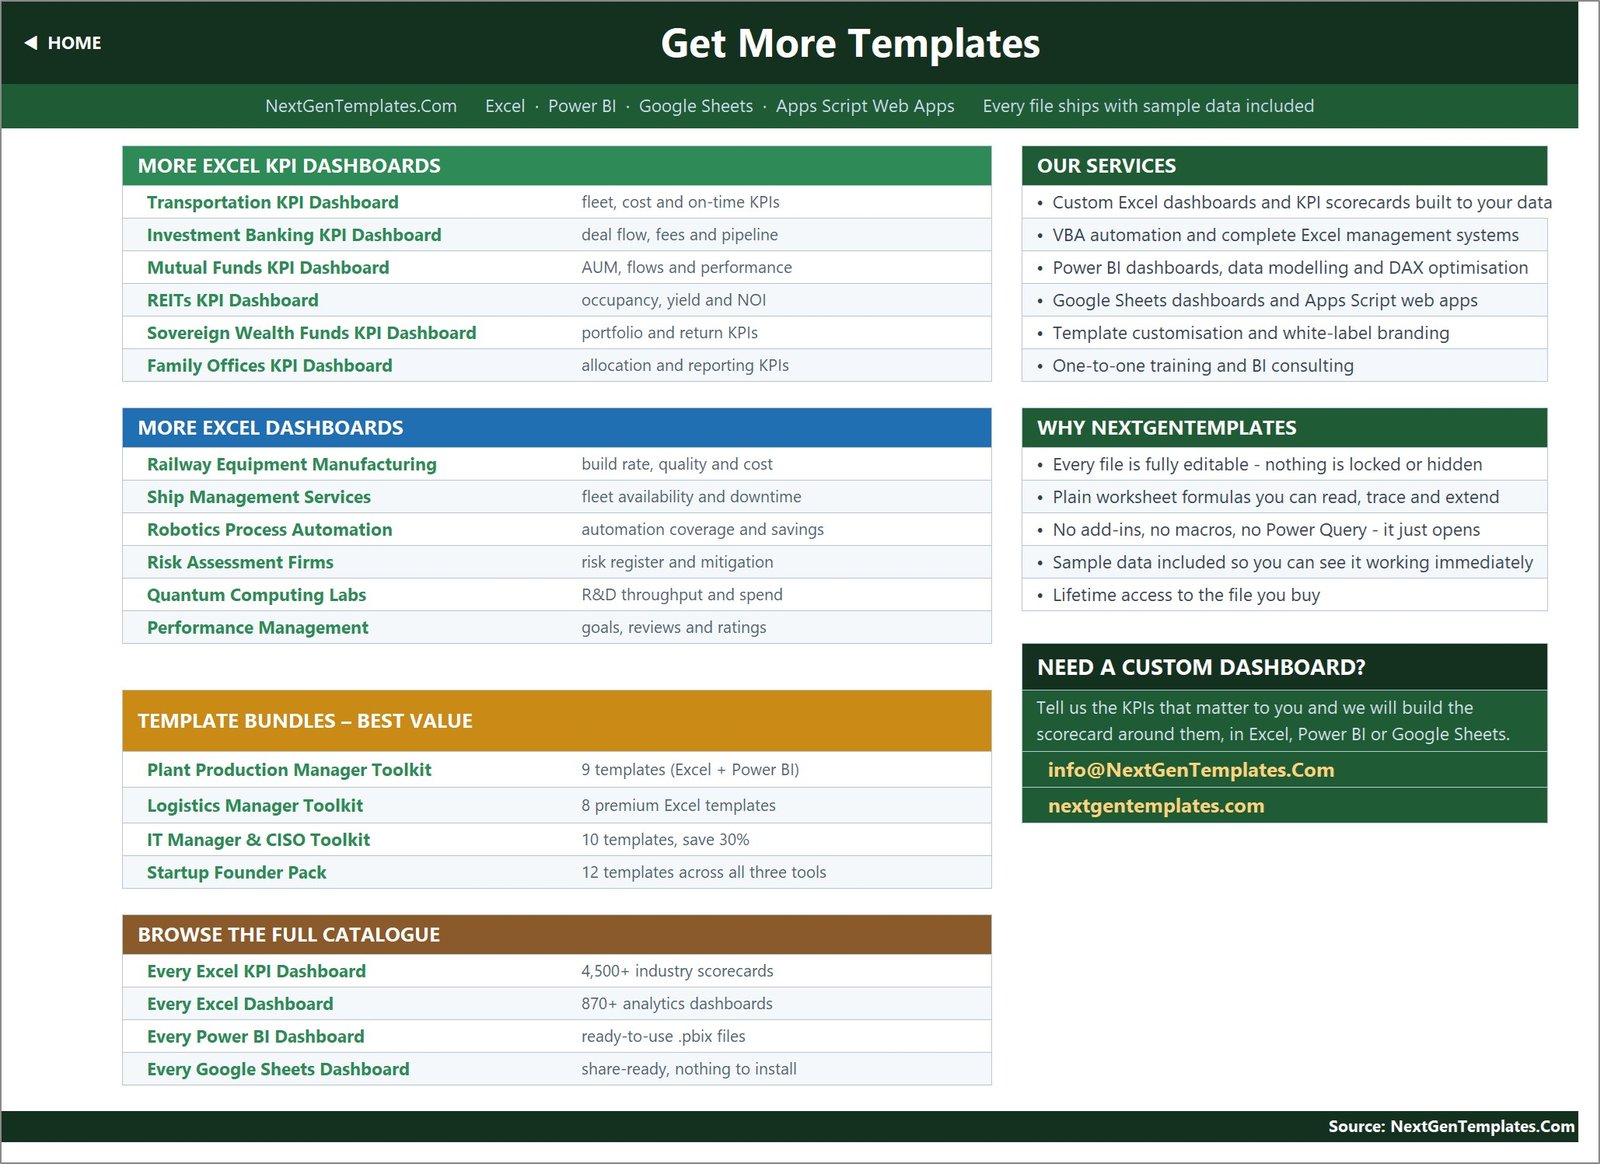
- Get More Templates – links to the rest of the NextGenTemplates catalogue.
- Support (hidden) – the selected month, arrow glyphs, month list, chart series and ranking helpers. Nothing here needs editing. Insulation Contractor KPI Dashboard in Excel
Insulation Contractor KPI Dashboard in Excel vs. Google Sheets vs. Paid Construction SaaS – Where This Fits
| What you need | This Excel KPI Dashboard | A Google Sheets KPI scorecard | Construction / field-service SaaS |
|---|---|---|---|
| Cost | One-off 12.99, lifetime access | One-off, similar | Typically 50-300+ per user per month |
| Setup time | Open it, type your numbers over the sample | Copy the sheet, type your numbers | Implementation, data mapping, training |
| Where your data lives | Your own file, on your own machine | Your Google Drive | The vendor’s cloud |
| Works offline | Yes | No | No |
| Automatic capture from job costing / payroll | No – you type MTD and YTD in | No | Yes, that is what you are paying for |
| Change a KPI, a target or a threshold | Type it – every cell is unlocked | Type it | Vendor roadmap or a paid customisation |
| Multi-user, real-time editing | No (single workbook) | Yes | Yes |
Put plainly: this is the right tool if you already have your monthly numbers somewhere – a job-cost report, a payroll summary, a QA log – and you want a governed, board-ready scorecard on top of them without paying a monthly subscription. It is the wrong tool if you want the numbers to arrive on their own.
Who This Template Is For – and Who It Is Not For
It is for: owners and operations managers of insulation contracting firms; production and crew supervisors reporting weekly and monthly; estimators and controllers watching installed cost per square and gross margin; quality and building-performance leads tracking R-value compliance and blower-door pass rates; safety directors who already keep an incident record elsewhere and want the headline rate on the same page as production; and anyone preparing a monthly management pack for a GC, a franchisor or a lender.
It is not for you if you need job-by-job or crew-by-crew detail (this workbook stores one number per KPI per month), if you want the numbers pulled automatically from an accounting or job-costing system (there is no connection and no import), or if you are looking for an OSHA recordkeeping system. TRIR here is a number you type; the file has no incident log, no OSHA 300 form and no corrective-action workflow.
How to Use the Insulation Contractor KPI Dashboard in Excel
- Unzip and open the .xlsx. It opens straight into Home. Nothing to enable, nothing to install.
- Set your reporting year. Cell E3 on KPI Input – Actual is the first month of the year. Change it and the Target sheet, the Prior Year sheet, the month dropdown and every sheet title re-base themselves.
- Make the KPI list yours. On KPI Definition, rename, re-group or delete any of the 14 rows, or fill an empty row to add a fifteenth. Set the Type column to UTB or LTB – this is the single most important field, because it decides whether a rise is good news.
- Type your numbers. Replace the sample data on KPI Input – Actual, KPI Input – Target and KPI Input – PY. Each sheet holds an MTD and a YTD column for every month, so you decide how your year-to-date is defined – cumulative for volumes, running average for rates.
- Pick a month. Use the dropdown in D6 on KPI Dashboard. The scorecard, the cards and the analysis page follow it instantly.
- Drill into one KPI. On KPI Trend, pick a KPI from the dropdown to get its twelve-month table and both charts.
- Tune the thresholds if you need to. The 100 / 95 cut-offs live in the status formulas in columns L and U on KPI Dashboard.
Real-World Use Cases
- The monthly management meeting. Pick last month, print or share KPI Dashboard, and the discussion starts from the three Missed rows rather than from a spreadsheet nobody agrees on. In the sample month that is Blower-Door Air-Sealing Pass Rate, Recordable Incident Rate and Installed Cost per Square.
- Crew productivity reviews. Spray Foam Installed per Crew-Day and Coverage Installed per Labor-Hour on the trend page show whether a good month was a real gain or a seasonal bump against prior year.
- Estimating feedback loop. Installed Cost per Square against target, month by month, tells you whether your bid assumptions are still true before the year ends.
- Quality and warranty control. R-Value Compliance, First-Pass Inspection Pass Rate and Callback / Rework Rate sit together, so a rise in callbacks can be read next to the inspection numbers that predict it.
- Reporting up to a GC or franchisor. The group roll-up on KPI Analysis gives one number per department, which is usually all an external reader wants.
- Setting next year’s targets. The Prior Year sheet and the vs PY columns give you the base you need to argue for a realistic target rather than a round-number one.
Frequently Asked Questions
Does it contain macros? No. It is a plain .xlsx with worksheet formulas only – VLOOKUP, MATCH, INDEX, COUNTIF and friends. There is no VBA, no Power Query, no Power Pivot and no add-in, so there is no security prompt and nothing to enable.
Which Excel versions does it work in? Excel 2013 and later on Windows, Excel for Mac, Microsoft 365, and Excel for the web. Dropdowns and charts behave the same way in all of them.
Does it pull data from my accounting or job-costing software? No, and the listing does not pretend otherwise. You type your monthly numbers onto the three input sheets. Both the MTD and the YTD figures are typed – the workbook does not derive year-to-date from the monthly cells – which is deliberate, because it lets you define YTD as a running total for volumes and a running average for rates, but it does mean you enter two numbers per KPI per month rather than one.
Can I change the KPIs to mine? Yes. KPI Definition is the master list and every other sheet reads from it. Rename, re-group, delete or add – there are 22 wired rows and 14 are used, so eight more KPIs need no formula work at all. To go beyond 22, select the last data row on each sheet and fill down. Insulation Contractor KPI Dashboard in Excel
Is this a safety or OSHA compliance system? No. Recordable Incident Rate (TRIR) is included as a headline KPI because insulation crews handle chemicals, work at height and wear respirators, but it is simply a number you type in each month. There is no incident log, no OSHA 300 or 300A form, no near-miss register and no corrective-action tracking. Keep your compliance records in whatever system you already use and report the rate here. Insulation Contractor KPI Dashboard in Excel
What is the difference between this and the Insulation Contractor KPI Scorecard? Different templates from different lines. The scorecard is a lighter ten-KPI file; this KPI Dashboard ships 14 KPIs, seven summary cards, a dedicated KPI Trend page with two combo charts, and a KPI Analysis page with a group roll-up and top/bottom five. Plenty of firms buy both – the scorecard for a quick weekly look, the dashboard for the monthly pack.
Is the sample data real? No. The 2025 figures are demonstration data generated for this template so that every chart, card and traffic light is populated when you open it. Delete it and type your own.
Are there any known cosmetic issues? Two worth knowing. The Read Me page’s “Cumulative or average YTD” row still carries example wording from another industry (“aircraft deliveries, non-conformance reports”) – the rule it describes is correct, the examples are simply not insulation ones, and you can edit that cell. And the Frequency column on KPI Definition (Daily / Weekly / Monthly) is a documentation label, not a switch: all 14 KPIs sit on the same monthly grid regardless of what it says.
About the Author
Built by the NextGenTemplates team, the same people behind PK: An Excel Expert – twenty years of building Excel, Power BI and Google Sheets reporting tools for businesses that need a working file today rather than a project next quarter. Every template ships with sample data, unlocked cells and plain formulas you can read and trace. Questions or a custom build: [email protected]. Insulation Contractor KPI Dashboard in Excel
Explore Related Templates
- Insulation Contractor KPI Scorecard in Excel – the same trade, the lighter ten-KPI scorecard line.
- Insulation Contractor KPI Scorecard in Google Sheets – the browser-based version of that scorecard.
- Masonry Contractor KPI Dashboard in Excel, Roofing Contractor KPI Dashboard in Excel and Carpentry Workshop KPI Dashboard in Excel – the same KPI Dashboard line for neighbouring trades.
- HVAC Contractor KPI Dashboard in Excel and Electrical Contractor KPI Dashboard in Excel – useful if you sub out or bundle mechanical and electrical work.
- Browse the KPI Dashboard category and the MS Excel category for the rest of the shelf.
Download it now – instant delivery, the .xlsx plus the Excel KPI Dashboard User Manual PDF, lifetime access to the file you buy, and every cell unlocked so it becomes yours the moment you open it. Insulation Contractor KPI Dashboard in Excel
Last updated: 01 September 2026.
Watch the demo video:
Compatibility and Requirements
- Works in Microsoft Excel desktop (Excel 2016 or later, or Microsoft 365). It has no macros, Power Query or add-ins.
- The month picker on the KPI Dashboard sheet and the KPI picker on the KPI Trend sheet are dropdown lists. Microsoft explains them in Create a drop-down list.
More Insulation Contractor KPI Templates
- Insulation Contractor KPI Dashboard in Power BI: the same dashboard for Power BI
- Insulation Contractor KPI Dashboard in Google Sheets: the browser-based version
Browse all Excel KPI dashboards.


































Reviews
There are no reviews yet.