

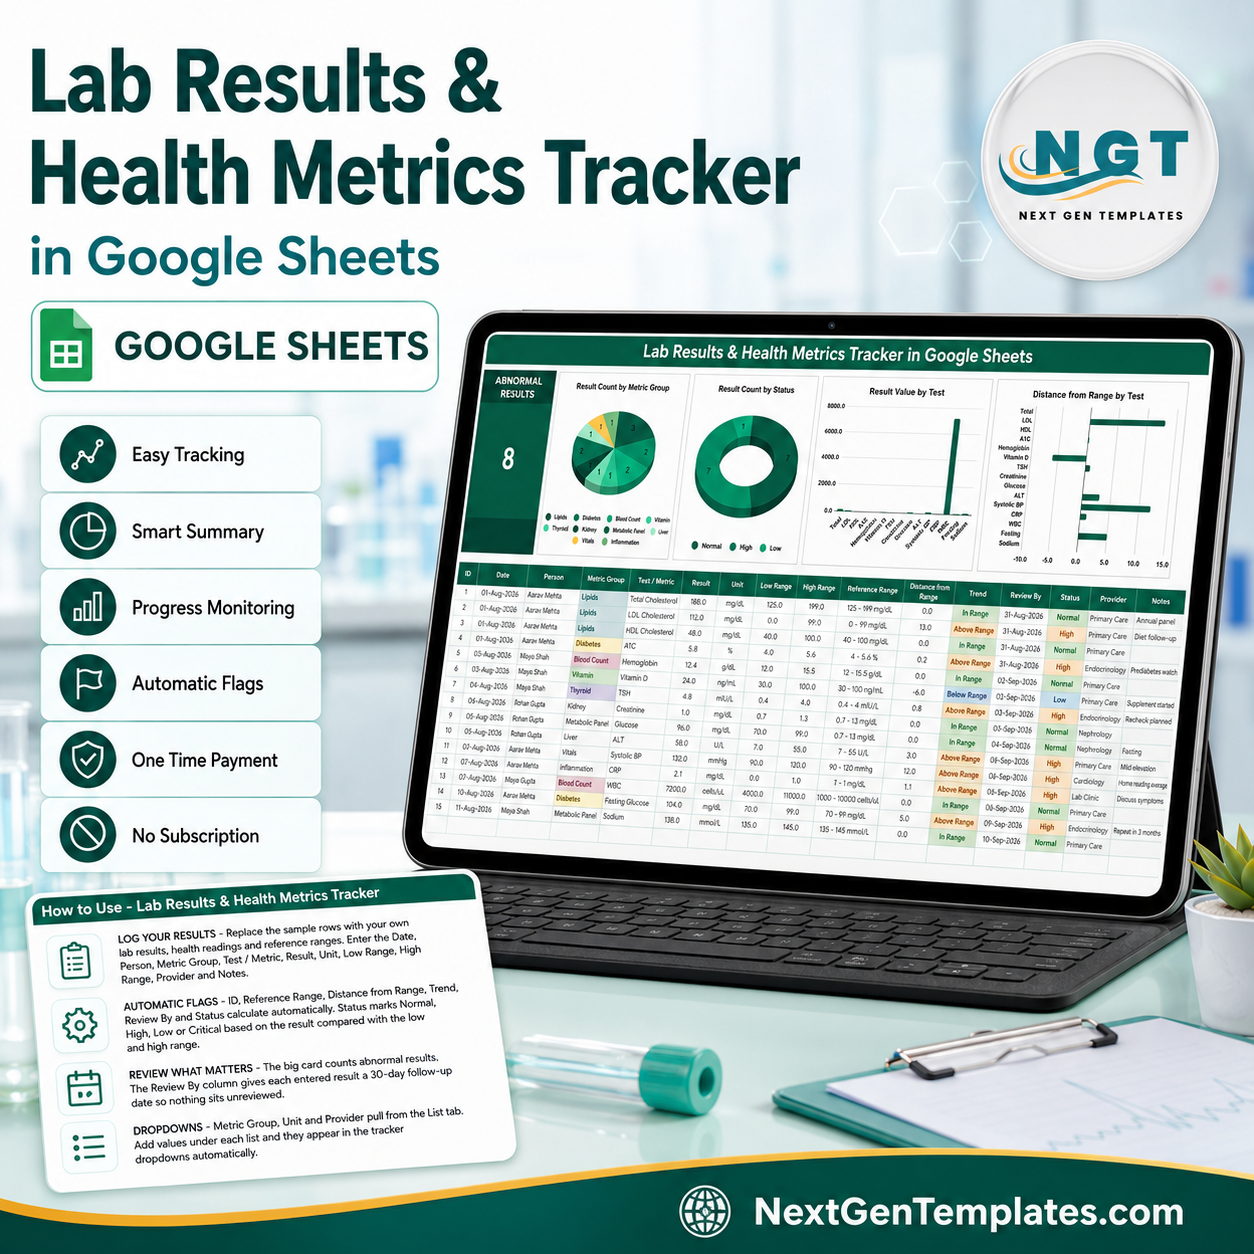

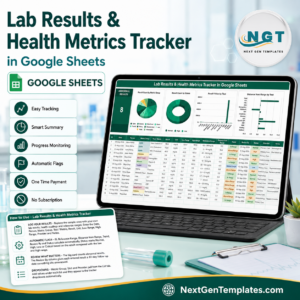
The Lab Results Tracker in Google Sheets gives you one page that holds every blood panel, vitamin level and home reading you have ever written down. It ships with 16 columns, 6 of them formula-driven, 4 live charts, 10 pre-loaded metric groups and room for 985 result rows before you touch a setting. Set-up takes about five minutes: click the copy link in your download, replace the 15 demo rows, and the abnormal-result count and charts move on their own.
Read this first. This is a spreadsheet for organising your own records. It is not a medical device, not diagnostic software, and it gives no medical advice. It does not know what any reference range should be and it never interprets a lab value – it only compares the number you typed against the Low Range and High Range you typed from your own report. Always discuss results with a qualified clinician.
One-time payment, no subscription, lifetime access, and you own the copy in your own Google Drive. Instant download after checkout.
Key Features of the Lab Results & Health Metrics Tracker in Google Sheets
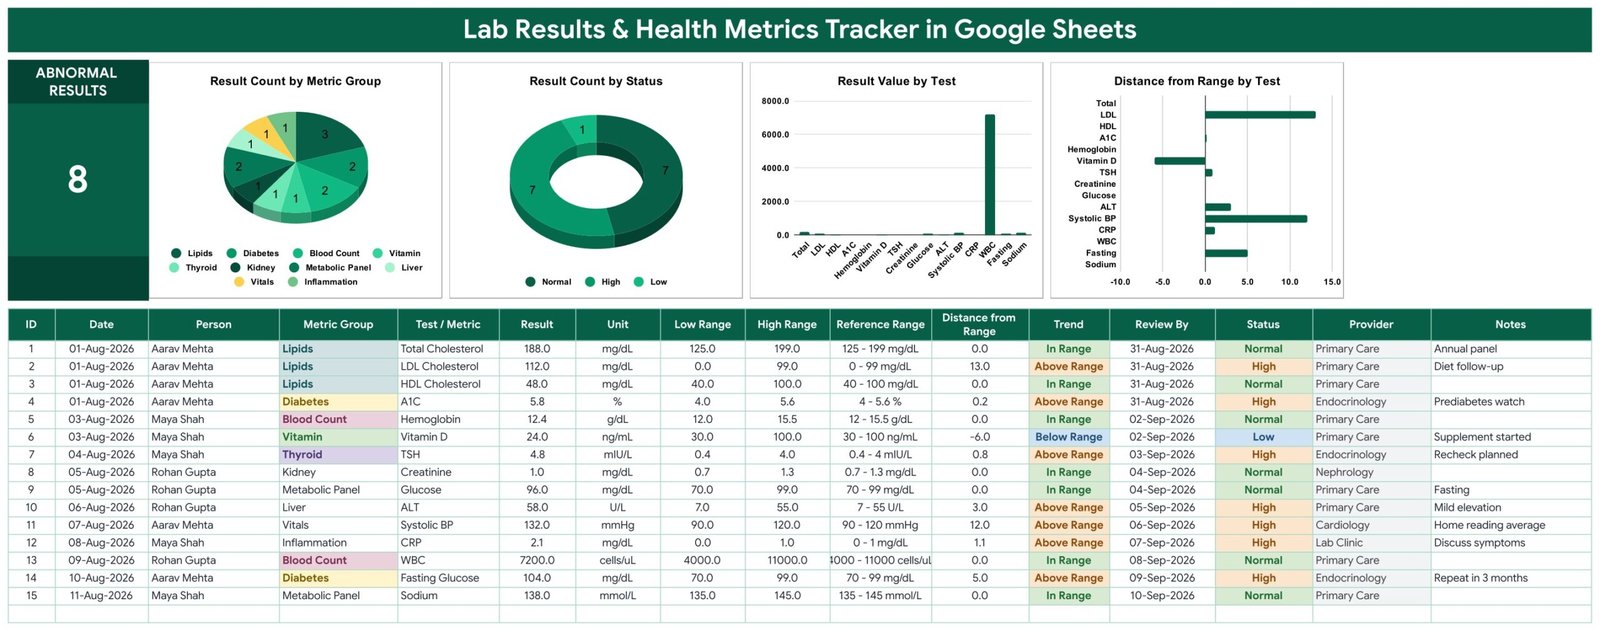
- Abnormal Results card – a single large counter at the top left that tallies every row whose Status is not Normal, so you can see at a glance how much of your history needs a conversation.
- Six columns that fill themselves – ID, Reference Range, Distance from Range, Trend, Review By and Status all calculate from what you enter. You type ten fields per result; the sheet writes the other six.
- Distance from Range – a signed number showing exactly how far a result sits outside the range you entered. It reads 0.0 when the value is inside your range, positive when it is above your High Range, negative when it is below your Low Range.
- Trend and Status flags – Trend reads In Range, Above Range or Below Range; Status colour-codes as Normal, High or Low. Both are plain comparisons against your own entered range, not a clinical assessment.
- Review By dates – every result gets an automatic follow-up date 30 days after the test date, so nothing sits in the file unreviewed.
- Four charts wired to the log – Result Count by Metric Group, Result Count by Status, Result Value by Test and Distance from Range by Test. They read rows 16 to 1000 directly, so there are no hidden helper tables to maintain.
- Multi-person logging – a Person column means one file can hold a whole household. Filter it and each person’s history stands alone.
- Auto-expanding dropdowns – Metric Group, Unit and Provider pull from the List tab, which is read to row 500. Type a new value under the list and it appears in the dropdown immediately.
- Ten metric groups pre-loaded – Blood Count, Metabolic Panel, Lipids, Diabetes, Thyroid, Vitamin, Kidney, Liver, Inflammation and Vitals, plus ten units from mg/dL to bpm.
- Google Sheets native – no macros, no add-ons, no install. It opens on desktop, phone and tablet, and you can share it with a family member using a normal Google link.
What’s Inside the Lab Results & Health Metrics Tracker
Tab 1 – Tracker. The whole product on one page. A green title banner, the Abnormal Results card, four charts in a row, and beneath them the result log. The log runs from row 16 to row 1000 and carries sixteen columns: ID, Date, Person, Metric Group, Test / Metric, Result, Unit, Low Range, High Range, Reference Range, Distance from Range, Trend, Review By, Status, Provider and Notes. Fifteen demo rows are supplied so every formula and colour rule is visible before you start.
Tab 2 – List. Four dropdown lists side by side: Metric Group, Unit, Status and Provider. Add a value under any list and the tracker picks it up without you editing a data-validation rule.
Tab 3 – Explore More Templates. A short index of related NextGenTemplates products and a welcome coupon.
Lab Results Tracker in Google Sheets vs. Excel vs. Paid Patient-Portal Apps – Where This Fits
| Feature | This Google Sheets tracker | DIY Excel workbook | Paid health-record app |
|---|---|---|---|
| Cost | One payment, no renewal | Your own build time | Typically a monthly or annual subscription |
| Platform | Google Sheets, browser or mobile app | Microsoft Excel desktop | Vendor’s own app and cloud |
| Setup time | About 5 minutes | Hours of formula and chart work | Account creation plus provider linking |
| Real-time sharing with family | Yes, standard Google share link | Only by emailing the file | Depends on the plan |
| Mobile access | Yes, no extra licence | Limited | Yes |
| You control the file | Yes, it lives in your Drive | Yes | No, the vendor hosts it |
| Editable columns and ranges | Every column and range is yours to change | Yes, if you built it | Rarely |
| Interprets your results for you | No, and it never claims to | No | Some do; this template does not |
| Regulated clinical storage | No – see the FAQ below | No | Varies by vendor |
Who This Template Is For – and Who It’s Not For
It is for anyone who leaves a lab appointment with a printout and nowhere sensible to put it: people managing a long-term condition who want one file instead of a folder of PDFs, carers keeping records for a parent, families tracking several people in one place, and anyone who wants to walk into an appointment with a clean, sorted history rather than a phone full of photographs.
It is not for clinics that need patient-record software. It is not a health record system for a practice, it is not an EHR, and it makes no HIPAA or GDPR compliance claim – a Google Sheet in your personal Drive is not regulated clinical storage, and you should not put another person’s medical data in it without their agreement. It is also not for anyone hoping the file will tell them what a result means. If you want an appointment-scheduling tool instead, the Patient Follow-Up Visit Calendar in Google Sheets is the better fit.
How to Use the Lab Results & Health Metrics Tracker
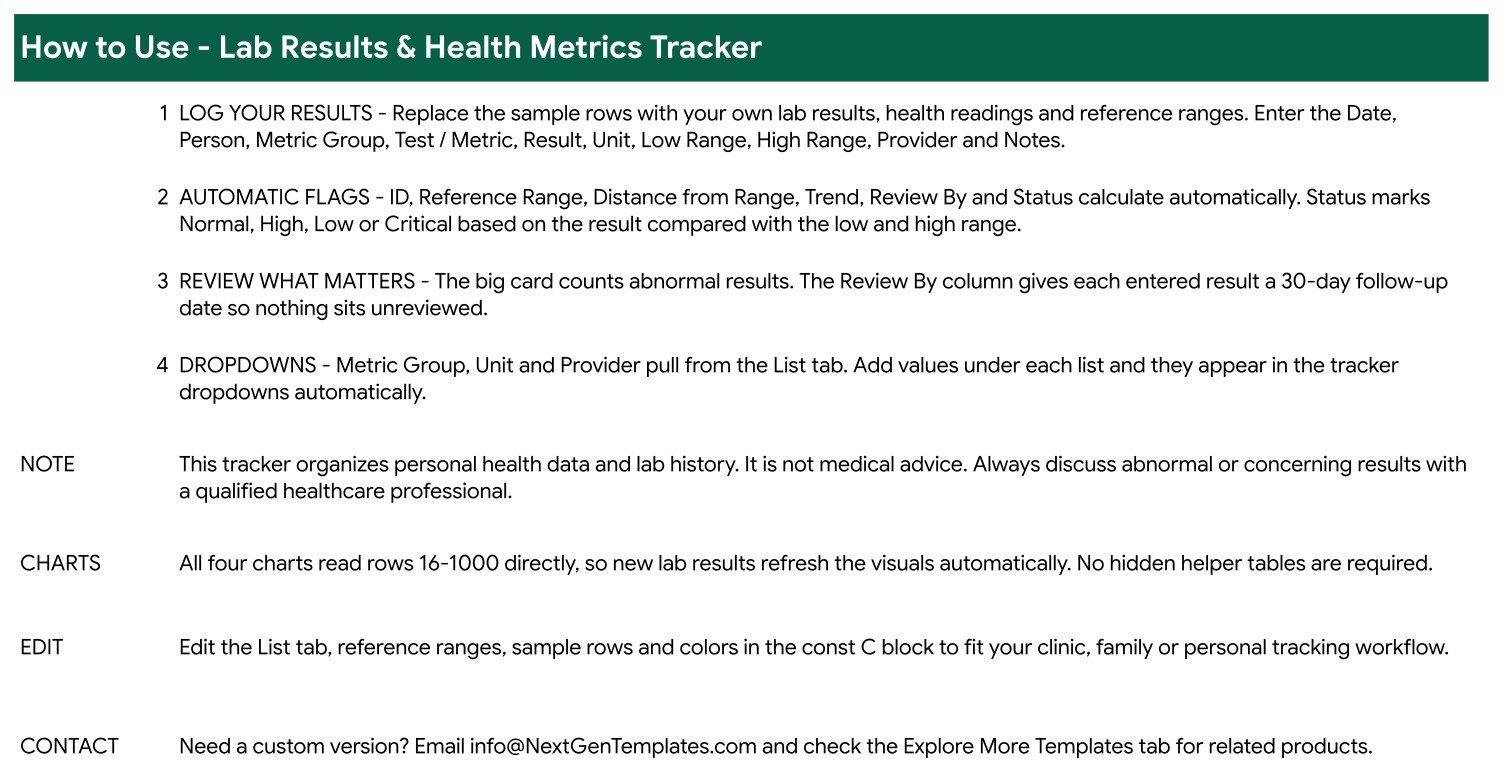
- Open your copy. Your download is a PDF containing the “Make a copy” link. Click it and an editable copy lands in your own Google Drive.
- Clear the demo rows. Fifteen sample rows ship with the file so you can see the flags working. Delete their contents once you have looked around – they are placeholders, not guidance.
- Enter one result per row. Fill Date, Person, Metric Group, Test / Metric, Result, Unit, Low Range, High Range, Provider and Notes. Copy the Low Range and High Range straight off your own lab report – the sheet has no opinion about what they should be.
- Let the six formula columns run. ID, Reference Range, Distance from Range, Trend, Review By and Status appear on their own.
- Work the Abnormal Results card. The counter shows how many rows are flagged. Sort or filter by Status, and take that shortlist to your clinician.
- Extend the lists. Add your own metric groups, units and providers under the List tab columns and they show up in the dropdowns straight away.
Real-World Use Cases
Priya, managing a thyroid condition. She has TSH results going back four years across two labs. She logs each one with the range printed on that lab’s own report, and the Result Value by Test chart finally shows the whole run in one line instead of six separate PDFs.
Daniel, caring for his father. Kidney and metabolic panels every quarter, three different specialists. The Person and Provider columns keep the record straight, and the Review By date tells him when the next set is due.
The Shah household. Three people, one file. Annual panels, vitamin levels and home blood-pressure averages all land in the same log, filtered by name when anyone has an appointment.
Frequently Asked Questions
Is this medical software? Does it interpret my results?
No, on both counts. It is a spreadsheet template. It is not a medical device, not diagnostic, and not a substitute for a clinician. It gives no medical advice and performs no interpretation of any lab value. The Status, Trend and Distance from Range columns are arithmetic comparisons against the Low Range and High Range you typed in from your own report – nothing more. It does not store, look up or recommend reference ranges, and a flag in this sheet means only “outside the numbers you entered”.
Is my data stored securely? Is it HIPAA or GDPR compliant?
The file lives in your own Google Drive under your own Google account, and nothing is sent to NextGenTemplates. But a personal spreadsheet is not regulated clinical storage and we make no HIPAA or GDPR compliance claim. Do not use it as a patient-record system, and only log another person’s health data with their consent.
Do the sample reference ranges apply to me?
No. The demo rows are illustrative filler so you can see the colour rules working. Reference ranges differ by laboratory, method, age and sex. Always copy the range from your own report and delete the sample rows before you rely on the file.
Does it send reminders when a result is due?
No. The Review By column writes a date 30 days after the test date so you can sort by it, but the sheet sends no email, no push notification and no alert of any kind. If you want a reminder, put that date in your calendar yourself.
Do I need Excel or any add-on?
Neither. It is a native Google Sheets file – no macros, no scripts, no extensions. It works in any browser and in the Google Sheets mobile app.
How many results can I log?
The log and all four charts are wired to row 1000, which is 985 rows after the 15 demo entries. You can extend the ranges yourself if you need more.
Can I add my own tests, units and providers?
Yes. Every dropdown reads the List tab down to row 500, so anything you add under a list appears in the tracker automatically. Colours, columns and the sample rows are all editable too.
What exactly do I download?
A PDF guide containing the “Make a copy” link for the Google Sheet. Click it and you get your own private, fully editable copy. There is no subscription and no recurring charge.
About the Author
Built by PK – Microsoft Certified Professional with 15+ years of Excel, Google Sheets, and Power BI experience. Founder of NextGenTemplates, reaching 300K+ subscribers across YouTube channels. Every template is hand-built and tested before release.
Explore Related Templates
If you keep a health log, these pair naturally with it:
- Blood Pressure Log Tracker in Google Sheets – for daily home readings between lab visits.
- Blood Sugar (Diabetes) Log Tracker in Google Sheets – fasting and post-meal glucose logging.
- Medication & Pill Tracker in Google Sheets – what you take, and when the refill runs out.
- Symptom & Pain Diary Tracker in Google Sheets – the day-to-day diary that sits beside the numbers.
- Body Measurements Tracker in Google Sheets – weight and measurement history over time.Lab Results & Health Metrics Tracker in Google Sheets
Browse the full Google Sheets template library or the Google Sheets Trackers category for more one-page tools.
Get your copy of the Lab Results & Health Metrics Tracker in Google Sheets today. One payment, instant download, lifetime access, and a template you can reshape to fit exactly how you and your clinician talk about your numbers. Read the full walkthrough on the NeoTechNavigators blog.Lab Results & Health Metrics Tracker in Google Sheets
Watch the step-by-step video Demo:
Last updated: 26 August 2026

















Reviews
There are no reviews yet.