

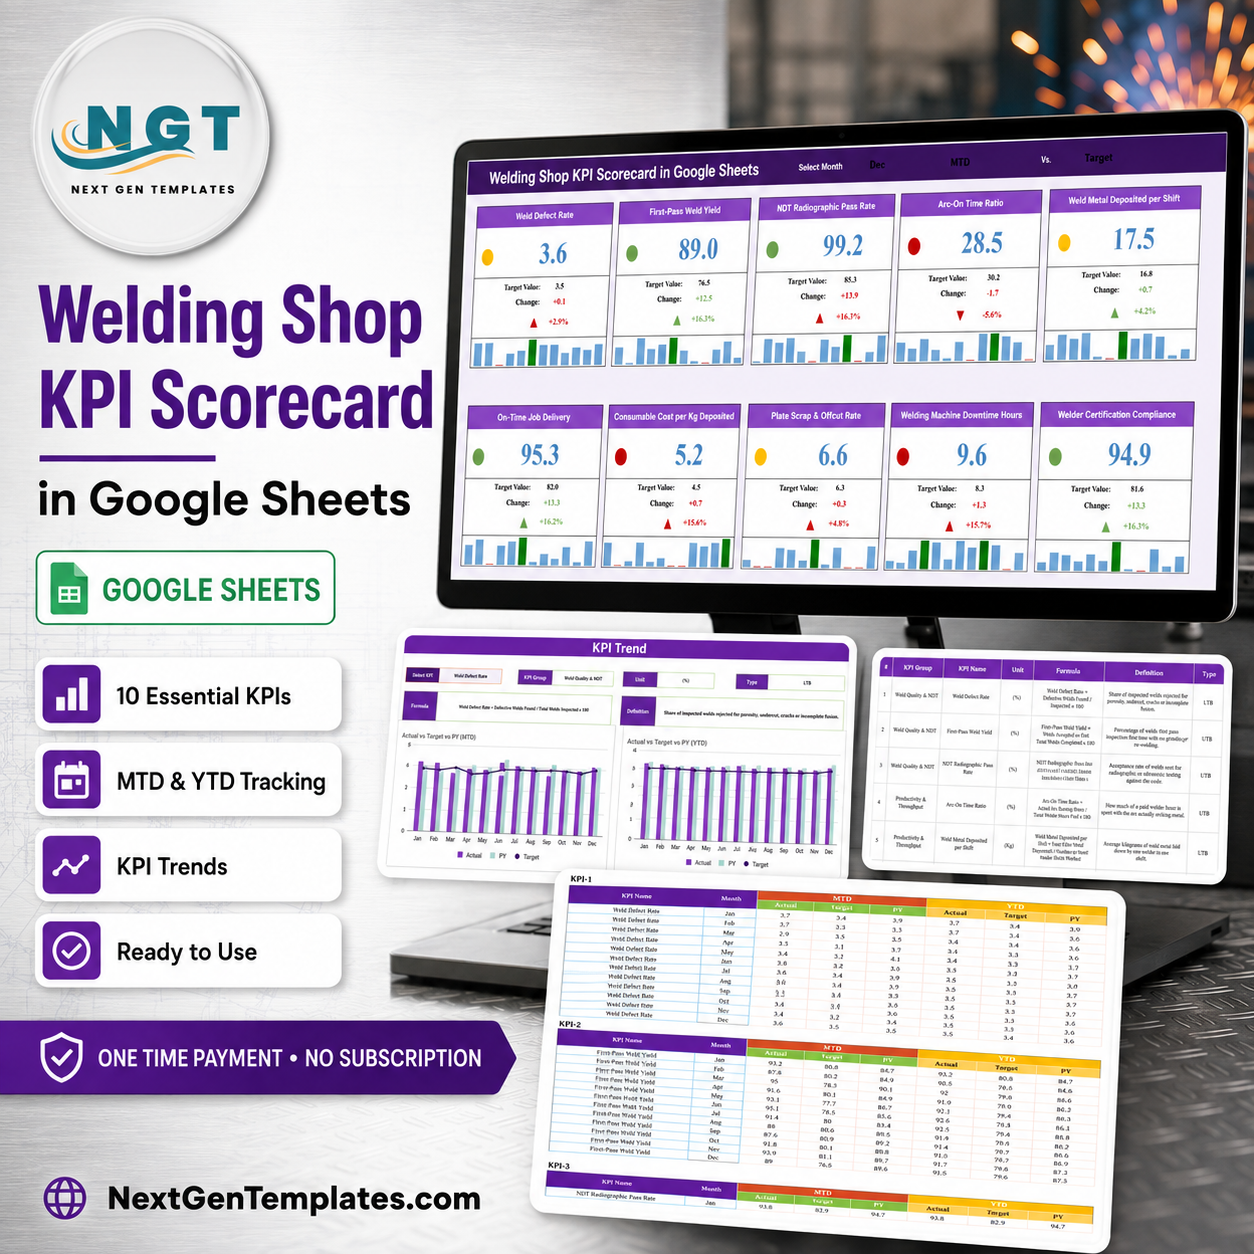

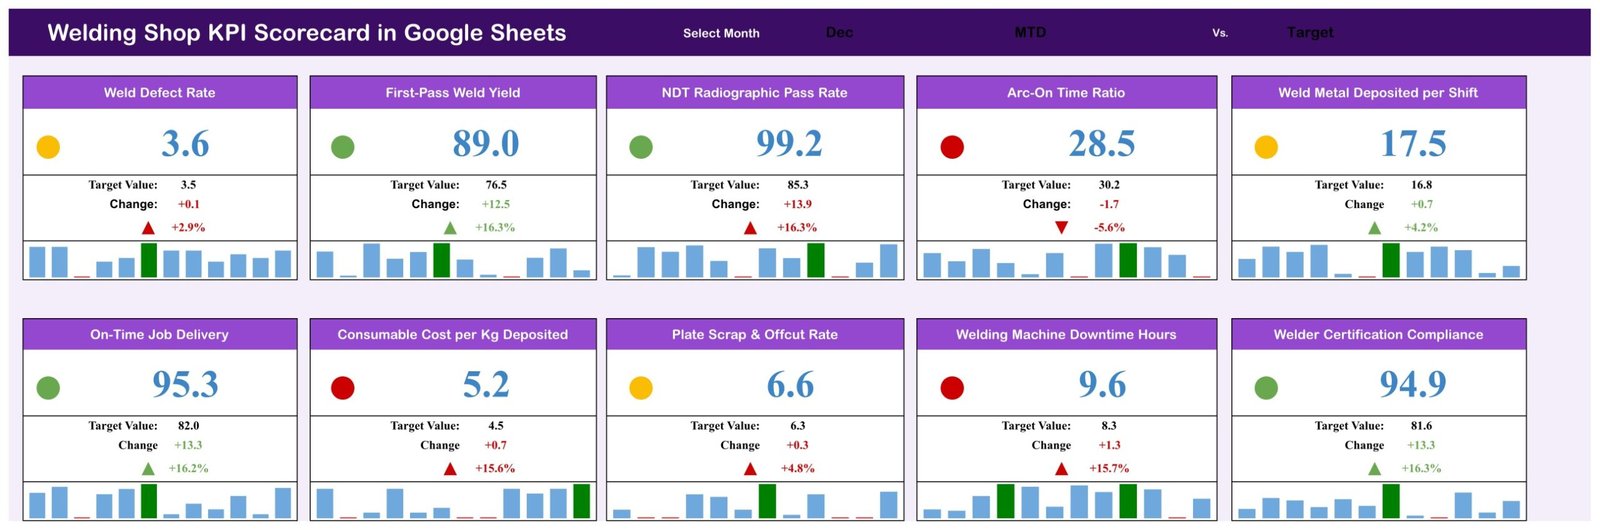
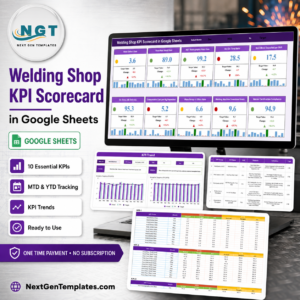
The Welding Shop KPI Scorecard in Google Sheets puts 10 fabrication KPIs on one screen, each scored against a target you set yourself. Pick a month from the header dropdown and every card refreshes at once: in the December sample, Weld Defect Rate reads 3.6% against a 3.5% target, First-Pass Weld Yield 89.0% against 76.5%, Arc-On Time Ratio 28.5% against 30.2%, and Welding Machine Downtime 9.6 hours against 8.3. A coloured dot on each card says green, amber or red at a glance, and a 12-month bar strip underneath shows whether the number is drifting. Four sheets, no add-ons, no subscription – one payment and the copy is yours forever. Your download is a PDF containing the “Make a copy” link, so an editable copy lands in your own Google Drive in about a minute.
This is the KPI Scorecard line – a month-picker scorecard with traffic lights, a KPI Trend page and a KPI Analysis page. It is not the analytical multi-chart dashboard line, and it is not the KPI Dashboard line. If you want charts that slice production by customer, job and welder, the Operational Efficiency KPI Dashboard in Google Sheets is the better fit. This one answers a narrower question: are my ten shop numbers on target this month, and which way are they moving?
Key Features of the Welding Shop KPI Scorecard in Google Sheets
- 10 welding-shop KPIs in 4 groups – Weld Quality & NDT (3), Productivity & Throughput (3), Cost & Consumables (2), and Safety, Equipment & Compliance (2).
- Month selector in the header – choose Dec, or any of the other eleven months, and all ten cards recalculate together.
- Red / amber / green status dot per KPI – the scorecard compares the month’s actual against the target you typed and colours the dot accordingly.
- Target value, absolute change and percentage change on every card – Consumable Cost per Kg Deposited shows 5.2 against a 4.5 target, +0.7, +15.6%.
- 12-month bar strip on each card with the selected month highlighted, so you see the run of the year without leaving the scorecard.
- Direction-aware scoring – each KPI is marked LTB (lower is better) or UTB (upper is better), so Weld Defect Rate and Consumable Cost are not punished for being small.
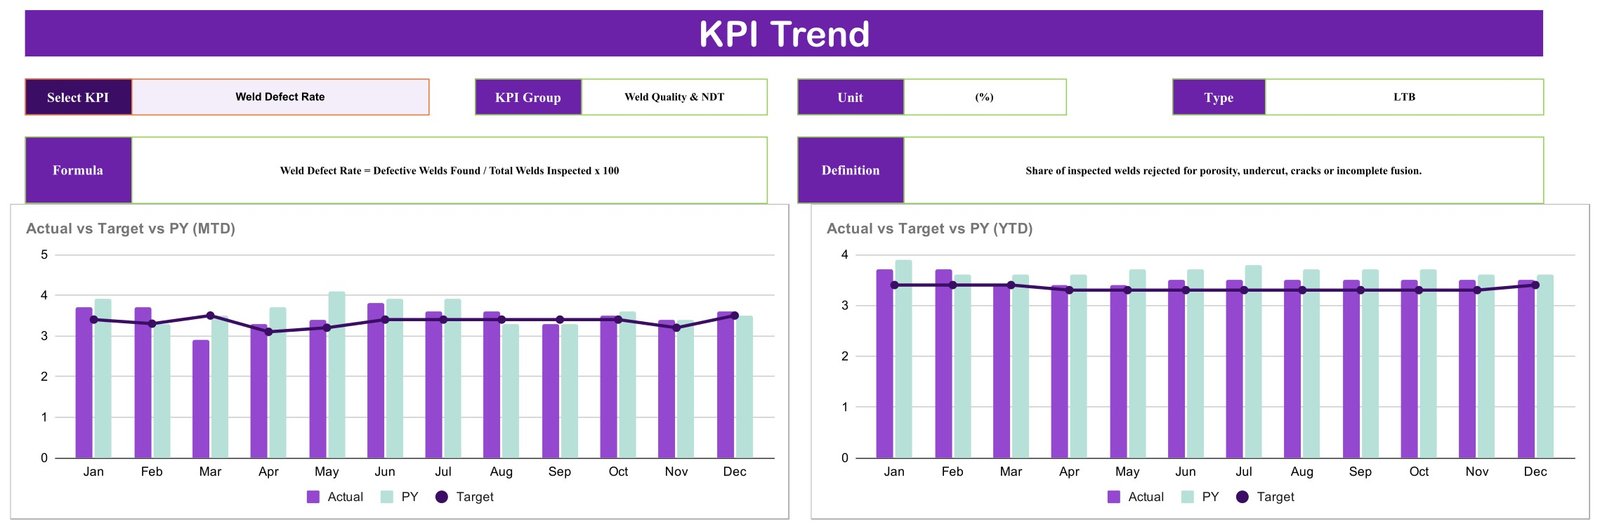
- KPI Trend page – pick one KPI from a dropdown and read its group, unit, type, formula and plain-English definition, next to two Jan-Dec charts.
- Actual vs Target vs PY, in MTD and YTD – the two trend charts plot this year’s actual, last year’s actual and the target line side by side.
- KPI Analysis page – a single reference table listing every KPI’s group, unit, formula and definition, so the shop agrees on what each number means.
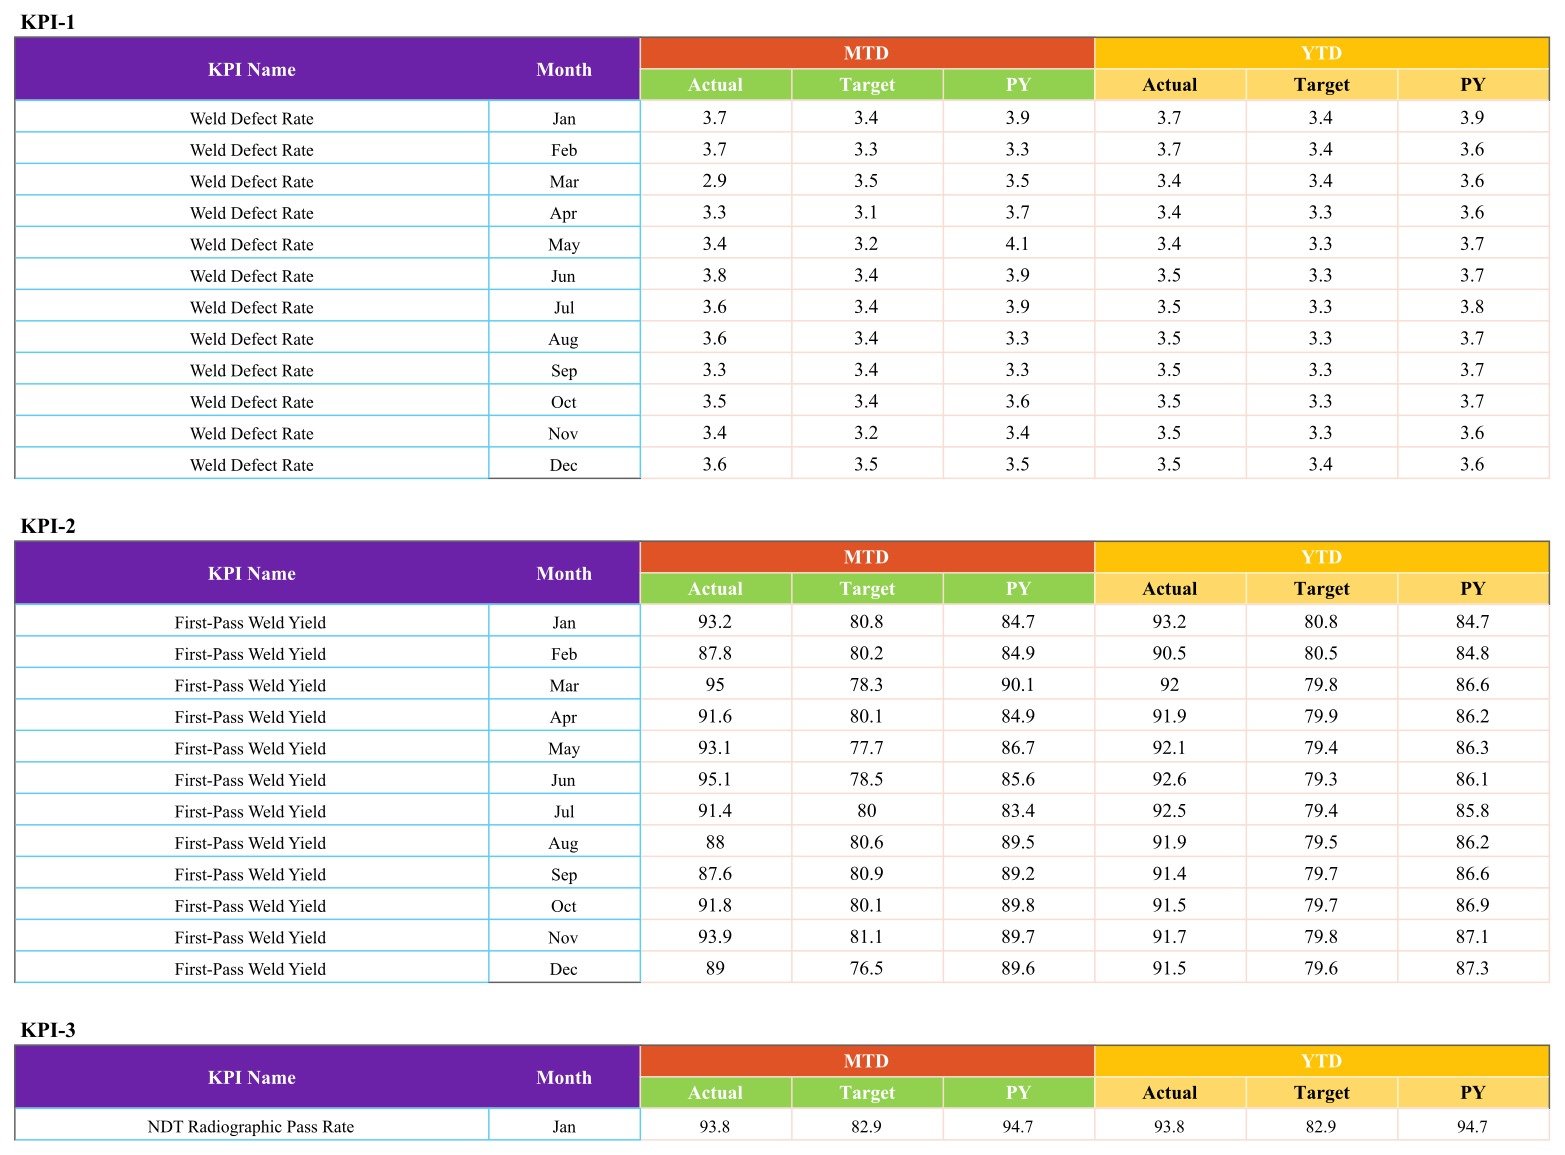
- One monthly data sheet – twelve rows per KPI holding MTD Actual/Target/PY and YTD Actual/Target/PY. Everything on the scorecard traces back to it.
- Native Google Sheets – share by link with your foreman or accountant, open it on a phone in the shop, and edit every KPI name, formula and target.
What’s Inside the Welding Shop KPI Scorecard in Google Sheets
Page 1 – KPI Scorecard. The header carries Select Month plus two switches that set the period (MTD) and what you are comparing against (Target). Below it sit ten cards in two rows of five: Weld Defect Rate, First-Pass Weld Yield, NDT Radiographic Pass Rate, Arc-On Time Ratio, Weld Metal Deposited per Shift, On-Time Job Delivery, Consumable Cost per Kg Deposited, Plate Scrap & Offcut Rate, Welding Machine Downtime Hours and Welder Certification Compliance.
Page 2 – KPI Trend. Select any KPI and the page fills in its KPI Group, Unit and Type, its formula – for example Weld Defect Rate = Defective Welds Found / Total Welds Inspected x 100 – and its definition. Two charts follow: Actual vs Target vs PY (MTD) and Actual vs Target vs PY (YTD), each running Jan to Dec.
Page 3 – KPI Analysis. The full ten-row definition table: number, KPI group, KPI name, unit, formula, definition and type. Print it and pin it up so “first-pass yield” means the same thing to everyone on the floor.
Page 4 – Data. One block per KPI, twelve monthly rows each, with MTD and YTD columns for Actual, Target and PY. This is the only sheet you type into.
Welding Shop KPI Scorecard in Google Sheets vs. an Excel Scorecard vs. Paid Shop-Floor Software
| This Google Sheets scorecard | The same scorecard in Excel | Paid shop-floor / MES software | |
|---|---|---|---|
| Cost | $8.99 one time | $9.99-$15.99 one time | $60-$250 per user per month |
| Platform | Google Sheets, any browser | Excel for Windows or Mac | Vendor cloud or on-premise server |
| Setup time | About 1 minute to copy, then type your numbers | Download and open | Weeks of configuration and training |
| Real-time team collaboration | Yes, built in | Only via OneDrive or SharePoint | Yes |
| Mobile access | Yes, Google Sheets app | Limited | Usually yes |
| Rename KPIs, formulas and targets | Yes, all editable | Yes, all editable | Often locked to the vendor’s model |
| Share with a link | Yes | No | Seat-based logins |
| Year-1 cost at 5 users | $8.99 | $9.99-$15.99 | $3,600-$15,000 |
| KPIs supplied out of the box | 10, grouped into 4 themes | 10, same structure | Hundreds, most of which you will not use |
| Where the numbers come from | You type them into the Data sheet each month | You type them in | Machine and ERP feeds |
That last row is the honest dividing line. This scorecard is a reporting sheet, not a data-collection system: nothing is pulled from your welding sets, your ERP or your accounting package. You enter ten numbers a month and the sheet does the scoring, the comparison and the charting.
Who This Template Is For – and Who It’s Not For
A good fit if you run a small or mid-size welding, fabrication or structural steel shop with 3-40 welders; you already collect defect counts, machine downtime and consumable spend somewhere but never see them together; you want a monthly management review pack you can open on a phone; or you want to hand your foreman one page instead of five spreadsheets.
Not a good fit if you need live machine-level data straight off the welding sets or a MES; you want job-by-job or welder-by-welder costing rather than shop-level monthly totals; you need document control for weld procedures, welder qualification records or inspection reports; or you want the sheet to raise alerts and send reminders. It does none of those – it scores ten numbers a month and shows you the trend.
How to Use the Welding Shop KPI Scorecard in Google Sheets
- Open the PDF in your download and click the “Make a copy” link. An editable copy lands in your Google Drive.
- Read the KPI Analysis page first. Check the ten formulas and definitions against how your shop already counts things, and reword any that do not match.
- Replace the sample numbers on the Data sheet with yours – twelve months of MTD and YTD Actual, Target and PY for each KPI. Your targets are yours to set; the sample values are placeholders.
- Set the month in the scorecard header and check the dots. Red and amber cards are your agenda for the monthly meeting.
- Use the KPI Trend page for anything that looks off, so you can see whether one bad month is a blip or a slide.
- Share the link with your foreman, QA lead and accountant. Set them to view-only if you want the Data sheet protected.

Real-World Use Cases
Ravi runs a 14-welder structural fabrication shop. He knew rework was eating his margin but could not say by how much. He now types four quality numbers a month; the Weld Defect Rate card sits amber at 3.6% against his 3.5% target, and the trend chart shows it has been within 0.5 points of target all year. That is enough to stop guessing and start arguing about the right thing.
Marta manages a pressure-vessel shop and reports to a board quarterly. She screenshots the scorecard page and the KPI Trend page for two KPIs into her pack. Ten minutes, and the board sees actual against target against last year rather than a wall of numbers.
Tom is a working owner-welder with three staff. He only cares about three cards – On-Time Job Delivery, Consumable Cost per Kg Deposited and Welding Machine Downtime Hours – so he renamed the other seven to suit his own jobs. The scorecard took the renames without breaking, because every label reads from the Data sheet.
Frequently Asked Questions
Does this template certify welders, qualify weld procedures or manage inspection records?
No – to all three. Welder Certification Compliance and NDT Radiographic Pass Rate are simply numbers you type in each month, exactly like the other eight. The sheet does not hold qualification records, does not track procedure qualification, does not store inspection reports and makes no claim about any code, standard or regulator. Keep using whatever system you already use for those; this is a management scoreboard sitting on top.
Does it pull data from my welding machines, ERP or accounting software?
No. There is no import, no connector and no sync. You type ten numbers into the Data sheet each month and the scorecard does the rest.
Can I change the KPIs to match my shop?
Yes. The KPI names, units, formulas, definitions, types and targets all live in the sheet and are yours to edit. If you want to score Nesting Efficiency instead of Plate Scrap & Offcut Rate, rename it and change the definition.
Do I need a paid Google Workspace account?
No. A free Google account is enough. Click “Make a copy” and the sheet is yours.
How is this different from your KPI Dashboards and analytical dashboards?
The scorecard line is a one-page grid of KPI cards with traffic lights plus a Trend page and an Analysis page. The KPI Dashboard and analytical dashboard lines are chart-led and slice data by dimension. Many shops buy one of each; they answer different questions.
Will it send me alerts when a KPI goes red?
No. Nothing is emailed, notified or scheduled. You open the sheet and look.
Can my team edit it at the same time?
Yes – it is a normal Google Sheet, so link sharing, comments and simultaneous editing all work as usual.
About the Author
Built by PK – Microsoft Certified Professional with 15+ years of Excel, Google Sheets, and Power BI experience. Founder of NextGenTemplates, reaching 300K+ subscribers across YouTube channels. Every template is hand-built and tested before release.
Explore Related Templates
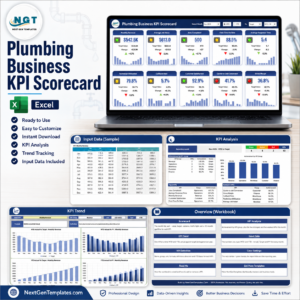
- Plumbing Business KPI Scorecard in Excel – the same scorecard engine for a different trade, if you prefer Excel.
- Equipment Maintenance Log Tracker in Google Sheets – the log that feeds your Welding Machine Downtime Hours figure.
- Daily Production Output Tracker in Google Sheets – day-level output behind the monthly throughput numbers.
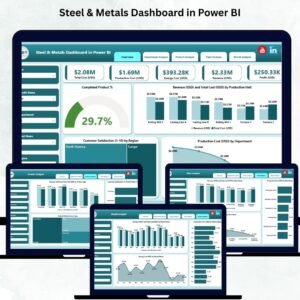
- Steel & Metals Dashboard in Power BI – the chart-led view for a larger metals operation.
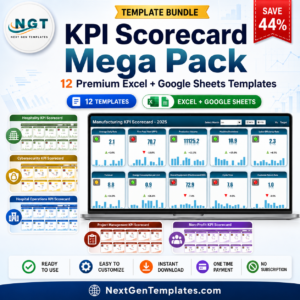
- KPI Scorecard Mega Pack – 12 scorecards in Excel and Google Sheets if you manage several departments.
- Browse the full Google Sheets KPI Dashboard category or every Google Sheets template.
Get your welding shop onto one page. One payment, no subscription, and the copy is yours to edit forever. Add to cart, open the PDF, click “Make a copy” and start typing your December numbers.
Watch the step-by-step video Demo:
Last updated: 23 August 2026.


























Reviews
There are no reviews yet.