

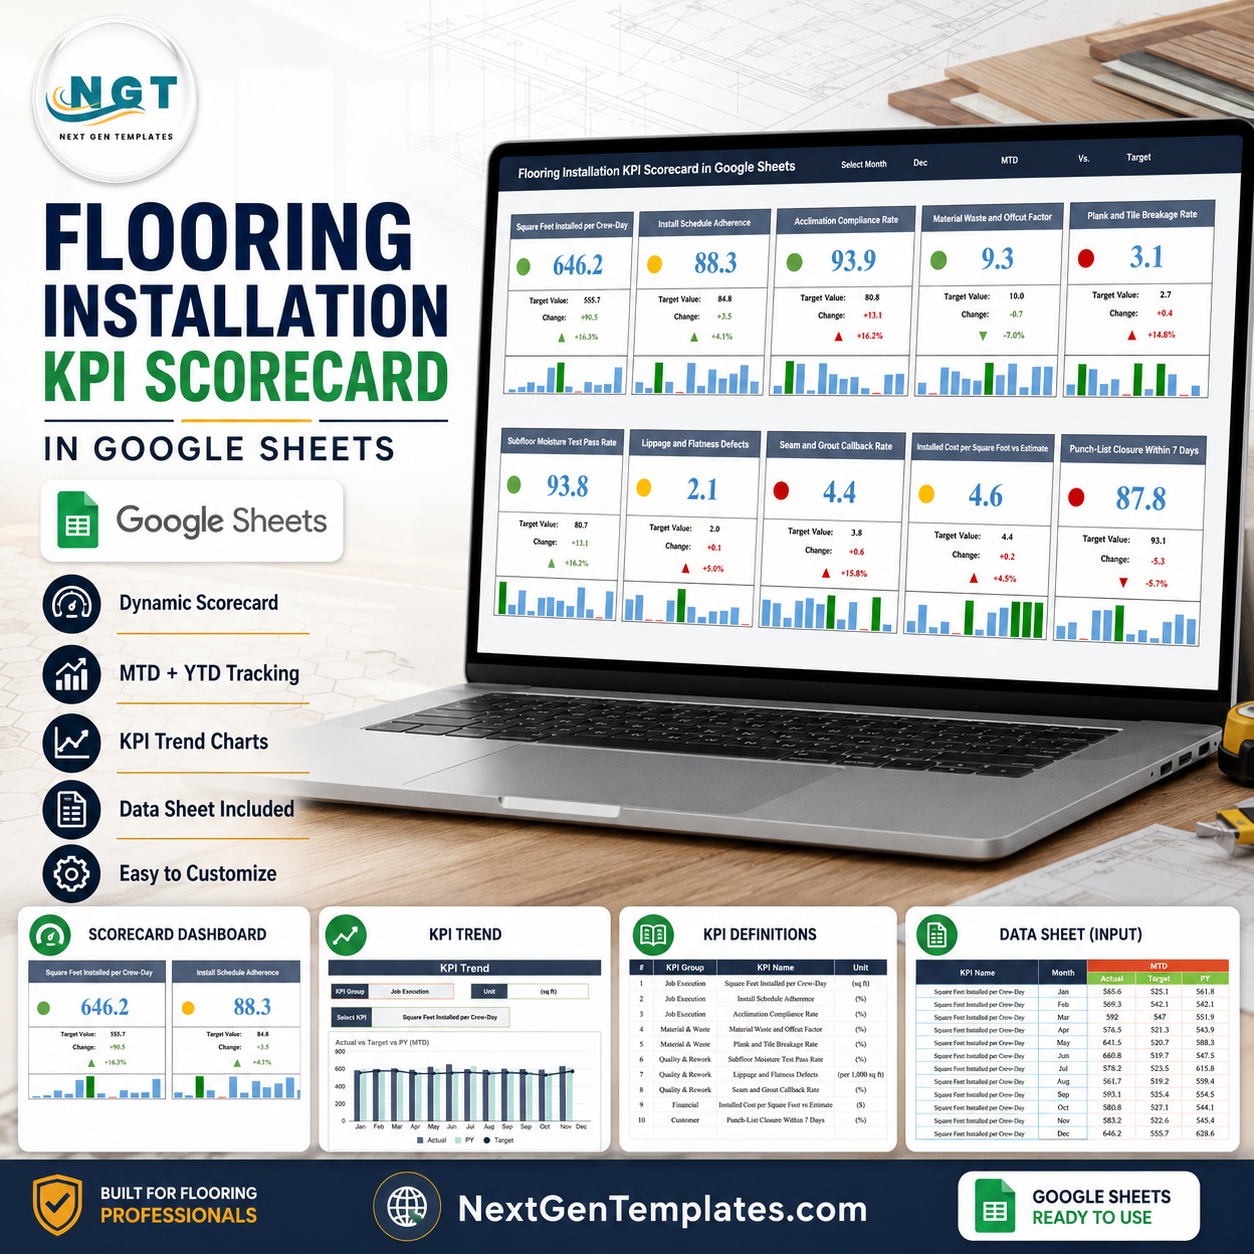

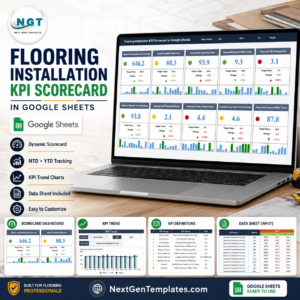
The Flooring Installation KPI Scorecard in Google Sheets puts 10 flooring KPIs on one page, scores each of them green, amber or red against that month’s target, and lets you switch the whole board from January to December with a single dropdown. It is a scorecard, not an analytics dashboard: four sheets, no add-ons, no subscription and no macros. Instant download, 4 pages of screenshots below so you can see exactly what you get, and a PDF that carries the “Make a copy” link straight into your own Google Drive.
Key Features of the Flooring Installation KPI Scorecard in Google Sheets
- 10 flooring installation KPIs on one screen – grouped as Job Execution, Material & Waste, Quality & Rework, Financial and Customer.
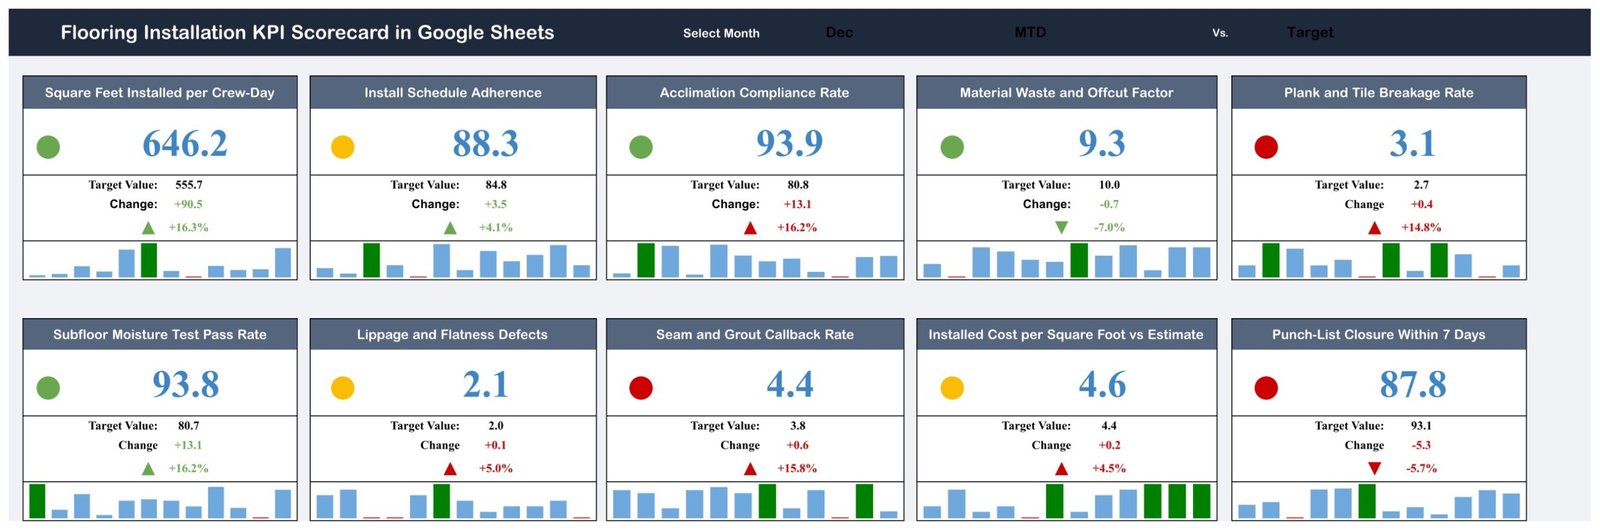
- Month picker in the header – “Select Month” moves the entire scorecard from Jan to Dec; every card, target and arrow follows it.
- MTD or YTD, versus Target or versus prior year – two more header dropdowns switch the comparison basis for all 10 cards at once.
- Traffic-light scoring – a green, amber or red dot on every card, judged against that month’s target rather than a fixed number.
- Direction-aware logic – each KPI is typed UTB (upper the better) or LTB (lower the better), so Material Waste at 9.3% against a 10.0% target reads as a win, not a miss.
- Target, change and % move on every card – the December board shows Square Feet Installed per Crew-Day at 646.2 against a 555.7 target, +90.5 and +16.3%, with an up arrow.
- 12-month mini bar chart inside each card – the whole year’s shape without leaving the scorecard.
- KPI Trend page – pick any KPI and get two charts, Actual vs Target vs PY on an MTD basis and the same again on a YTD basis, Jan to Dec.
- KPI Definition sheet – all 10 KPIs written out with group, unit, formula and a plain-English definition.
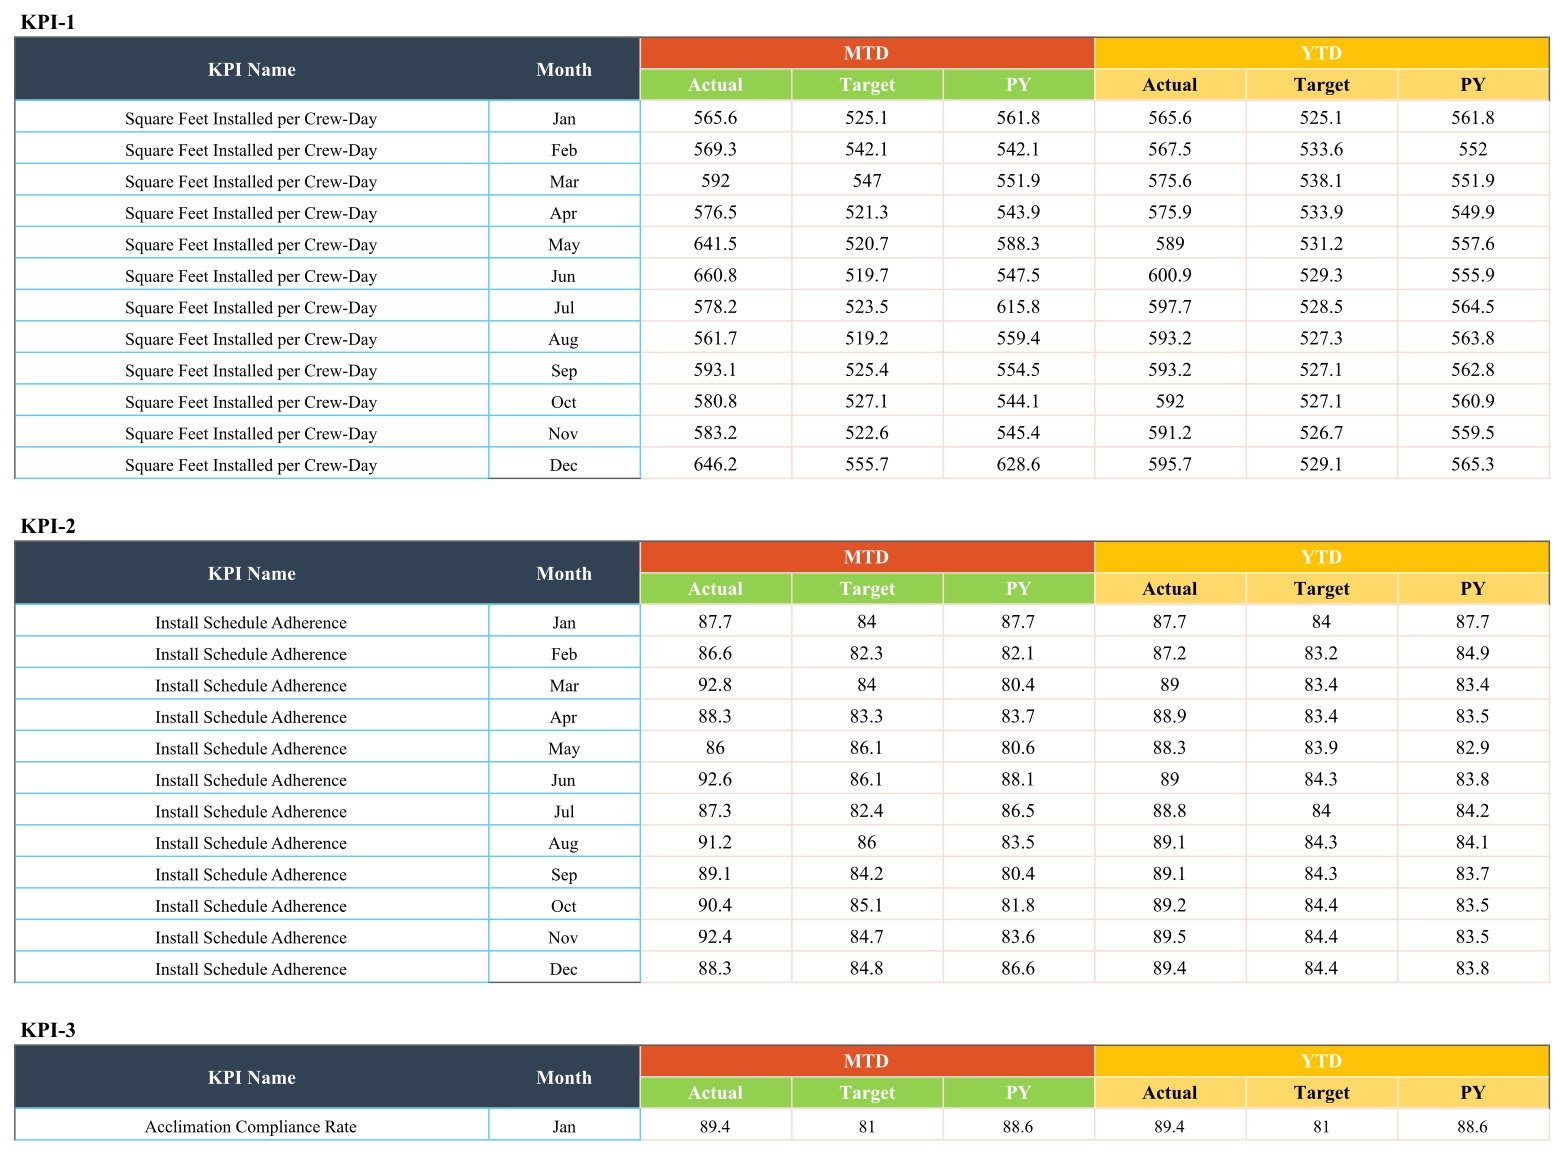
- One data sheet to type into – twelve monthly rows per KPI with MTD and YTD columns for Actual, Target and prior year.
What’s Inside the Flooring Installation KPI Scorecard in Google Sheets
1. KPI Scorecard. The front page. A dark header carries the title and three controls – Select Month, MTD/YTD and Vs. Target/PY – and beneath them sit ten cards in two rows of five: Square Feet Installed per Crew-Day, Install Schedule Adherence, Acclimation Compliance Rate, Material Waste and Offcut Factor, Plank and Tile Breakage Rate, Subfloor Moisture Test Pass Rate, Lippage and Flatness Defects, Seam and Grout Callback Rate, Installed Cost per Square Foot vs Estimate, and Punch-List Closure Within 7 Days. In the sample December month the board reads 4 green, 3 amber and 3 red – the shape a real month usually has.
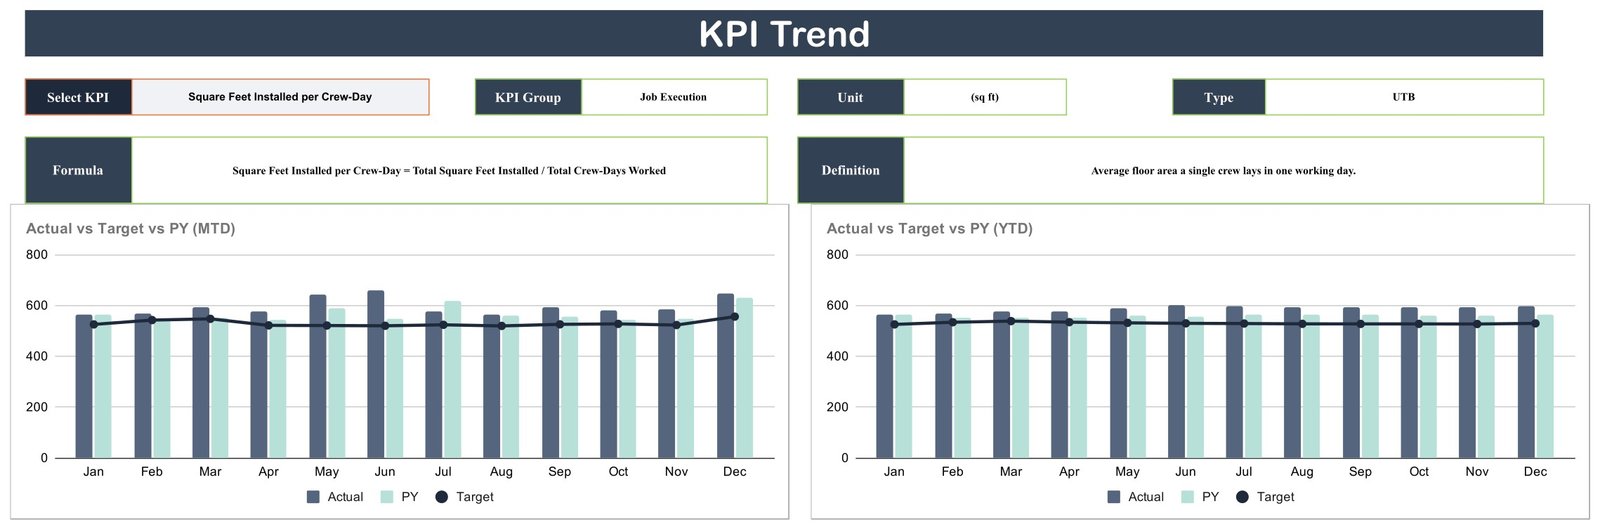
2. KPI Trend. Choose a KPI from the “Select KPI” dropdown and the page fills in its group, unit and type, its formula and its definition, then draws two charts side by side: Actual vs Target vs PY (MTD) and Actual vs Target vs PY (YTD), both across Jan to Dec. Actual and prior-year sit as bars, target runs as a line over the top.
3. KPI Definition. A ten-row reference table – number, KPI group, KPI name, unit, formula and definition, plus the UTB/LTB type. Units on this build are square feet, percentages, defects per 1,000 sq ft and dollars, so the sheet tells you what each number is measured in before you enter anything.
4. KPI Analysis (the data sheet). One sheet holds every number. Each KPI gets its own block – KPI-1, KPI-2, KPI-3 and so on – with twelve monthly rows and six value columns: MTD Actual, Target and PY, then YTD Actual, Target and PY. Type your figures over the sample rows and the scorecard and trend charts recalculate.

Flooring Installation KPI Scorecard in Google Sheets vs. Excel vs. Paid Construction Software – Where This Fits
| This scorecard (Google Sheets) | Excel KPI scorecard | Paid field-service / construction software | |
|---|---|---|---|
| Cost | One payment, $8.99 on sale | One payment, typically $15-$20 | $40-$120 per user per month |
| Platform | Google Sheets in any browser | Microsoft Excel desktop | Vendor web app plus mobile app |
| Setup time | Copy the sheet, type your figures – under an hour | Similar, once Excel is installed | Days to weeks, plus onboarding |
| Real-time team collaboration | Yes, native to Google Sheets | Only through OneDrive co-authoring | Yes |
| Mobile access | Google Sheets app, read and edit | Excel mobile, limited | Yes, purpose-built |
| Customisable KPIs and targets | Yes – rename any KPI, retype any target | Yes | Usually only on higher tiers |
| Share with a link | Yes | File send or cloud link | Seat-based access |
| Year-1 cost at 5 users | $8.99 | $15-$20 plus Office licences | $2,400-$7,200 |
| Traffic-light scoring against target | Built in on all 10 cards | Built in | Yes, usually configurable |
| Job scheduling and invoicing | No – this is a measurement sheet | No | Yes |
Who This Template Is For – and Who It’s Not For
It is for flooring contractors running two to twenty crews who already know their numbers but have never put them side by side; installation managers who want one monthly page for the owner’s meeting; estimators comparing installed cost per square foot against what was quoted; and quality leads chasing lippage, moisture and callback numbers month over month.
It is not for anyone who needs live job scheduling, crew dispatch, invoicing or estimating – this sheet does none of that and does not connect to software that does. It does not import data automatically; you or your office manager type the monthly figures in. It will not tell you whether an installation meets a manufacturer’s warranty conditions or any industry standard, and the KPI names and targets in the file are sample values you are expected to replace with your own.
How to Use the Flooring Installation KPI Scorecard in Google Sheets
- Open the PDF in your download and click the “Make a copy” link. The scorecard lands in your own Google Drive – the original stays untouched.
- Open the KPI Definition sheet and read the ten formulas. Rename any KPI that does not match how your business measures, and change its unit if you need to.
- Go to the KPI Analysis sheet. Replace the sample MTD and YTD figures with your own, month by month, for Actual, Target and prior year.
- Return to the KPI Scorecard, pick a month, and check the traffic lights. Switch the header to YTD, then to “Vs. PY”, to see the same month from three angles.
- Open KPI Trend, select the KPI that came up red, and look at the twelve-month picture before you decide it is a real problem rather than one bad month.
- Share the sheet with your team from the Share button and keep it as the monthly performance record.
Real-World Use Cases
Marcus, owner of a 14-crew hardwood and LVP installer. He was judging crews on square feet alone. With the scorecard he found the highest-output crew also carried the worst Plank and Tile Breakage Rate, at 3.1% against a 2.7% target, and moved the handling training to that crew first.
Priya, installation manager at a tile and stone contractor. She runs the monthly review off two pages: the scorecard for the traffic lights and KPI Trend for anything red. Seam and Grout Callback Rate at 4.4% against 3.8% was the December talking point.
Dan, estimator for a commercial flooring firm. He watches one card – Installed Cost per Square Foot vs Estimate, sitting at $4.6 against a $4.4 target – and uses the twelve-month bar chart in the card to decide whether his rates need rebuilding or whether one job skewed the month.
Frequently Asked Questions
Is this the same as your Flooring and Tiles KPI Dashboard?
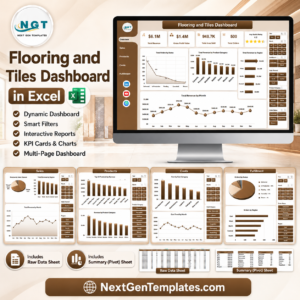
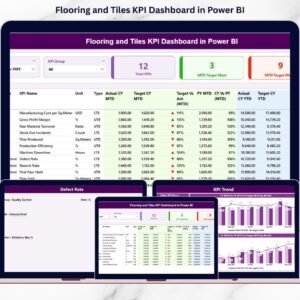
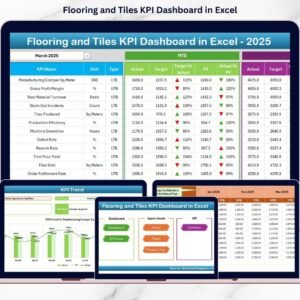
No. This is the scorecard line – a month-picker board of KPI cards with traffic lights, plus a KPI Trend page, a KPI Definition sheet and one data sheet. The Flooring and Tiles KPI Dashboard in Excel and the Flooring and Tiles Dashboard in Excel are different builds with different KPI sets, and they cover the flooring and tiles trade more broadly rather than installation performance.
Do I need Excel or any add-on?
No. It is plain Google Sheets. It opens in any browser, on Windows, Mac, Chromebook, iPad or Android, and nothing has to be installed. There are no macros and no Apps Script to authorise.
Does it pull data from my job software automatically?
No. The KPI Analysis sheet is typed in by hand or pasted from whatever report you already run. Nothing in this file connects to estimating, accounting or field-service systems.
Can I change the KPIs?
Yes. Rename any of the ten in the KPI Definition sheet, change the unit, rewrite the formula text and set your own monthly targets. The UTB/LTB type is what tells the traffic lights whether higher or lower is the good direction, so set that correctly when you swap a KPI out.
Can more than 10 KPIs be tracked?
The scorecard is laid out for ten cards in two rows of five, and the KPI Analysis sheet has one block per KPI. Adding an eleventh means extending both sheets by hand – straightforward in Sheets, but it is not a one-click change.
Is the sample data real?
No. Every figure in the file – the 646.2 square feet per crew-day, the 93.9% acclimation compliance, all of it – is demonstration data so the charts and traffic lights have something to draw. Replace it with yours.
Will this prove my installs meet manufacturer or industry requirements?
No. It records numbers you type. Moisture-test pass rates, acclimation compliance and flatness readings in this file are management measures for your own review; they are not certification, warranty evidence or a compliance record of any kind.
About the Author
Built by PK – Microsoft Certified Professional with 15+ years of Excel, Google Sheets, and Power BI experience. Founder of NextGenTemplates, reaching 300K+ subscribers across YouTube channels. Every template is hand-built and tested before release.
Explore Related Templates
Same trade, other platforms and depths: the Flooring and Tiles KPI Dashboard in Excel, the Flooring and Tiles KPI Dashboard in Power BI and the analytical Flooring and Tiles Dashboard in Excel. If you need the operational side rather than the measurement side, look at the Carpet and Flooring Business Management System Web App or the Construction Project Management System Web App. In Google Sheets, the Construction Dashboard in Google Sheets, the Renovation Request Tracker in Google Sheets and the Home Renovation Budget and Project Tracker in Google Sheets sit alongside this one. To see the scorecard format applied elsewhere, the Solar Energy KPI Scorecard in Google Sheets is the same build on a different industry. Browse the whole Google Sheets KPI Dashboard category or all Google Sheets templates.
Get the Flooring Installation KPI Scorecard in Google Sheets today. Download instantly, click the copy link inside the PDF, and have your first month scored before the end of the afternoon. A full walkthrough is on the blog: Flooring Installation KPI Scorecard in Google Sheets.
Watch the step-by-step video Demo:
Last updated: 23 August 2026.

























Reviews
There are no reviews yet.