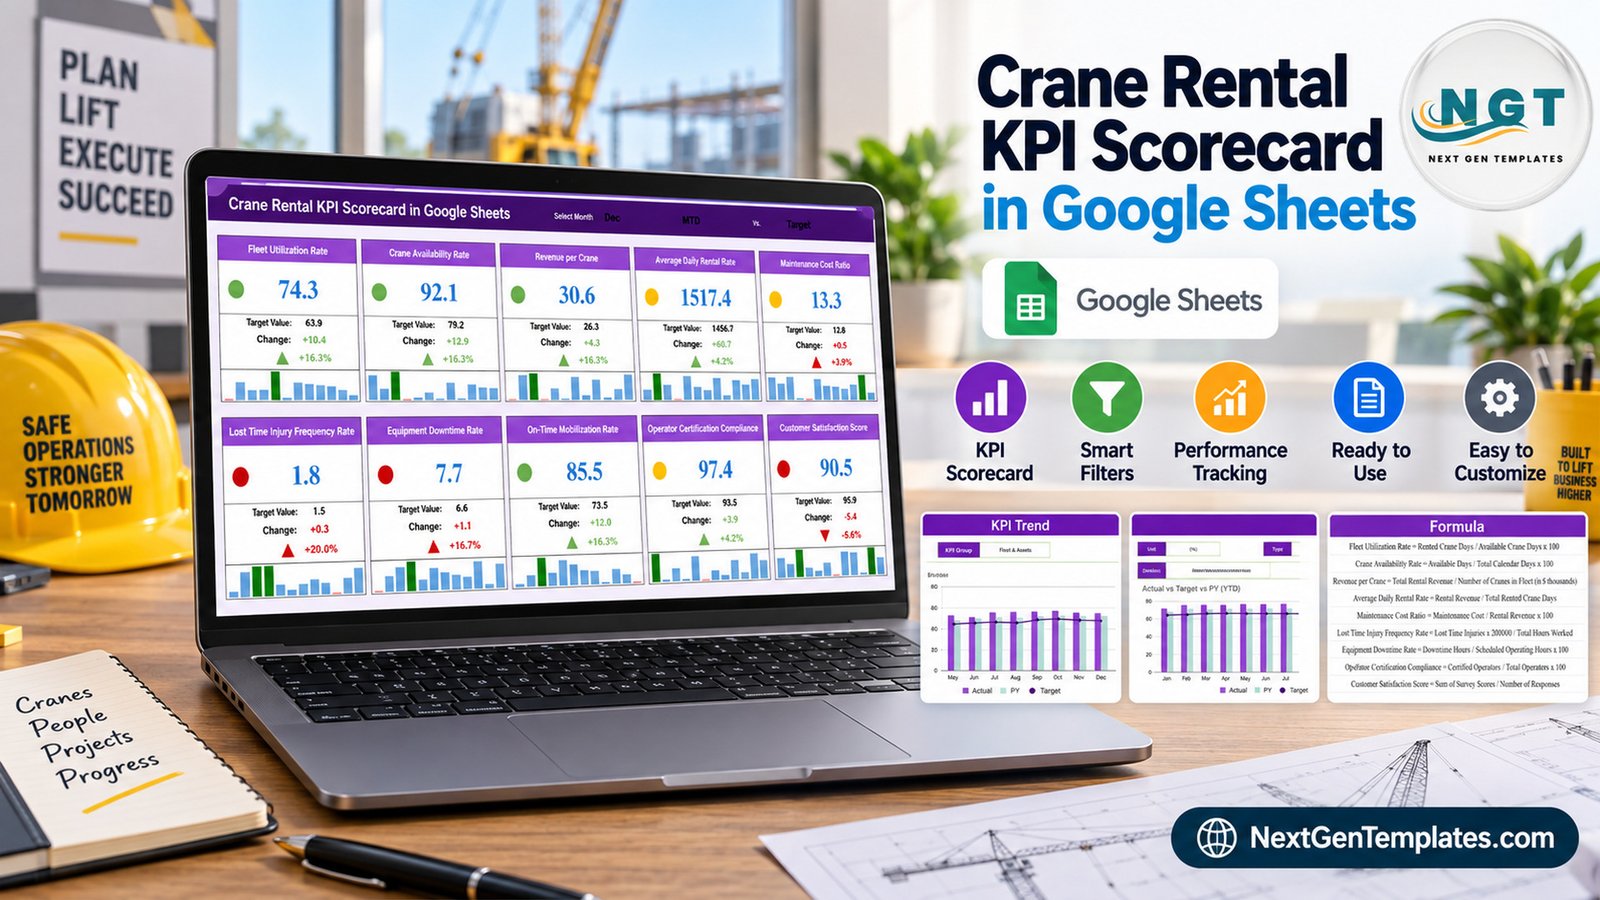
The Crane Rental KPI Scorecard in Google Sheets tracks 10 crane-hire KPIs across 4 pages, scores each one against a monthly target with a red / amber / green light, and carries 12 months of MTD and YTD history with prior-year comparison for every metric. Pick a month from the header and all 10 cards, both trend charts and the whole data page move with it. Setup takes under 10 minutes: open the copy, type your own numbers over the sample rows, and every card recalculates.
🌎 Join 8,400+ teams in 40+ countries using NextGenTemplates to replace paid SaaS tools with one-time-purchase Excel, Google Sheets, Power BI and HTML templates.
✅ Instant download · One-time payment · No subscription · No per-user fees · Lifetime access
⚠️ Read this first: this is a reporting spreadsheet for numbers you type in. It is not an inspection, certification or compliance tool. See What this template does not do below.
🔑 Key Features of the Crane Rental KPI Scorecard in Google Sheets
🎯 10 crane-hire KPIs, already defined. Fleet Utilization Rate, Crane Availability Rate, Revenue per Crane, Average Daily Rental Rate, Maintenance Cost Ratio, Lost Time Injury Frequency Rate, Equipment Downtime Rate, On-Time Mobilization Rate, Operator Certification Compliance and Customer Satisfaction Score. Each one ships with its formula, its unit and a written definition.
🗃️ Five KPI groups. The 10 metrics are filed under Fleet & Assets (3), Financial (2), Operations (2), Safety & Compliance (2) and Customer (1), so a fleet manager and a finance lead can each read their own block without wading through the rest.
🚦 Traffic lights driven by target attainment, not opinion. Every card carries a coloured dot. Green means the actual is at least 110% of target, amber means it sits between 95% and 110%, and red means below 95%. Lower-is-better metrics such as Equipment Downtime Rate and Lost Time Injury Frequency Rate are scored the other way round, so a rising downtime figure goes red rather than green.
📈 Two directions of history on every KPI. Month-to-date and year-to-date are stored separately, each with Actual, Target and prior-year (PY) columns for all 12 months. Nothing is hard-coded into a chart, because the charts read the same table you edit.
🔁 A month picker that actually drives the page. The header carries Select Month, an MTD selector and a Vs. Target comparison label. Change the month and the scorecard restates itself.
🧮 UTB / LTB typing. Each KPI is tagged Upper-The-Better or Lower-The-Better, which is what tells the scoring logic which direction counts as good. You can retype a target, change a threshold, or add your own KPI without touching a script, because there are no macros and no add-ons.
📦 What is inside
Four pages ship in the file. None of them is a “Get More Templates” advertising page, all four are working pages, and all four are shown below.
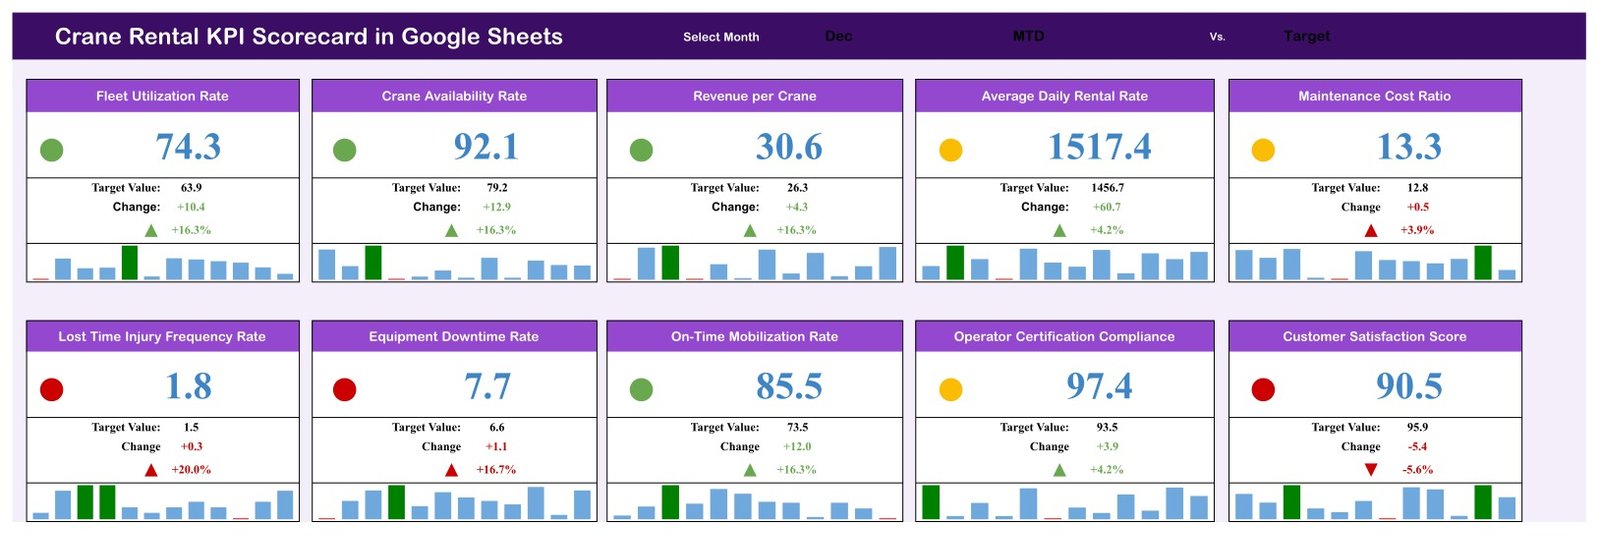
Page 1: Crane Rental KPI Scorecard
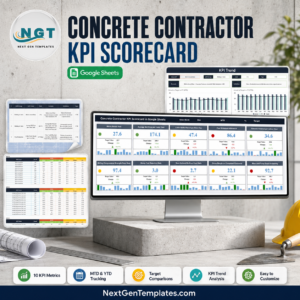
The scorecard page. A header strip carries Select Month (showing Dec in the sample), the MTD selector and the Vs. Target label, then 10 KPI cards sit in two rows of five. Each card shows the status dot, the current value, the Target Value, the absolute Change, the percentage change with a direction arrow, and a 12-month sparkline. In the demo data Fleet Utilization Rate reads 74.3 against a 63.9 target (+10.4, +16.3%, green) while Customer Satisfaction Score reads 90.5 against 95.9 (-5.4, -5.6%, red).
Page 2: KPI Trend
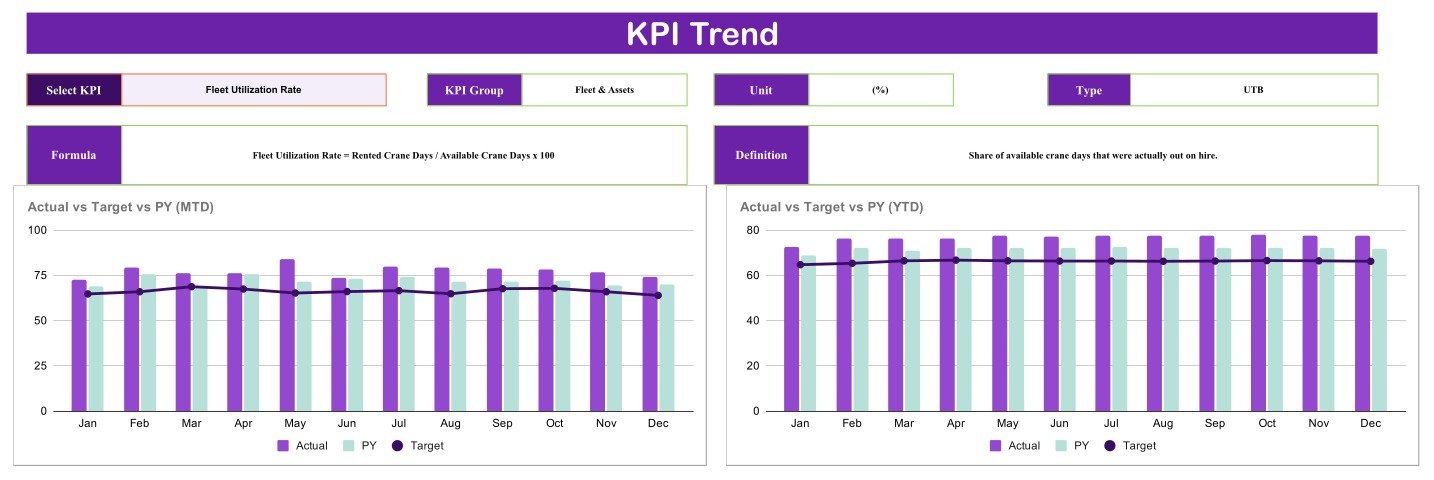
A single-KPI drill-down. Pick a KPI and the page fills in its KPI Group, Unit, Type, Formula and Definition, then draws two 12-month grouped column charts: Actual vs Target vs PY (MTD) and Actual vs Target vs PY (YTD). Actual and PY are columns, Target is a line across the top.
Page 3: KPI Definitions
The dictionary behind the scorecard, one row per KPI with its number, KPI Group, KPI Name, Unit, Formula, Definition and Type. This is where you rename a metric or rewrite a formula, and every other page picks the change up.

Page 4: KPI Data
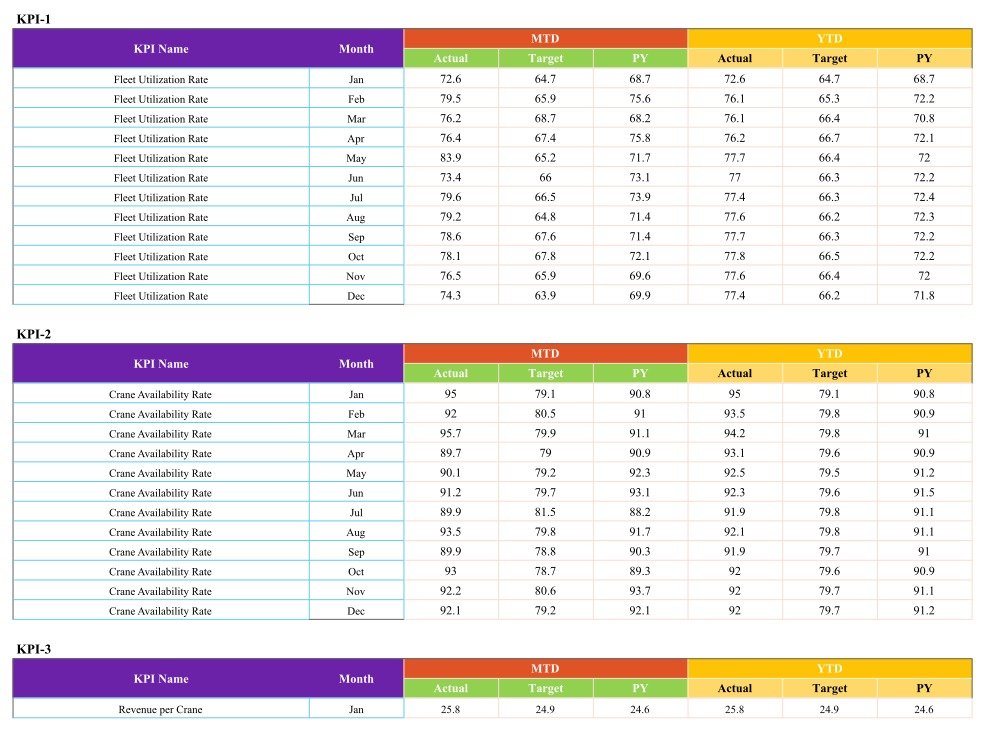
The entry sheet. One 12-month block per KPI, labelled KPI-1 to KPI-10, each with Month plus MTD Actual / Target / PY and YTD Actual / Target / PY. This is the only page you type into: replace the sample figures month by month and the scorecard and the trend charts follow.
📊 Crane Rental KPI Scorecard vs. an Excel scorecard vs. crane-rental SaaS
| Feature | Crane Rental KPI Scorecard (Google Sheets) | Excel scorecard workbook | Crane / equipment rental SaaS |
|---|---|---|---|
| Cost | $8.99 one-time ✅ | One-time | Recurring subscription, quoted per site |
| Platform | Google Sheets, browser, nothing to install ✅ | Microsoft Excel licence needed | Vendor-hosted web app |
| Setup time | Under 10 minutes ✅ | Under 10 minutes | Days to weeks, usually with onboarding |
| Real-time team collaboration | Built in, multiple editors at once ✅ | Only via OneDrive co-authoring | Yes ✅ |
| Mobile access | Google Sheets mobile app ✅ | Excel mobile app | Yes ✅ |
| Customisable KPIs and formulas | Fully open, edit any formula ✅ | Fully open ✅ | Limited to what the vendor exposes |
| Share with a link | Yes, native Google sharing ✅ | File send or OneDrive link | Per-seat login |
| Year-1 cost at 5 users | $8.99 total ✅ | One-time plus Office licences | Recurring, per seat or per site |
| Dispatch, contracts, invoicing, inspection records | Not included, reporting only | Not included | Yes ✅ |
For a crane hire firm that wants a monthly management scorecard without paying for rental software it does not yet need, this template sits in the sweet spot, and if you outgrow it the SaaS is still there.
👥 Who this template is for and who it is not for
✅ Built for:
- Owners and operations managers at crane hire and lifting-services firms running roughly 3 to 60 machines
- Plant and fleet managers who already pull utilisation and downtime numbers by hand each month
- Finance leads who want revenue per crane and maintenance cost ratio on the same page as utilisation
- Depot managers preparing a monthly or quarterly performance pack for a board or a parent company
❌ Not for:
- Anyone who needs an inspection, thorough-examination or certification record, because this template produces none and must never be used as one
- Firms wanting live telematics, GPS or load-cell feeds, because every number here is typed in by hand
- Dispatch, hire contracts, load charts, lift planning or invoicing, because this is a reporting layer and not an operating system
- Teams that need row-level permissions or an audit trail, because Google Sheets sharing is file-level
⚙️ How to use it
- Open the PDF in your download and click the “Make a copy” link to create your own editable copy in Google Drive.
- Go to Page 3 and rename any KPI, unit, formula or definition that does not match how your depot measures things.
- On Page 4, replace the sample MTD and YTD figures for each KPI, month by month, and set your own Target and prior-year columns.
- Return to Page 1, pick a month in the header, and check that the cards and dots read the way you expect.
- Use Page 2 to pull one KPI apart against target and prior year before your monthly review.
- Share the file with your depot team using Google’s normal sharing controls.
⚠️ What this template does not do
Cranes are lifting equipment under strict statutory regimes, so this needs saying plainly. This file is a Google Sheets reporting template over data the buyer types in. It does not certify, inspect, test or prove the condition of any crane, hoist, sling, rigging or lifting accessory. It does not establish compliance with OSHA 1926 subpart CC, ASME B30, LOLER, PUWER, EN 13000, CPCS or NCCCO operator certification, any thorough-examination regime, or any local lifting or plant regulation. It is not a lift plan, a load chart, a ground-bearing assessment, a maintenance record of legal standing, or an inspection or test certificate, and it does not replace a competent person’s statutory duties.
Every figure in the screenshots above, including the safety, downtime and certification-compliance numbers, is demo data supplied to show the layout. A KPI such as Operator Certification Compliance reports only what somebody typed into Page 4. None of it is evidence that a crane is safe to lift. Keep your statutory records in whatever system your regulator and insurer require.
💼 Real-world use cases
Marcus runs a 14-crane hire yard in the Midlands. He fills in Page 4 on the first working day of each month and takes Page 1 straight into his Monday operations meeting, because the amber dot on Maintenance Cost Ratio starts the conversation faster than a spreadsheet of raw invoices.
Priya is finance director at a lifting-services group with three depots. She keeps one copy per depot, compares Revenue per Crane and Average Daily Rental Rate across the three, and uses the YTD chart on Page 2 to show the board where the year is actually landing against plan.
Dan is the plant manager at a mid-sized contractor with its own cranes. He does not hire out at all, so he deletes the two financial KPIs on Page 3, replaces them with two of his own, and uses the rest as an internal utilisation and downtime scorecard.
❓ Frequently asked questions
Does this certify our cranes or make our lifting operations compliant?
No. The Crane Rental KPI Scorecard in Google Sheets is a management reporting template over numbers you type in. It issues no inspection, examination, test or certification record, it proves nothing about the condition of any crane, and it satisfies no lifting regulation. Statutory inspection and certification stay entirely with your competent person and your existing records.
Are the numbers in the screenshots real crane data?
No. Every value on all four pages is fictional sample data, there only to show the layout and the traffic-light behaviour. Delete it and enter your own figures on Page 4. No figure in this template is measured, imported or verified by the file.
Which 10 KPIs does it track?
Fleet Utilization Rate, Crane Availability Rate, Revenue per Crane, Average Daily Rental Rate, Maintenance Cost Ratio, Lost Time Injury Frequency Rate, Equipment Downtime Rate, On-Time Mobilization Rate, Operator Certification Compliance and Customer Satisfaction Score, grouped into Fleet & Assets, Financial, Operations, Safety & Compliance and Customer.
Why is a KPI amber when it is above its target?
The bands run on attainment against target: green from 110%, amber from 95% to 110%, red below 95%. So Operator Certification Compliance at 97.4 against a 93.5 target shows amber even though it beats target, because amber means close to target rather than missed. Widen or narrow the bands if you prefer a simple pass or fail.
Is this the same as a Crane Rental KPI Dashboard?
No. A scorecard grades a fixed set of KPIs against monthly targets with a red, amber or green verdict. A KPI dashboard is an analytical page built around charts and slicers to explore data. They are different products and many customers keep both.
How long does setup take, and do I need add-ons?
Under 10 minutes for the first month once you have your figures. There are no macros, no Apps Script and no add-ons, just plain Google Sheets formulas, so it runs in any browser on a free Google account.
Can I add or remove KPIs?
Yes. Page 3 is the definition table and Page 4 holds one 12-month block per KPI. Rename a metric, swap its formula, change its unit, or flip its Upper-The-Better or Lower-The-Better type, and the scorecard and trend pages follow.
👤 About the author
Built by PK, a Microsoft Certified Professional with 15+ years of Excel, Google Sheets and Power BI experience. Founder of NextGenTemplates, reaching 300K+ subscribers across YouTube channels (@PKAnExcelExpert, @NextGenTemplates, @NeoTechNavigators). Every template is hand-built and tested before release.
🔗 Explore related templates
- Scaffolding Services KPI Scorecard in Google Sheets, the same scorecard engine for access and scaffold hire.
- Masonry Contractor KPI Scorecard in Google Sheets, a site-trade edition of the same monthly format.
- Heavy Machinery Dashboard in Google Sheets, the analytical counterpart if you want slicers and charts rather than a graded scorecard.
- Fleet Maintenance Calendar in Google Sheets, which pairs well for planning the service dates behind your downtime numbers.
Browse more Google Sheets templates or the full range of Google Sheets KPI dashboards and scorecards.
An Equipment Rental Business KPI Scorecard in Google Sheets is currently being prepared and will be listed shortly. It covers a mixed hire fleet rather than cranes specifically.
Watch the step-by-step video Demo:
🎥 Visit our YouTube channel for step-by-step video tutorials
👉 YouTube.com/@NextGenTemplates
📅 Last updated: September 2026