

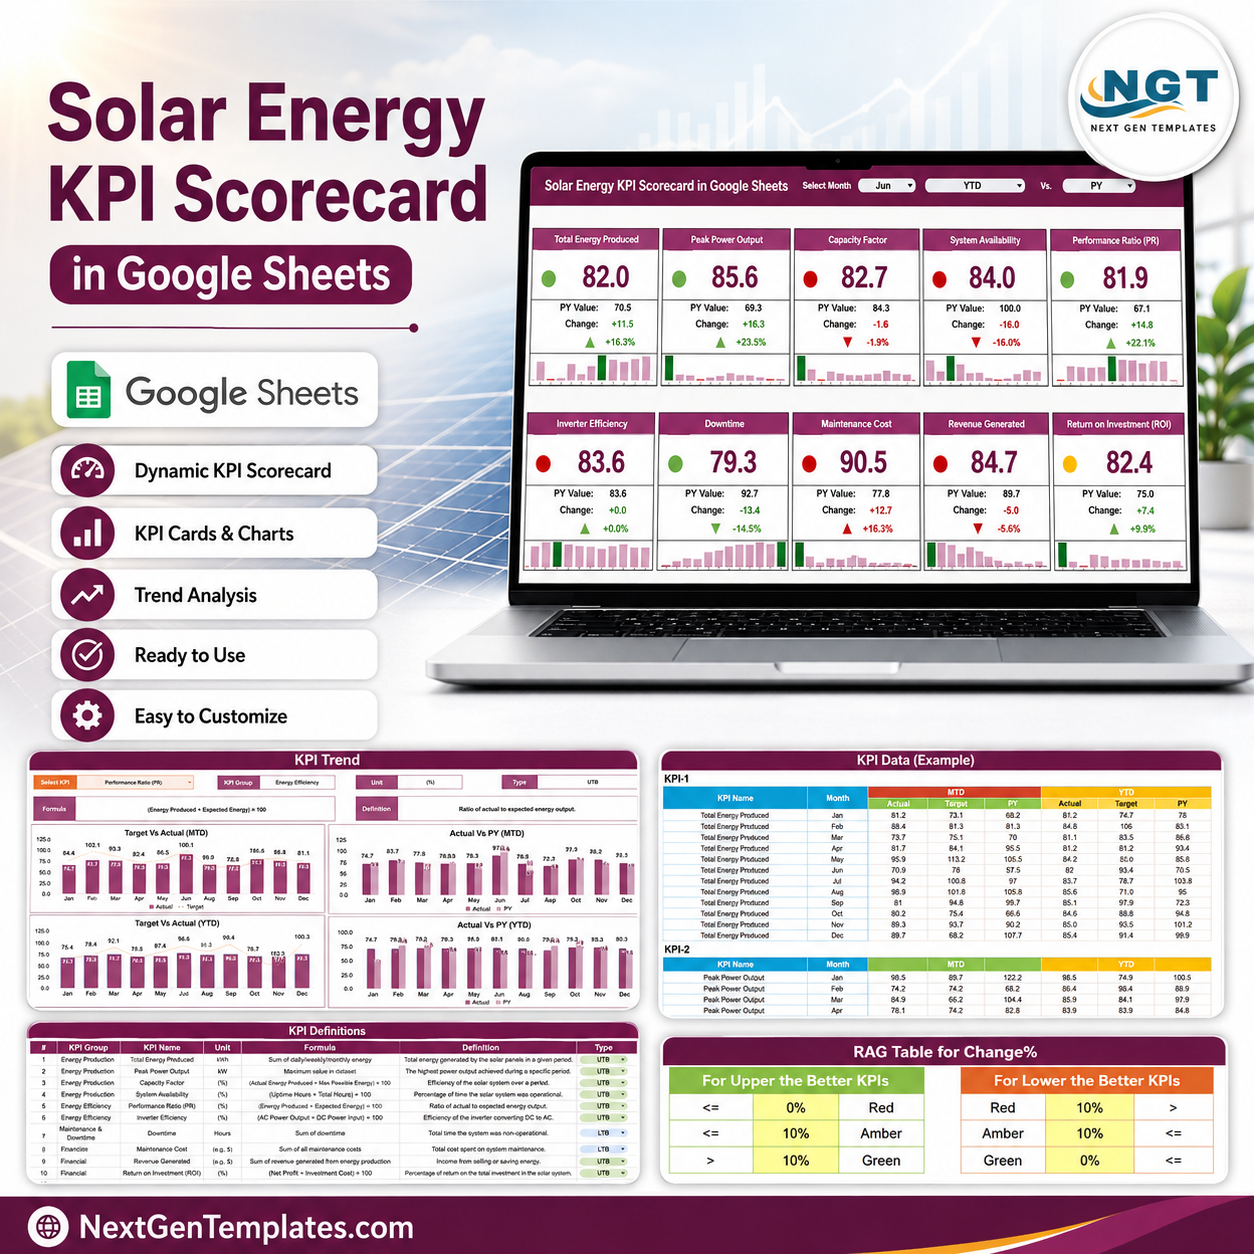
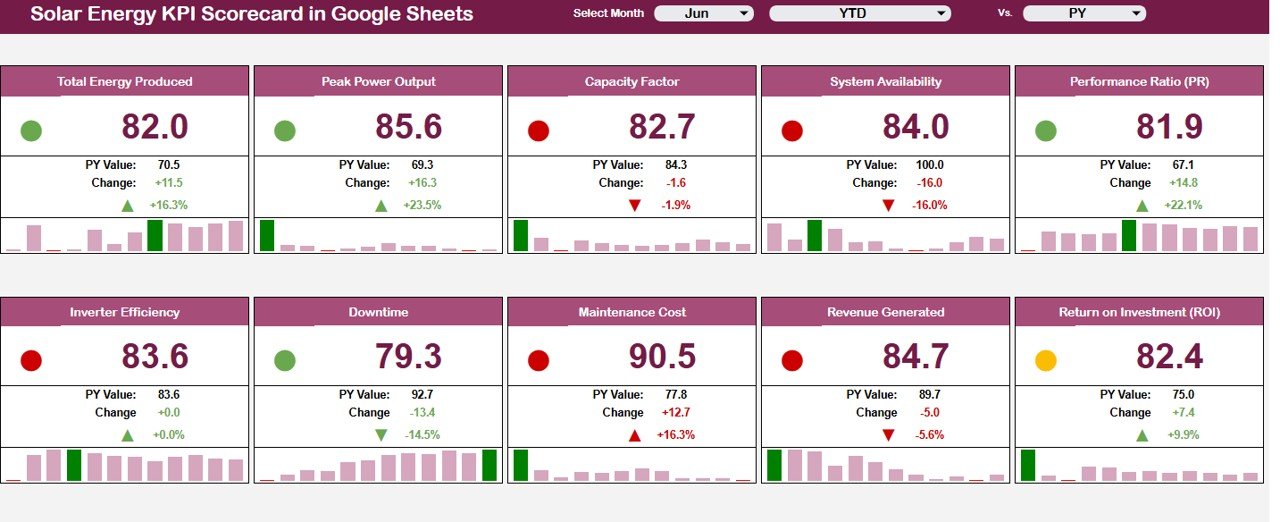
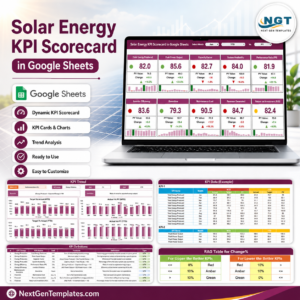
The Solar Energy KPI Scorecard in Google Sheets helps solar operators, renewable energy managers, analysts, and consulting teams track performance in one editable scorecard. It is designed for monthly KPI monitoring across energy production, equipment efficiency, availability, downtime, maintenance cost, revenue, and ROI.
This template gives you a ready-to-use Google Sheets structure with dashboard cards, KPI trend charts, monthly input tables, KPI definitions, and RAG status rules. You can use it to compare actual performance against prior year and target values, monitor MTD and YTD performance, and quickly identify where solar operations need attention.
What Is Included
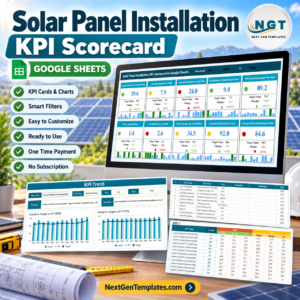
- Solar energy KPI overview scorecard with 10 performance cards.
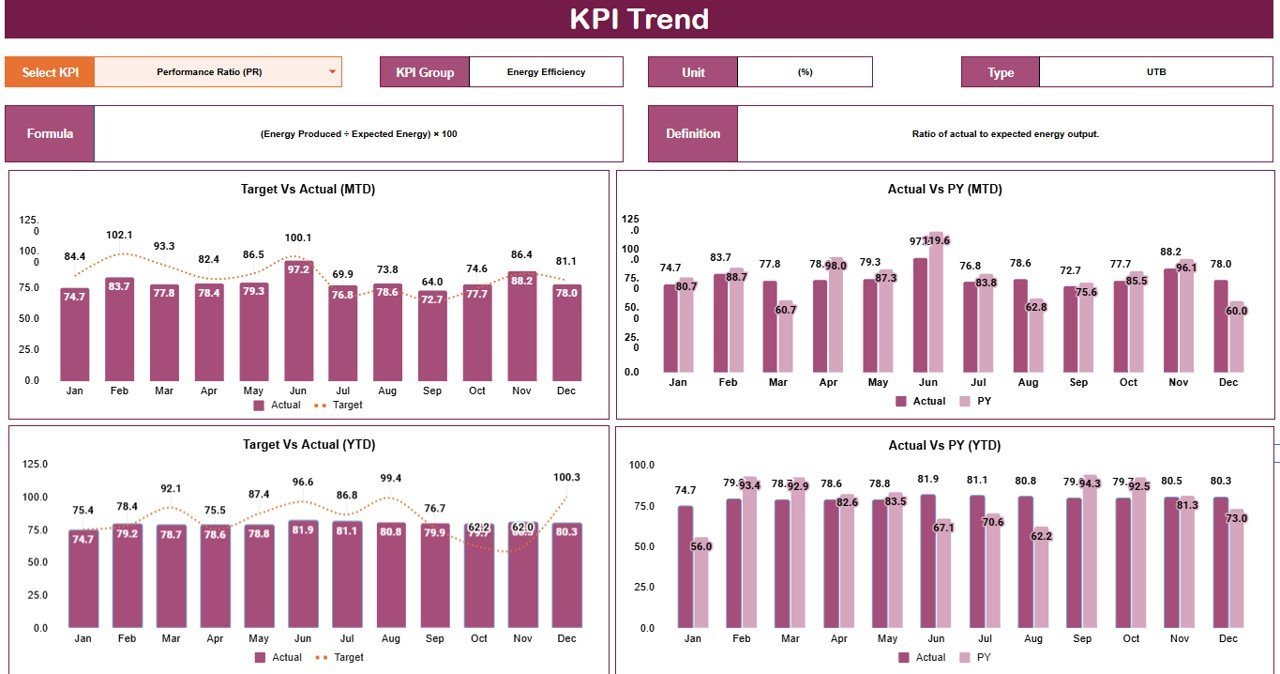
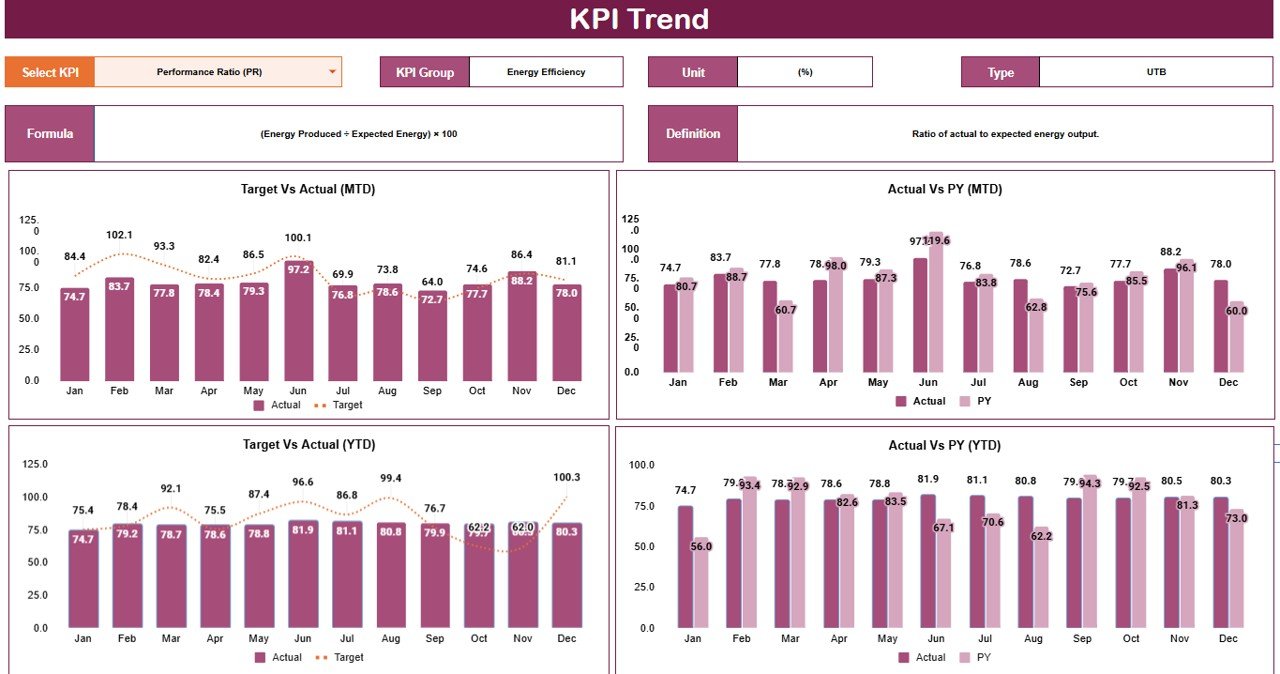
- KPI trend dashboard with MTD and YTD comparisons.
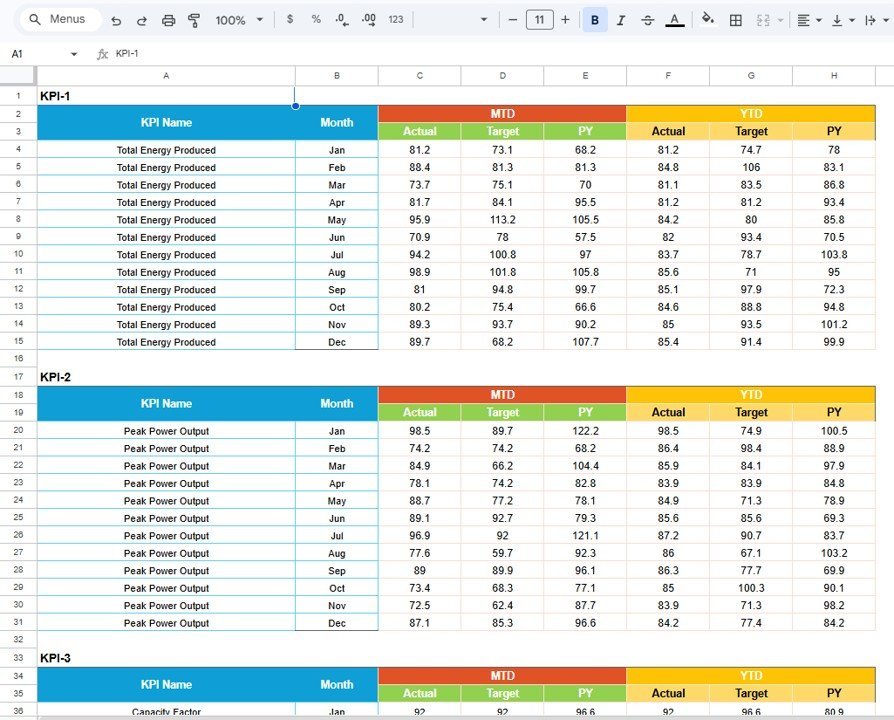
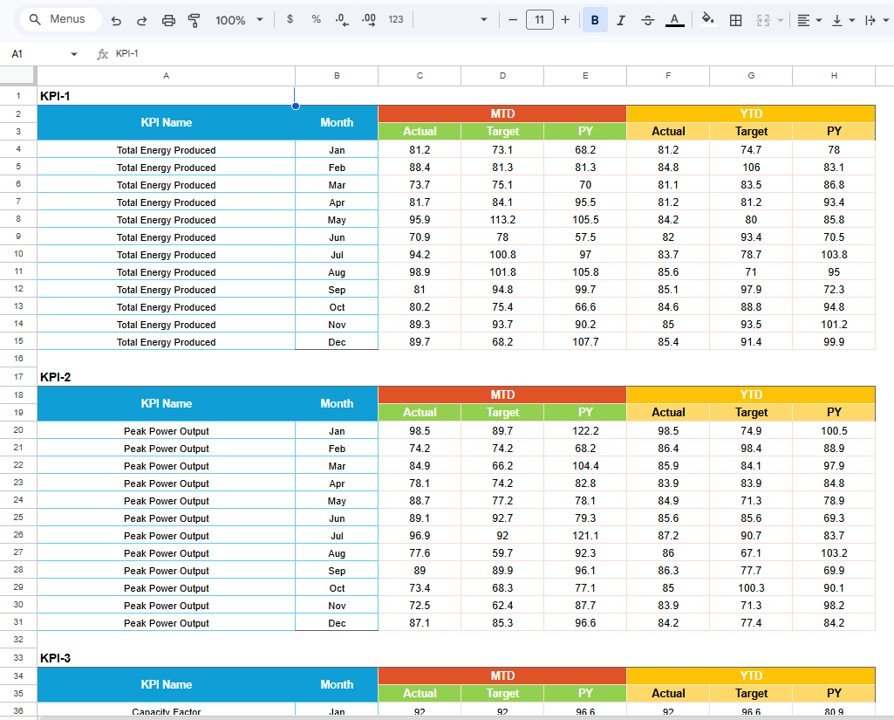
- Monthly KPI input table for Actual, Target, and PY values.
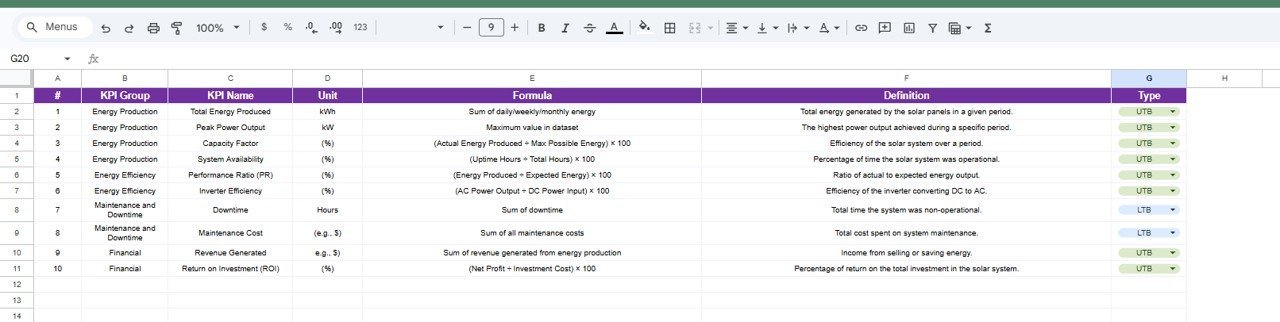
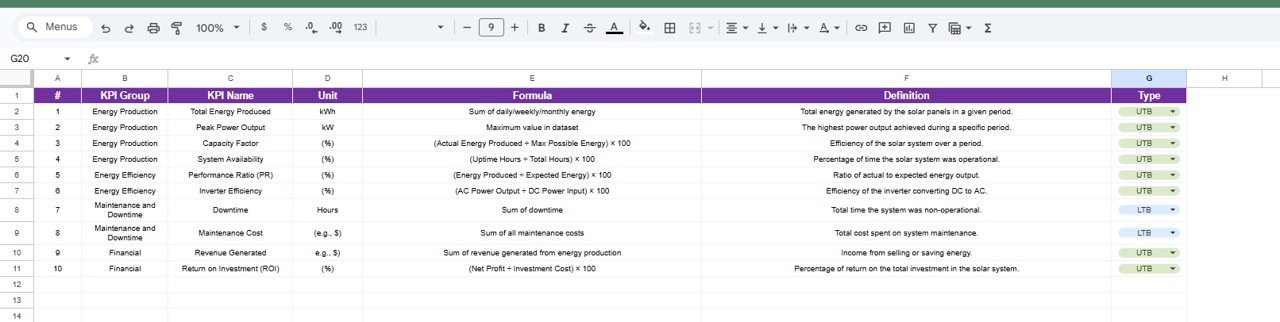
- KPI definition sheet with group, unit, formula, definition, and KPI type.
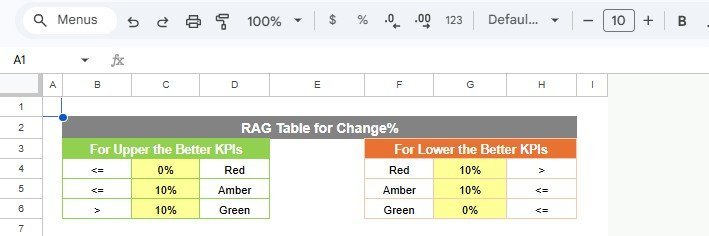
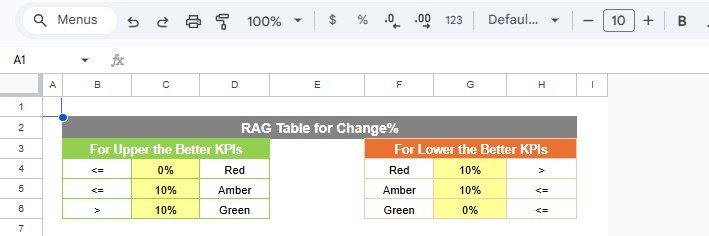
- RAG status rules for upper-the-better and lower-the-better KPIs.
- Google Sheets copy link delivered through the included PDF guide.
Key KPIs Tracked
| KPI | Purpose |
|---|---|
| Total Energy Produced | Track total electricity generated by the solar panels over a selected period. |
| Peak Power Output | Monitor the highest power output achieved during a specific period. |
| Capacity Factor | Compare actual energy production against maximum possible energy output. |
| System Availability | Measure the percentage of time the solar system is operational. |
| Performance Ratio (PR) | Evaluate actual output against expected output. |
| Inverter Efficiency | Track how efficiently inverters convert DC to AC power. |
| Downtime | Monitor non-operational hours that can reduce generation and revenue. |
| Maintenance Cost | Track maintenance spend and compare changes over time. |
| Revenue Generated | Monitor income from solar energy production or savings. |
| Return on Investment (ROI) | Measure the financial return from the solar system investment. |
Dashboard Pages
Solar Energy KPI Scorecard
The main scorecard page summarizes 10 KPIs with current values, prior-year values, change indicators, RAG status dots, and mini trend charts. Month, period, and comparison controls make it easier to review solar performance from different angles.
KPI Trend View
The KPI Trend page lets you inspect one KPI at a time. It includes the KPI group, unit, type, formula, definition, and four charts: Target vs Actual MTD, Actual vs PY MTD, Target vs Actual YTD, and Actual vs PY YTD.
KPI Data Input
The KPI data sheet is organized by KPI and month. For each KPI, you can enter MTD Actual, MTD Target, MTD PY, YTD Actual, YTD Target, and YTD PY values.
KPI Definition Sheet
The definition sheet documents each KPI group, KPI name, unit, formula, definition, and type. This helps teams keep performance measurement consistent across reporting periods.
RAG Rule Table
The RAG rule table separates upper-the-better KPIs from lower-the-better KPIs so scorecard status colors can support cleaner performance review.
Who Should Use This Template
- Solar energy operators tracking monthly plant performance.
- Renewable energy project managers reviewing production, uptime, and ROI.
- Energy consultants preparing client scorecards.
- Finance teams monitoring revenue, maintenance cost, and investment return.
- Operations teams comparing target, actual, and prior-year performance.
Why Use a Google Sheets KPI Scorecard
Google Sheets is familiar, shareable, and easy to adapt. This scorecard gives solar teams a structured KPI reporting system without requiring custom dashboard software. You can update the monthly data, adjust KPI targets, review visual trends, and collaborate with stakeholders in a cloud-based spreadsheet.
Related Templates
- Renewable Energy KPI Scorecard in Google Sheets
- Renewable Energy Dashboard in Google Sheets
- Petroleum Industry KPI Scorecard in Google Sheets
- Clean Tech Dashboard in Power BI
Frequently Asked Questions
Is this a Google Sheets template?
Yes. The purchase includes a PDF guide with a Google Sheets copy link so you can create your own editable copy in Google Drive.
Can I edit the KPI names and targets?
Yes. You can customize KPI names, monthly values, targets, prior-year values, formulas, and definitions based on your solar operation or client reporting needs.
Does this template include charts?
Yes. It includes KPI cards, mini trend charts, and detailed MTD and YTD trend charts for selected KPIs.
Can I use this for multiple solar projects?
Yes. You can duplicate the Google Sheets file for each site, portfolio, or client reporting workflow.
Is this template suitable for solar consultants?
Yes. It is useful for consultants who need a structured and editable scorecard for solar plant performance reviews, renewable energy reporting, and monthly management updates.
About the Author
This template is created by PK An Excel Expert, founder of NextGenTemplates.com and a spreadsheet automation specialist focused on practical Excel, Google Sheets, and dashboard templates for business teams.
Get the Solar Energy KPI Scorecard
Use the Solar Energy KPI Scorecard in Google Sheets to monitor solar operations, compare results, and present KPI performance clearly. Add it to your reporting toolkit today.
Download the Solar Energy KPI Scorecard in Google Sheets
Watch the step-by-step video Demo:
Last updated: August 19, 2026.



























Reviews
There are no reviews yet.