

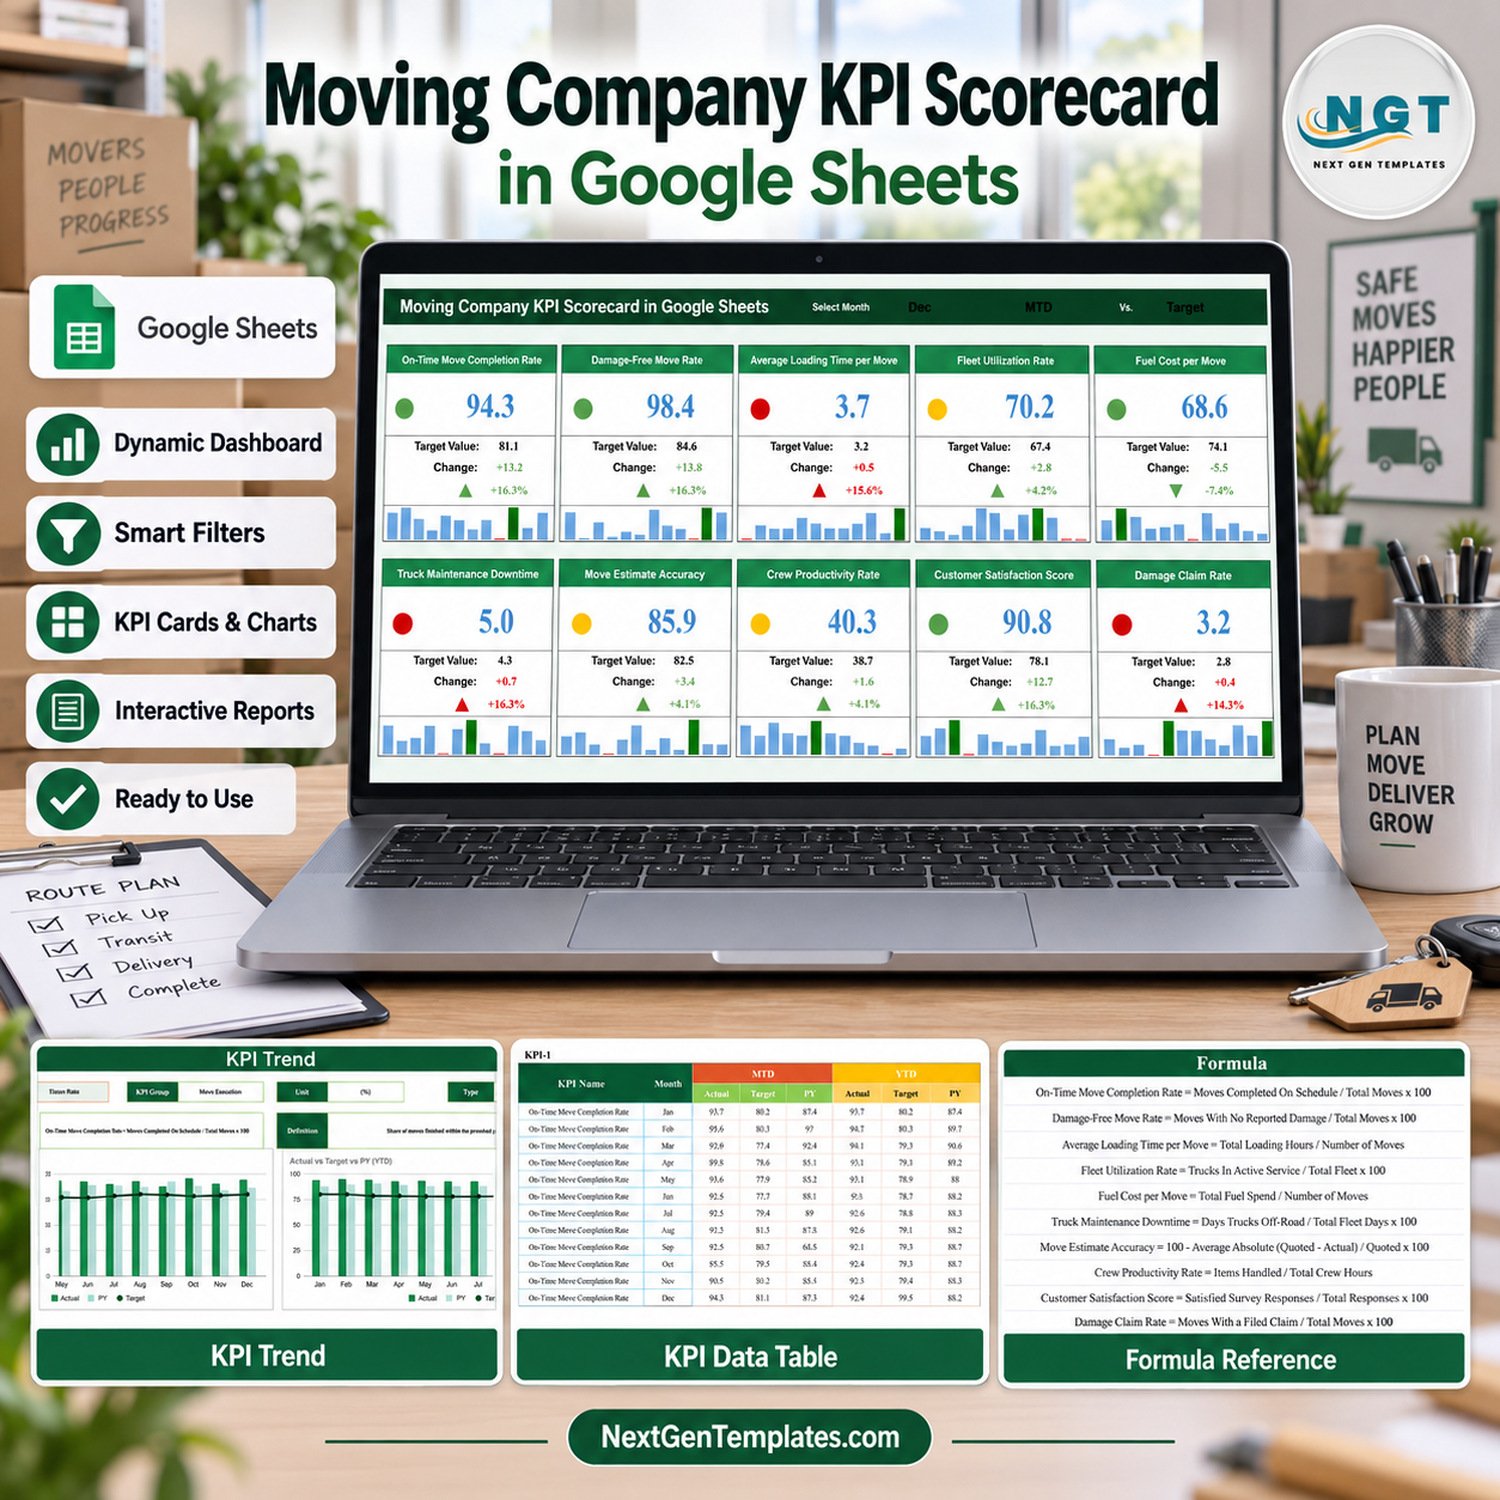
The Moving Company KPI Scorecard in Google Sheets scores 10 moving company KPIs from 4 KPI groups on one month-picker page. Each card shows value, target, change, a red, amber or green light and a 12-month mini chart, and a KPI Trend page charts any metric across the year.
This is the KPI Scorecard edition, a different product from our analytical Moving Company Dashboard in Google Sheets and from the KPI Dashboard line.
🌍 Join 8,400+ teams in 40+ countries using NextGenTemplates to replace paid SaaS tools with one-time-purchase Excel, Google Sheets, Power BI and HTML templates.
✅ Instant download · One-time payment · No subscription · No per-user fees · Lifetime access
🔑 Key Features of the Moving Company KPI Scorecard in Google Sheets
🎯 Ten KPIs built for a moving business. On-Time Move Completion Rate, Damage-Free Move Rate, Average Loading Time per Move, Fleet Utilization Rate, Fuel Cost per Move, Truck Maintenance Downtime, Move Estimate Accuracy, Crew Productivity Rate, Customer Satisfaction Score and Damage Claim Rate each get a card, unit, formula and definition.
📅 Three drop-downs control the whole page. Pick a month, switch between MTD and YTD, and compare against Target or Prior Year (PY). All ten cards recalculate from Input Data automatically.
🚦 Direction-aware traffic lights. Six KPIs are typed UTB (upper the better) and four LTB (lower the better): Average Loading Time per Move, Fuel Cost per Move, Truck Maintenance Downtime and Damage Claim Rate.
📈 A KPI Trend page for any metric. Pick a KPI to see its formula, definition and Actual vs Target vs PY charts for MTD and YTD.
✏️ Editable KPI list. Names, formulas and UTB/LTB types sit in plain cells on KPI Definition.
📦 What’s Inside the Template
Eight tabs, including two helper tabs. The four you work with:
Page 1: Scorecard
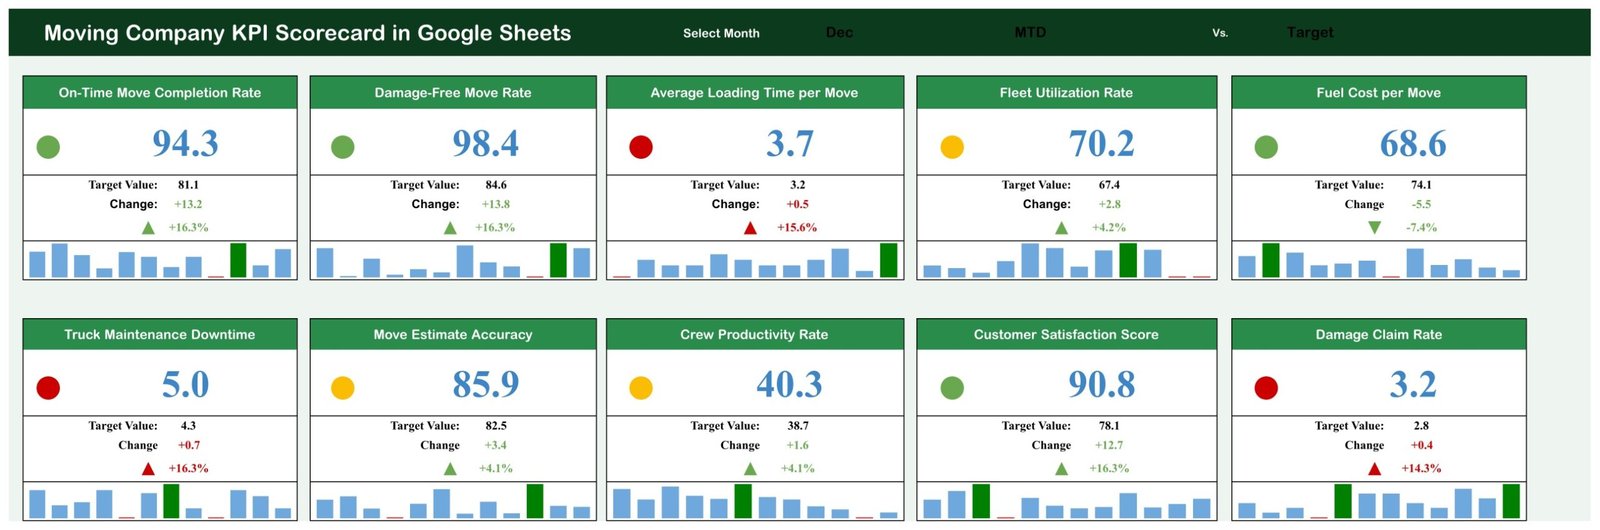
All 10 KPI cards in two rows of five. With Dec, MTD and Target selected, the sample data reads 4 green, 3 amber and 3 red: On-Time Move Completion Rate is 94.3% against an 81.1% target, Fuel Cost per Move is $68.6 against $74.1 (green, because lower is better), and Truck Maintenance Downtime is 5.0% against 4.3% (red).
Page 2: KPI Trend
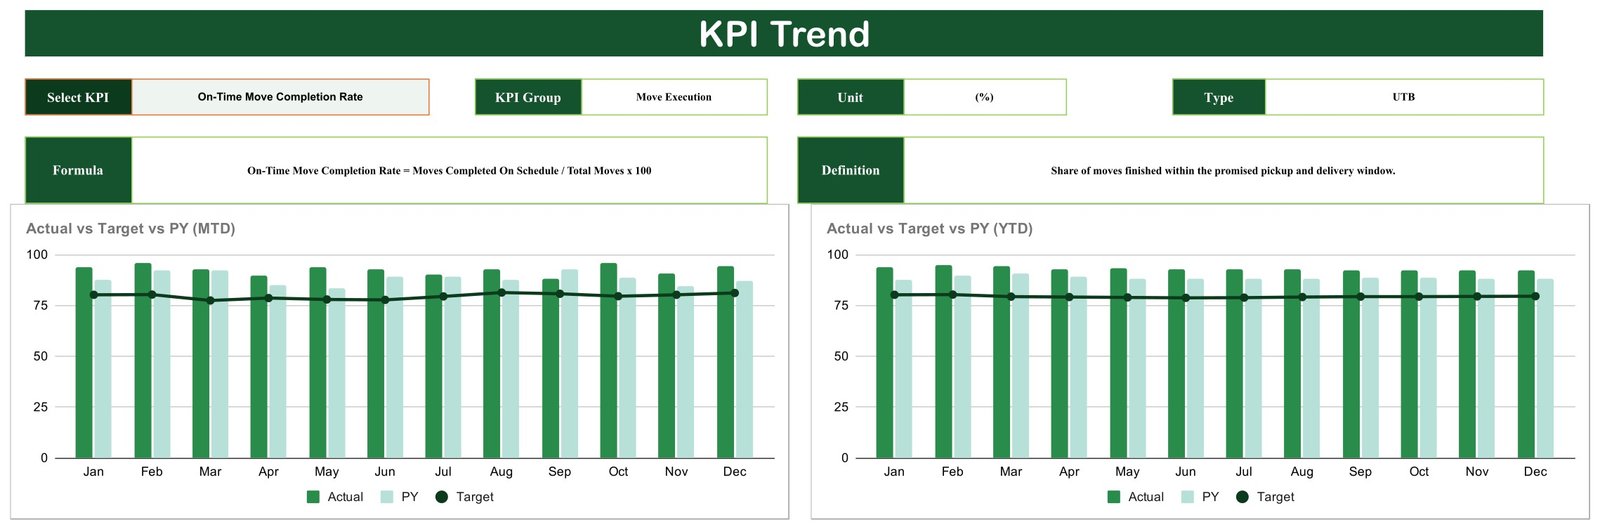
Select a KPI to fill in its group, unit, type, formula and definition. Charts: Actual vs Target vs PY by Month (MTD) and (YTD).
Page 3: KPI Definition
One row per KPI with its group, name, unit, formula, definition and type. The four groups are Move Execution (3 KPIs), Fleet and Logistics (3), Scheduling and Estimating (2) and Customer and Claims (2).

Page 4: Input Data
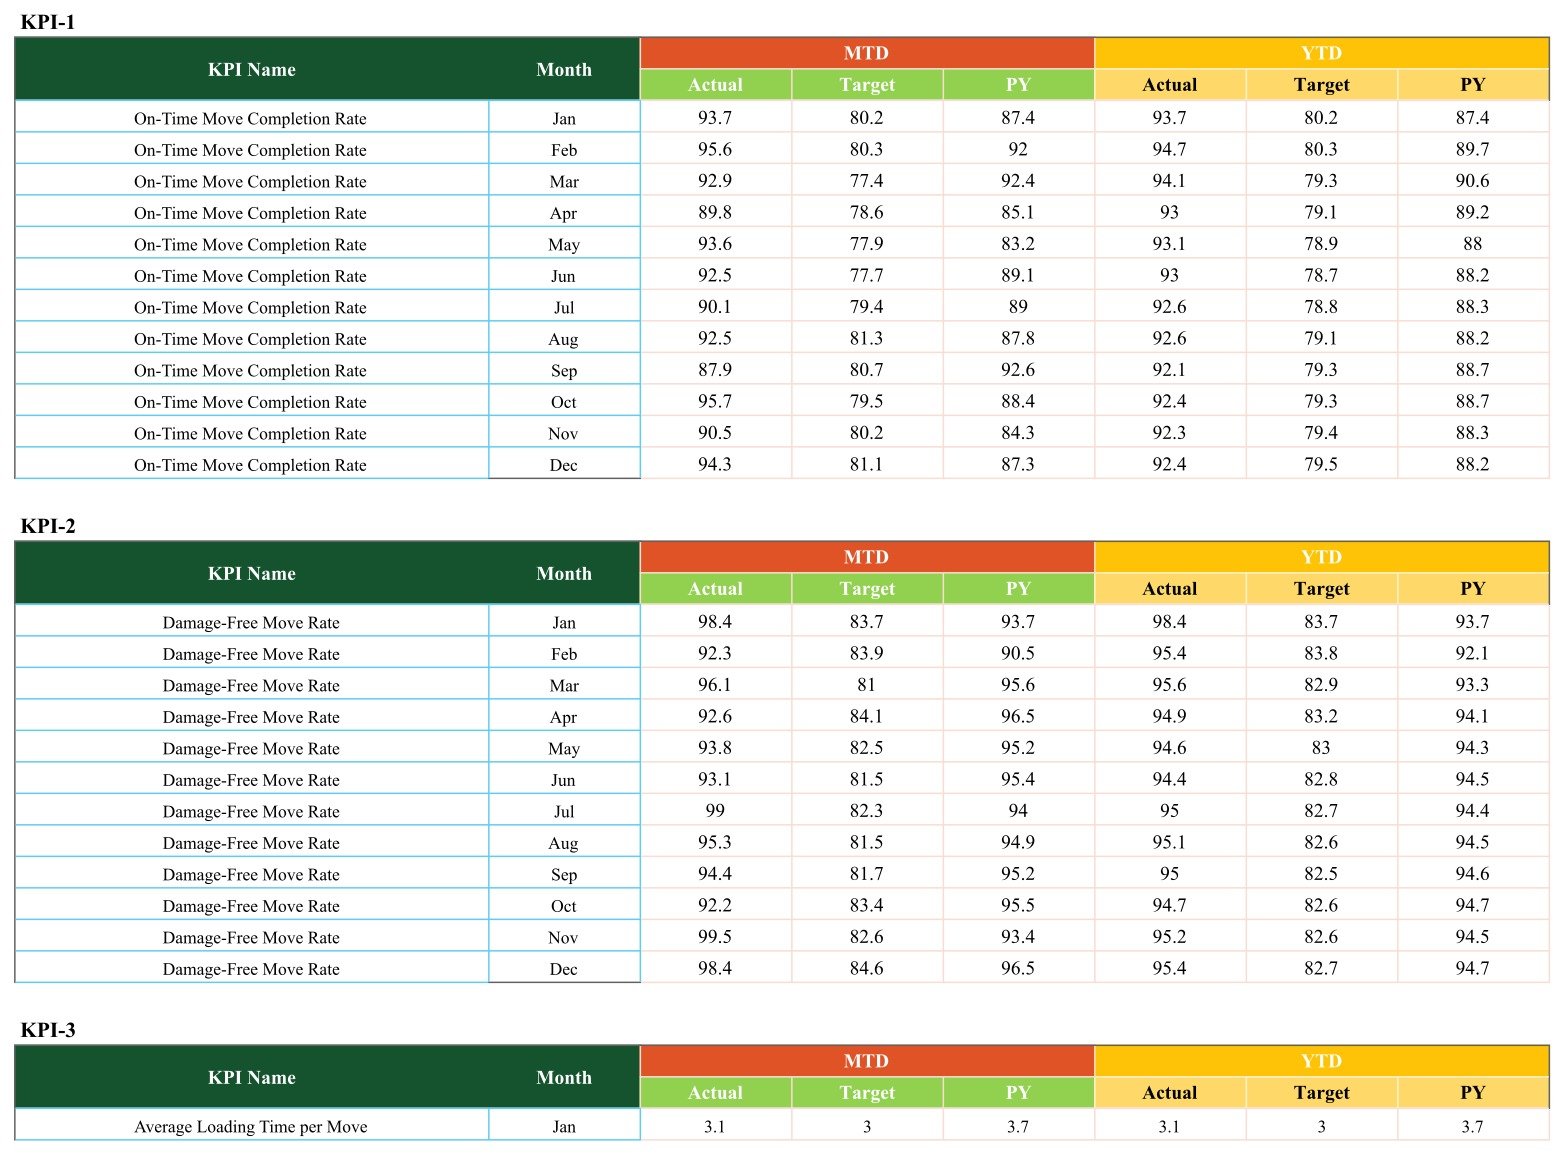
Ten blocks of twelve monthly rows with MTD and YTD Actual, Target and PY. Overwrite the 120 rows and everything follows.
📊 Google Sheets KPI Scorecard vs. Excel Scorecard vs. Moving CRM Software
| Feature | This Google Sheets scorecard | Microsoft Excel KPI scorecard | Moving company CRM software |
|---|---|---|---|
| Cost | ✅ $8.99 one-time (sale price) | One-time template plus an Excel licence | Monthly subscription |
| Platform | ✅ Browser and Google Sheets mobile app | Excel desktop | Web and mobile apps |
| Setup time | ✅ Make a copy, replace sample data | Open the file on a PC with Excel | Account setup, onboarding and data import |
| Real-time team collaboration | ✅ Google Sheets sharing | Via OneDrive or SharePoint | ✅ Multi-user accounts |
| Customizable KPIs | ✅ Edit names, formulas and types in cells | ✅ Editable | Limited to the vendor’s reports |
| Month picker with red/amber/green lights | ✅ 10 cards, MTD/YTD, vs Target or PY | Depends on the template | Varies by plan |
| Booking, estimates, dispatch and invoicing | ❌ Not included | ❌ Not included | ✅ Core features |
| Year-1 cost at 5 users | ✅ $8.99 total | Template plus 5 Excel licences | Subscription for 12 months |
For owners who already book moves in another tool and want one monthly KPI page without another subscription, this scorecard sits in the sweet spot.
👥 Who This Template Is For — and Who It’s Not For
✅ This template is built for:
- Owners of local and long-distance moving companies who review their numbers once a month
- Bookkeepers and consultants preparing monthly KPI reviews for relocation clients
❌ This template is NOT for:
- Teams that need booking, estimates, dispatch, route planning, invoicing or a CRM
- Anyone needing a claims register, insurance record or regulatory filing – Damage Claim Rate here is a management KPI only
⚙️ How to Use the Template
- Open the PDF in your download and click its link to make your own copy in Google Drive.
- On KPI Definition, keep or rename the ten KPIs and confirm each UTB or LTB type.
- On Input Data, overwrite the sample MTD and YTD Actual, Target and PY values month by month.
- On the Scorecard, pick the month, MTD or YTD, and Target or PY.
- Open KPI Trend and choose a KPI to review its twelve-month pattern.
Good to know before you buy: the month drop-down lists June and July while Input Data stores Jun and Jul, so those months show zeros until you edit the drop-down list (one minute). YTD values are typed, Read Me is blank, Color Settings is not linked to the lights, and a KPI beating target by under 10% shows amber. The blog post covers each point.
💼 Real-World Use Cases
Carlos runs a six-truck local moving company. He reads Damage-Free Move Rate beside Damage Claim Rate each month and treats a red light as the cue for a packing refresher.
Aisha manages operations for a long-distance mover. She switches to YTD vs PY and opens KPI Trend on Truck Maintenance Downtime before each quarterly review.
❓ Frequently Asked Questions
What KPIs does this moving company scorecard track?
It tracks ten: On-Time Move Completion Rate, Damage-Free Move Rate, Average Loading Time per Move, Fleet Utilization Rate, Fuel Cost per Move, Truck Maintenance Downtime, Move Estimate Accuracy, Crew Productivity Rate, Customer Satisfaction Score and Damage Claim Rate.
Is this the same as a moving company KPI dashboard?
No. This is the KPI Scorecard family: ten cards on one month-picker page plus a KPI Trend page. A Moving Company KPI Scorecard in Excel and a Moving Company KPI Dashboard in Excel are in preparation as separate products.
How long does setup take?
Copying takes seconds; with monthly totals ready, the 120 input rows take well under an hour.
Can I change the traffic-light thresholds?
Yes, in the Support helper tab, cells Z4:AD6. The Color Settings tab is display-only in this build.
Do I need Microsoft Excel?
No. It runs in Google Sheets with a free Google account, no add-ons or scripts.
👤 About the Author
Built by PK — Microsoft Certified Professional with 15+ years of Excel, Google Sheets and Power BI experience. Founder of NextGenTemplates, reaching 300K+ subscribers across YouTube channels (@PKAnExcelExpert, @NextGenTemplates, @NeoTechNavigators). Every template is hand-built and tested before release.
🔗 Explore Related Templates
🚚 Moving Company Dashboard in Google Sheets and Freight Forwarding Management System Web App.
🏗️ Equipment Rental Business KPI Scorecard in Google Sheets and Crane Rental KPI Scorecard in Google Sheets.
🔧 Excavation Contractor KPI Scorecard in Google Sheets and Septic Tank Service KPI Scorecard in Google Sheets.
📂 Browse every Google Sheets KPI dashboard and scorecard.
📖 Click here to read the Detailed Blog Post
🎥 Visit our YouTube channel for step-by-step video tutorials
👉 YouTube.com/@NextGenTemplates
📅 Last updated: September 2026














Reviews
There are no reviews yet.