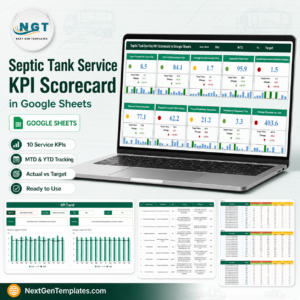
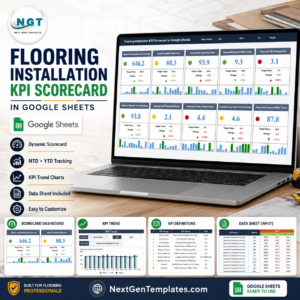
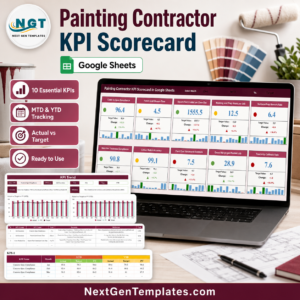
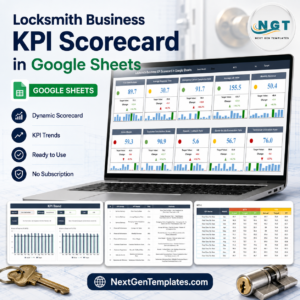
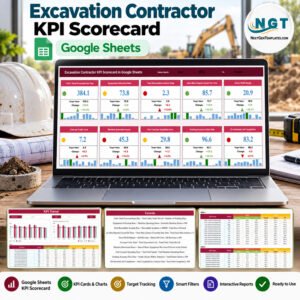
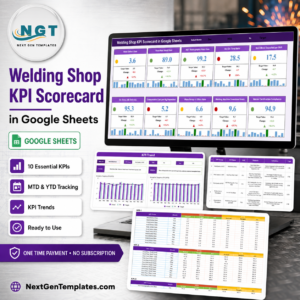
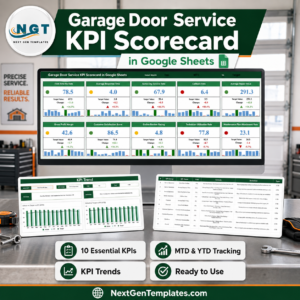
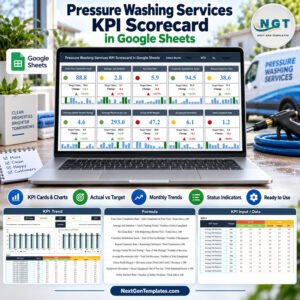
The Lawn Care Business KPI Scorecard in Google Sheets puts 10 lawn care KPIs from four groups on one page: three for operations and scheduling, three for financial performance, two for customer retention and two for sales and growth. Every KPI gets a traffic-light card with a 12-month mini chart, the KPI Trend page charts one KPI at a time against Target and prior year, and the sample file carries 120 monthly records.
This is the KPI Scorecard family (month picker, 10 cards, KPI Trend, KPI Definition, Input Data), not the larger KPI Dashboard line and not an analytical dashboard. It is a monthly reporting sheet for owners and office managers, filled in by hand from the numbers your crews and books already produce.
🌍 NextGenTemplates builds one-time-purchase Excel, Google Sheets, Power BI and web app templates for small service businesses that would rather not pay per user per month.
✅ Instant download · One-time payment · No subscription · No per-user fees · Lifetime access
🔑 Key Features of the Lawn Care Business KPI Scorecard in Google Sheets
🎛️ Three selectors on one page. Pick a month, switch between MTD and YTD, and compare against Target or PY. All 10 cards recalculate from the Input Data sheet with SUMIFS formulas. There are no scripts, add-ons or macros to authorise.
🚦 Direction-aware traffic lights. Seven KPIs are upper-the-better (UTB) and three are lower-the-better (LTB). For a UTB KPI, a result at or below the comparison is red, up to 10% above is amber and more than 10% above is green; LTB KPIs use the mirror rule.
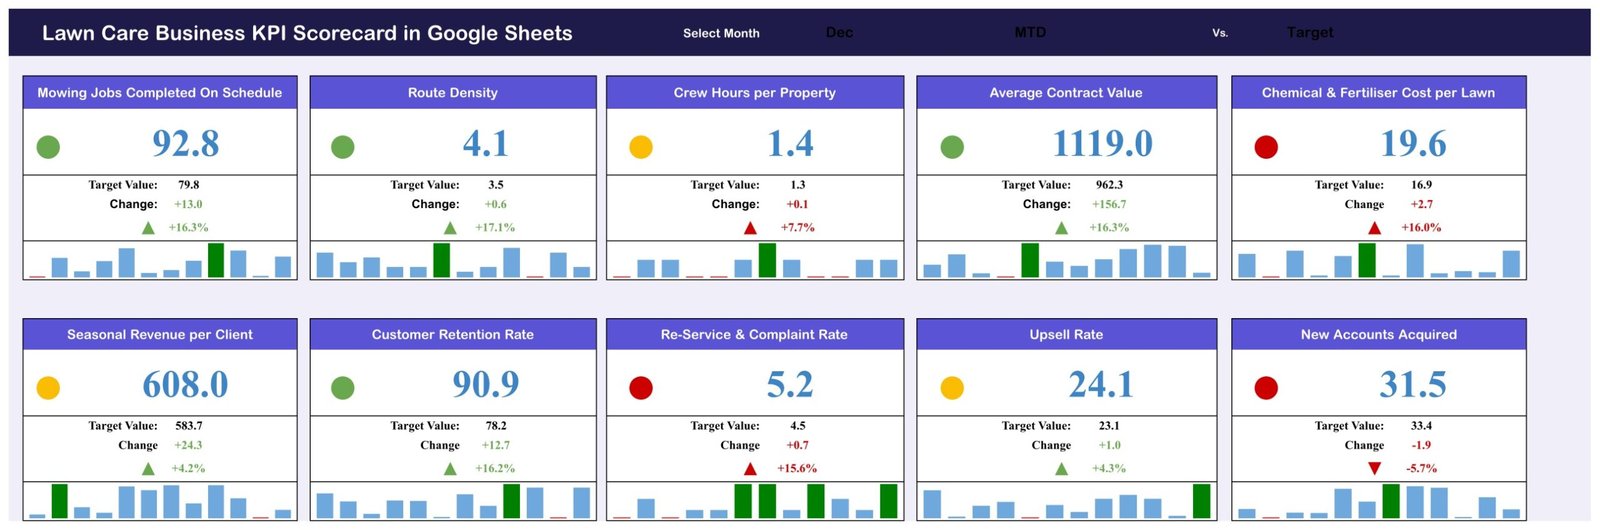
📇 Complete cards. Each card shows the value, the Target or PY value, the absolute change, the change %, an up or down arrow and a 12-month mini column chart with the selected month highlighted.
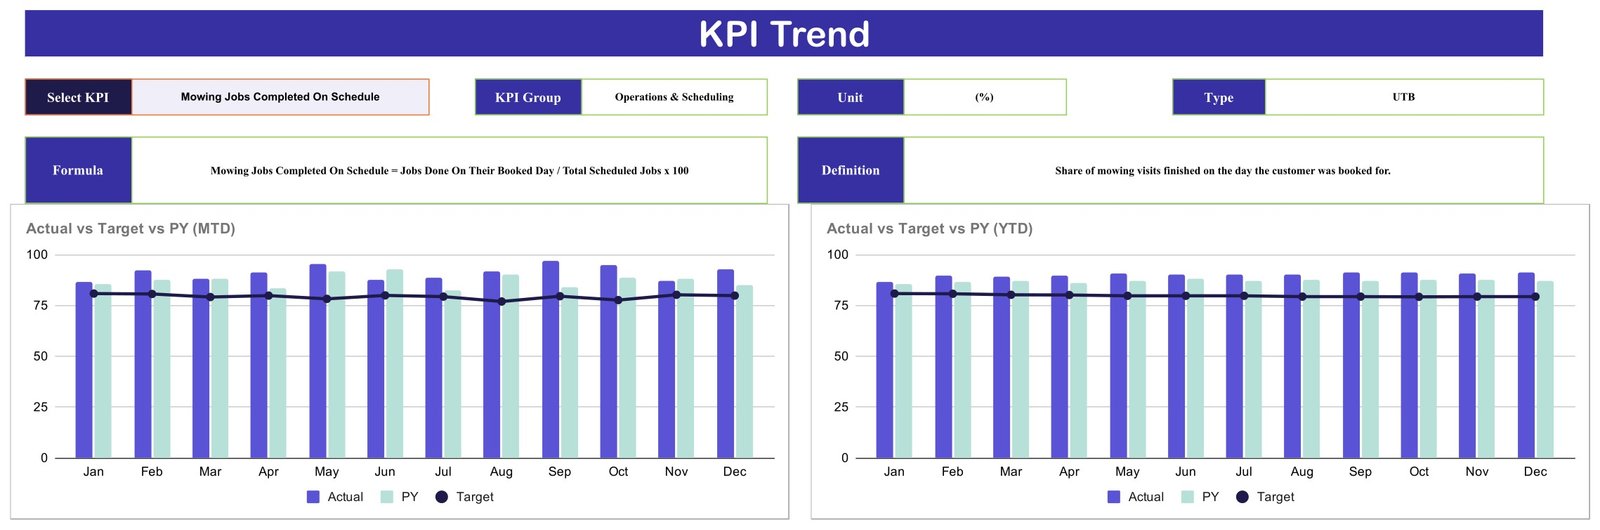
📈 KPI Trend page. Choose one KPI to see its group, unit, type, formula and definition, plus two charts of Actual vs Target vs PY by month, one for MTD and one for YTD.
📚 Documented metrics. The KPI Definition sheet lists the unit, formula, definition and UTB/LTB type for every KPI, so a new office manager can read exactly what each number means.
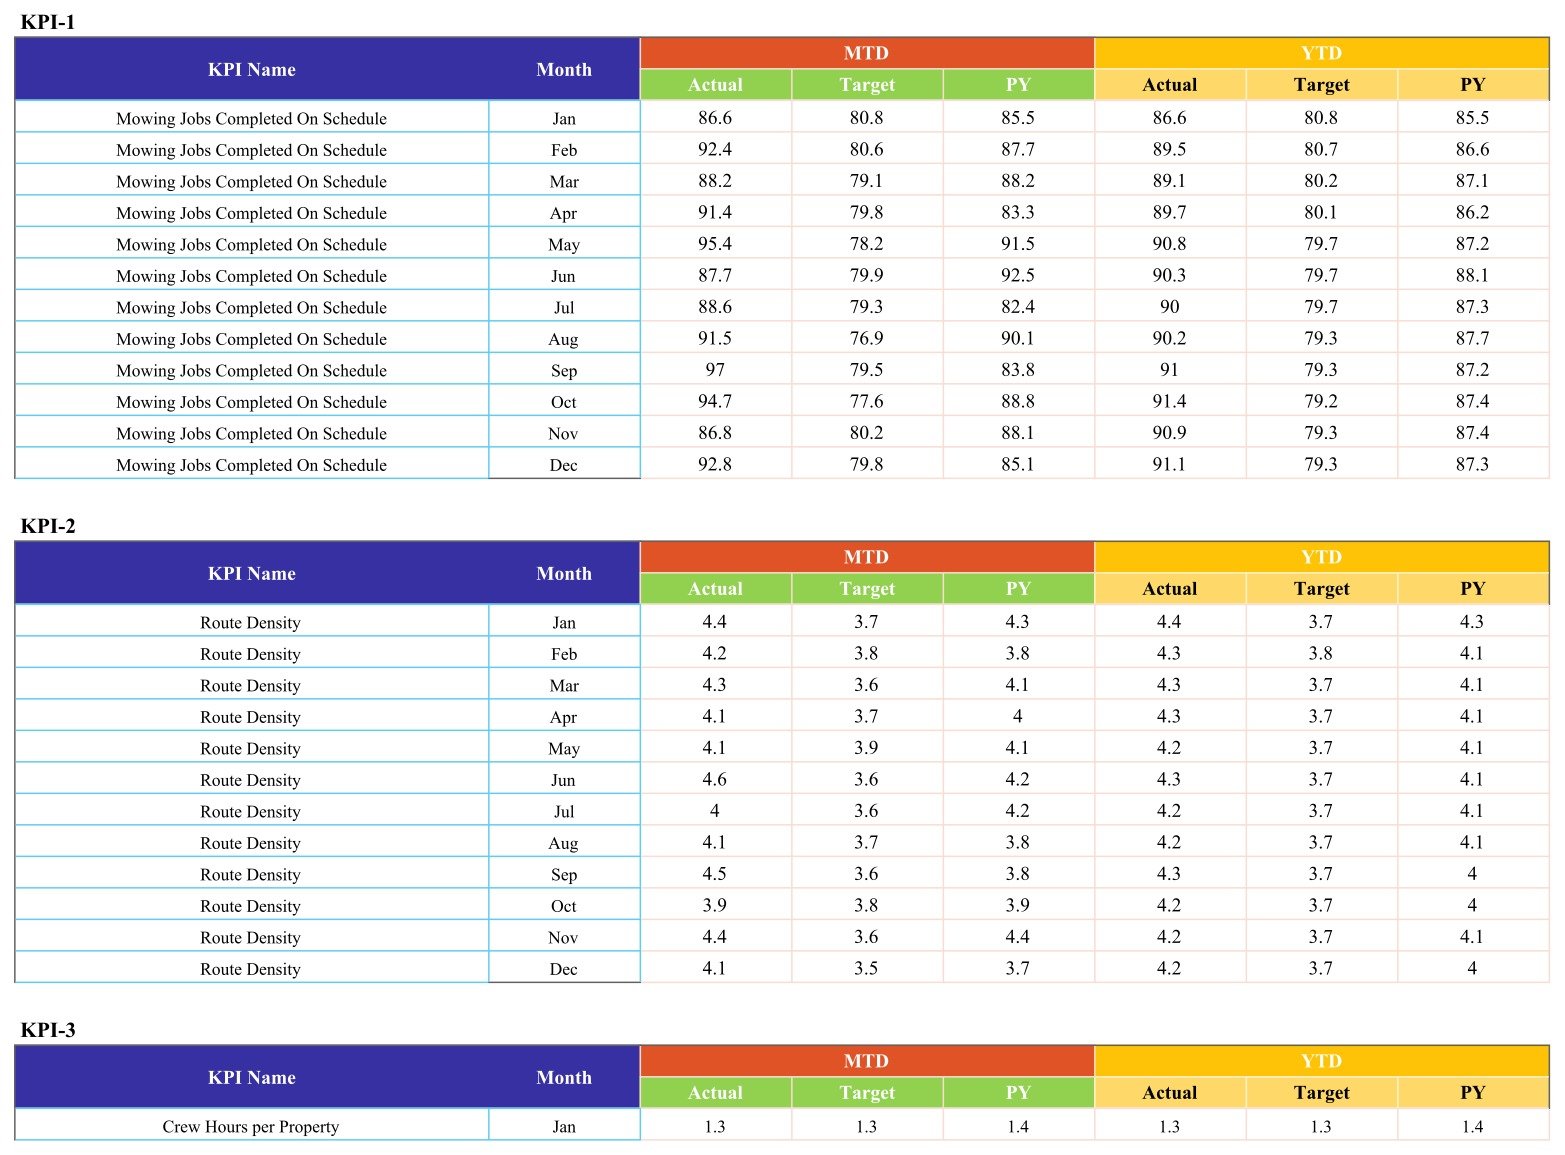
✍️ Plain monthly input. Input Data holds ten blocks of 12 monthly rows with MTD and YTD Actual, Target and PY. YTD figures are typed, not calculated, so enter them from your own books.
The 10 KPIs
- 🗓️ Operations and Scheduling: Mowing Jobs Completed On Schedule (%), Route Density (accounts/mile), Crew Hours per Property (hrs, LTB)
- 💵 Financial Performance: Average Contract Value ($), Chemical & Fertiliser Cost per Lawn ($, LTB), Seasonal Revenue per Client ($)
- 🤝 Customer Retention: Customer Retention Rate (%), Re-Service & Complaint Rate (%, LTB)
- 🌱 Sales and Growth: Upsell Rate (%), New Accounts Acquired (accounts)
📦 What’s Inside the Template
Page 1: Scorecard
Ten cards in two rows of five sit under a header with the Month, MTD/YTD and Target/PY selectors. With December, MTD and Target selected, the sample reads 4 green, 3 amber and 3 red: Route Density is 4.1 against a 3.5 target (green, up 17.1%), Seasonal Revenue per Client is 608.0 against 583.7 (amber, up 4.2%) and Re-Service & Complaint Rate is 5.2 against 4.5 (red, because lower is better).
Page 2: KPI Trend
Select a KPI and the page fills in KPI Group, Unit, Type, Formula and Definition, then plots Actual vs Target vs PY (MTD) by Month and Actual vs Target vs PY (YTD) by Month. The sample shows Mowing Jobs Completed On Schedule, where every month’s MTD actual sits above its target line.
Page 3: KPI Definition
A table of the 10 KPIs with #, KPI Group, KPI Name, Unit, Formula, Definition and Type. For example, Route Density = Accounts Serviced on a Route / Miles Driven on That Route, and Upsell Rate = Clients Who Added a Service / Total Clients x 100.

Page 4: Input Data
Ten blocks labelled KPI-1 to KPI-10, each with 12 monthly rows and six figures per row: MTD Actual, Target and PY, then YTD Actual, Target and PY. This is the only sheet you update each month.
Behind these pages sit a Read Me tab, a Color Settings tab and two helper tabs, Support and Trend_Support, which do the lookups for the cards and charts.
⚠️ Known issues in the current build, with fixes
We tested the live sheet before listing it. Four issues are present in this copy:
- 🗓️ June and July show blank cards. The month dropdown in Scorecard cell N1 offers “June” and “July”, but Input Data stores “Jun” and “Jul”, so all ten cards go blank for those two months. One-minute fix: select Scorecard cell N1, open Data > Data validation, change June to Jun and July to Jul in the list, save, then pick Jun again.
- 📄 The Read Me tab is empty. Use the How to Use steps below and the PDF guide in your download instead.
- 🎨 Color Settings is not connected. The tab shows a red, amber and green table, but no formula reads it. The live 0% and 10% bands are typed into the Support tab (cells Z4:Z6 for UTB and AD4:AD6 for LTB); change them there if you need different thresholds.
- 🔴 One card always shows its change in red. On Crew Hours per Property, both change-colour rules use red, so an improvement still reads red. Fix: open Format > Conditional formatting on the Scorecard, select the rule for cells N6:N7 and M7 whose formula ends =”Green”, and set its text colour to green.
📊 Google Sheets Scorecard vs. Excel Workbook vs. Field Service SaaS: Where This Fits
| Feature | Lawn Care Business KPI Scorecard (Google Sheets) | Excel KPI scorecard workbook | Field service SaaS (Jobber / LMN / Aspire) |
|---|---|---|---|
| Cost | ✅ $8.99 one-time | One-time, plus an Excel licence | Monthly subscription, often priced per user |
| Platform | ✅ Any browser with a Google account | Desktop Excel | Vendor web and mobile apps |
| Setup time | ✅ Under an hour to type 12 months of figures | Similar | Days to weeks of onboarding |
| Real-time team collaboration | ✅ Google Sheets sharing | Limited without OneDrive | ✅ Built in |
| Mobile access | View in the Google Sheets app | Excel mobile app | ✅ Native crew apps |
| Customizable KPIs | ✅ Rename KPIs and edit definitions | ✅ Yes | Fixed report set |
| Scheduling, routing and invoicing | ❌ Not included | ❌ Not included | ✅ Core feature |
| Month-by-month KPI scorecard with traffic lights | ✅ Yes, 10 cards | Depends on the workbook | Usually needs custom reports |
| Year-1 cost at 5 users | ✅ $8.99 | Price plus Microsoft 365 seats | Hundreds to thousands of dollars |
For lawn care owners who want one monthly view of crew efficiency, contract value and retention without paying for a full field service platform, the Lawn Care Business KPI Scorecard in Google Sheets sits in the sweet spot.
👥 Who This Template Is For, and Who It’s Not For
✅ This template is built for:
- Owners of residential and commercial lawn care businesses running one to a dozen crews
- Office or operations managers who prepare a month-end KPI review
- Consultants and bookkeepers who report performance to lawn care clients
❌ This template is NOT for:
- Teams that need job scheduling, route planning, crew clock-in or invoicing, which this sheet does not do
- Anyone looking for an automatic feed from field service or accounting software; every figure is typed in
- Businesses that need product application logs or regulatory records; this is a KPI reporting sheet only
⚙️ How to Use the Scorecard
- Open the PDF guide in your download and click the link to make your own copy in Google Drive.
- Fix the June and July dropdown in Scorecard cell N1 as described above.
- On KPI Definition, rename KPIs, units, formulas and UTB/LTB types to match your business.
- On Input Data, replace the sample MTD and YTD Actual, Target and PY figures for each month.
- On the Scorecard, choose the month, MTD or YTD, and Target or PY.
- Open KPI Trend and pick a KPI to review its 12-month pattern before your monthly meeting.
💼 Real-World Use Cases
Marcus runs a four-crew residential mowing company. Each month he types in completed and scheduled visits, miles driven and crew hours. The Route Density and Crew Hours per Property cards show him which weeks his routes spread too thin, and the KPI Trend page tells him whether a new route plan actually held.
Priya manages the office for a lawn and landscape maintenance firm. She uses the YTD view against PY for the owner’s quarterly review, where Customer Retention Rate, Average Contract Value and Upsell Rate show whether renewals and add-on services are growing.
Dan is a bookkeeper serving three lawn care clients. He keeps one copy of the scorecard per client, shares it view-only, and walks each owner through the red cards, starting with Chemical & Fertiliser Cost per Lawn and Re-Service & Complaint Rate.
❓ Frequently Asked Questions
What KPIs does the lawn care business scorecard track?
The Lawn Care Business KPI Scorecard in Google Sheets tracks 10 KPIs: Mowing Jobs Completed On Schedule, Route Density, Crew Hours per Property, Average Contract Value, Chemical & Fertiliser Cost per Lawn, Seasonal Revenue per Client, Customer Retention Rate, Re-Service & Complaint Rate, Upsell Rate and New Accounts Acquired.
Is this the KPI Scorecard or the KPI Dashboard?
This listing is the KPI Scorecard: one page of 10 traffic-light cards with a month picker, plus KPI Trend, KPI Definition and Input Data. The KPI Dashboard line is a separate, larger build with its own analysis pages. An Excel edition of this scorecard is in preparation.
How long does setup take?
Making the copy takes a minute and the June/July dropdown fix another minute. Typing twelve months of figures for 10 KPIs is 120 rows, so most owners finish in under an hour from their existing reports.
Can I change the red, amber and green thresholds?
Yes, but not from the Color Settings tab, which no formula reads in this build. The live bands are typed into the Support tab: cells Z4:Z6 for upper-the-better KPIs and AD4:AD6 for lower-the-better KPIs, currently 0% and 10%.
How does this compare to Jobber or LMN?
Jobber, LMN and Aspire run scheduling, quoting and invoicing and charge monthly. This scorecard does none of that; it is an $8.99 one-time Google Sheets report for the KPIs you already measure, useful on its own or alongside those tools.
Does it use real company data?
No. All figures in the Lawn Care Business KPI Scorecard in Google Sheets are fictional sample data for demonstration. Replace them with your own numbers. The sheet records no product applications and makes no licensing or regulatory claim.
👤 About the Author
Built by PK, Microsoft Certified Professional with 15+ years of Excel, Google Sheets and Power BI experience, and founder of NextGenTemplates. Tutorials run on YouTube at @PKAnExcelExpert, @NextGenTemplates and @NeoTechNavigators. Every template is built and tested before release, and the known issues above come from that testing.
🔗 Explore Related Templates
🌿 Want deeper analysis of jobs and revenue? The Landscaping Dashboard in Google Sheets analyses service records, and the Landscaping Dashboard in Excel does the same on the desktop.
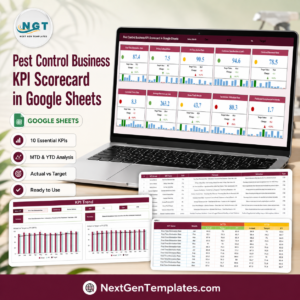
🧰 Other home-service scorecards in the same family: Pest Control Business KPI Scorecard in Google Sheets and Garage Door Service KPI Scorecard in Google Sheets. For the larger KPI Dashboard format, see the Swimming Pool Service KPI Dashboard in Google Sheets.
📂 Browse every Google Sheets KPI Dashboard and Scorecard template. Need help editing data validation? See Google’s guide to creating dropdown lists in Google Sheets.
📖 Click here to read the Detailed Blog Post
🎥 Visit our YouTube channel for step-by-step video tutorials
👉 YouTube.com/@NextGenTemplates
Watch the step-by-step video Demo:
📅 Last updated: September 2026