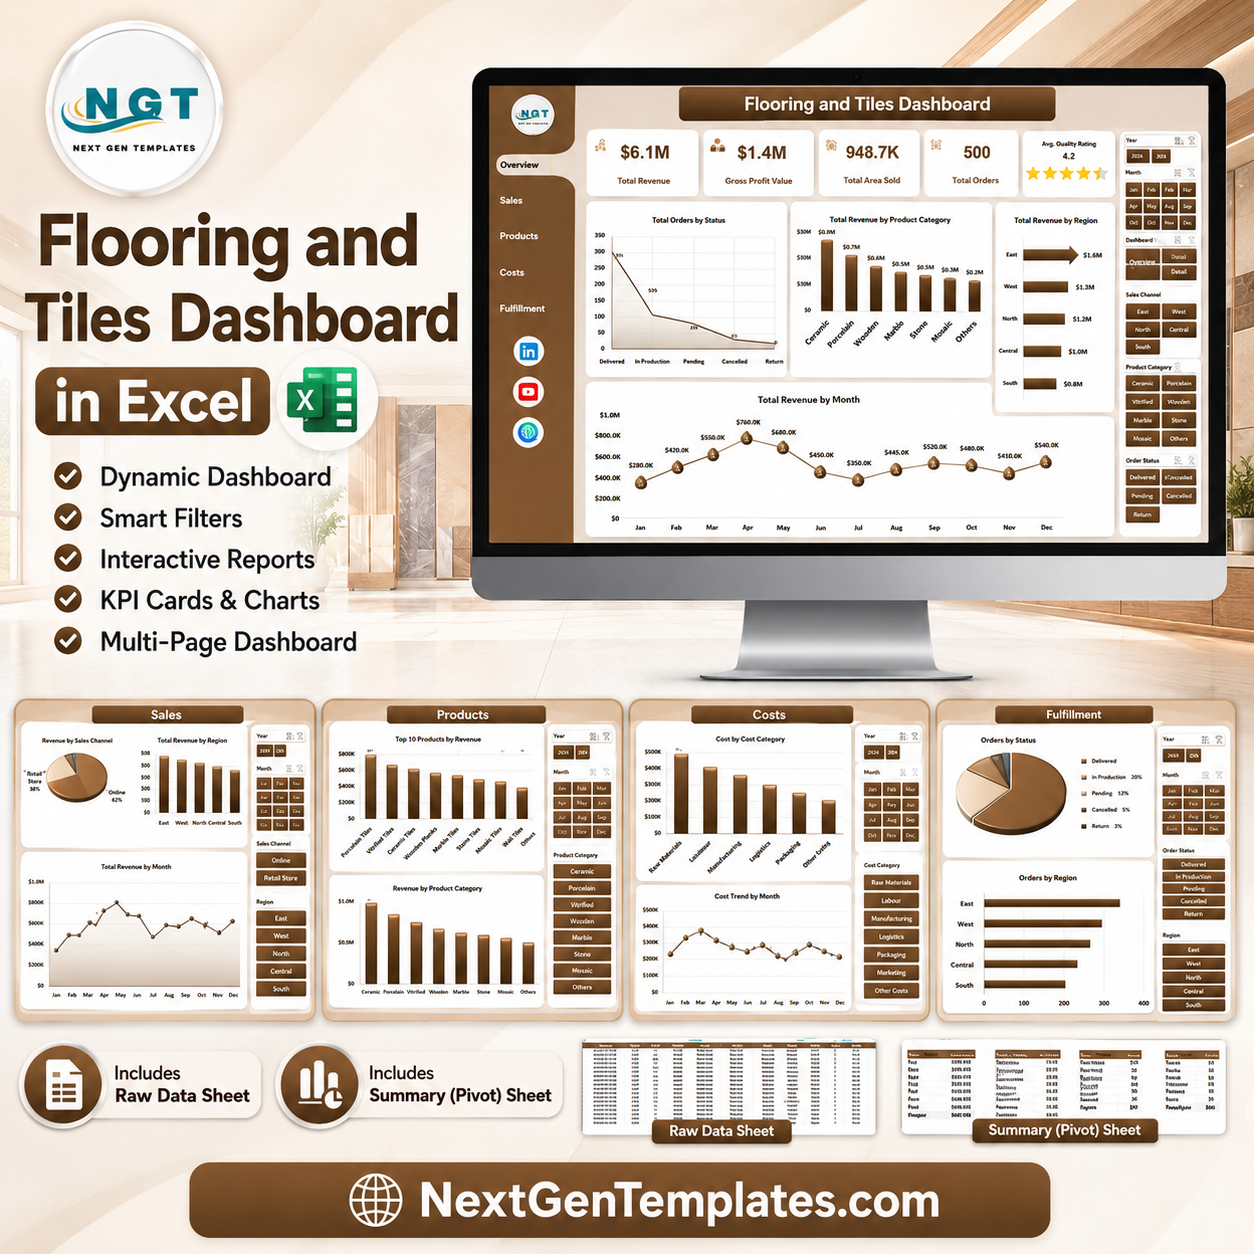
The Flooring and Tiles Dashboard in Excel helps flooring retailers, tile distributors, installation teams, and building-material suppliers turn order, revenue, cost, margin, area, region, product, and fulfillment data into a clean 7-sheet reporting workbook. The sample dashboard includes executive cards for Total Revenue, Gross Profit Value, Total Area Sold, Total Orders, and Avg. Quality Rating, plus 20 analysis charts across sales, products, costs, and fulfillment. Join 8,400+ teams in 40+ countries using NextGenTemplates for one-time-purchase spreadsheet dashboards. Instant download, no subscription, no per-user fees, and lifetime access.
Key Features of Flooring and Tiles Dashboard in Excel
- 7 worksheet tabs: Overview, Sales, Products, Costs, Fulfillment, Data, and Support.
- 5 executive KPI cards: Track revenue, profit, area sold, orders, and quality rating in one view.
- 20 analysis charts: Review order status, category revenue, regional performance, material cost, margin, delivery cost, and installation trends.
- Excel slicers: Filter the dashboard quickly without rebuilding reports.
- Editable data sheet: Replace the sample records with your own flooring and tiles transactions.
- Pivot-backed support sheet: Refresh all pivots and charts from the Excel Data tab after updating data.
- One-time purchase: No subscription, no per-user charges, and lifetime access to the file.
What’s Inside the Flooring and Tiles Dashboard in Excel
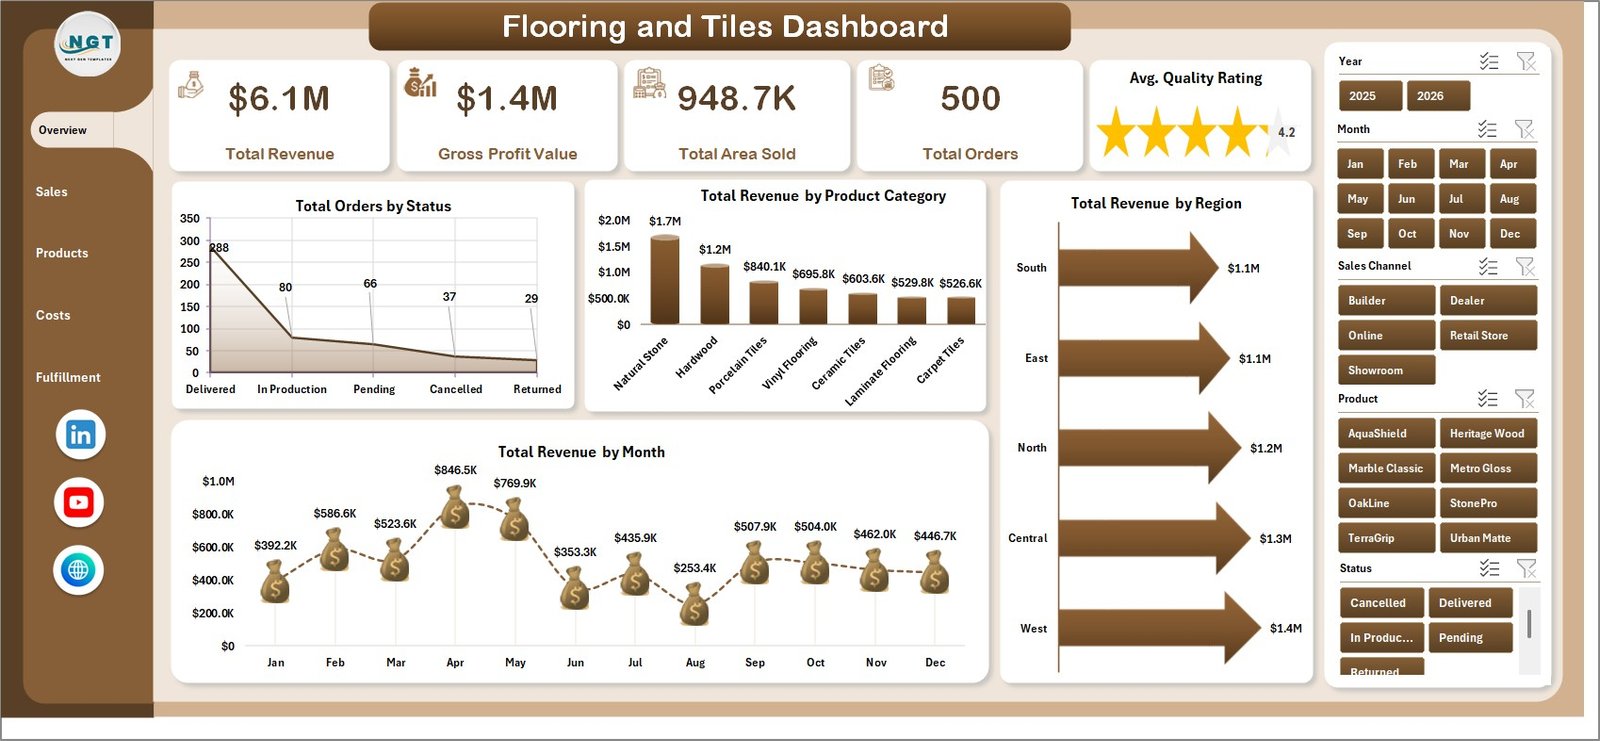
Overview Page
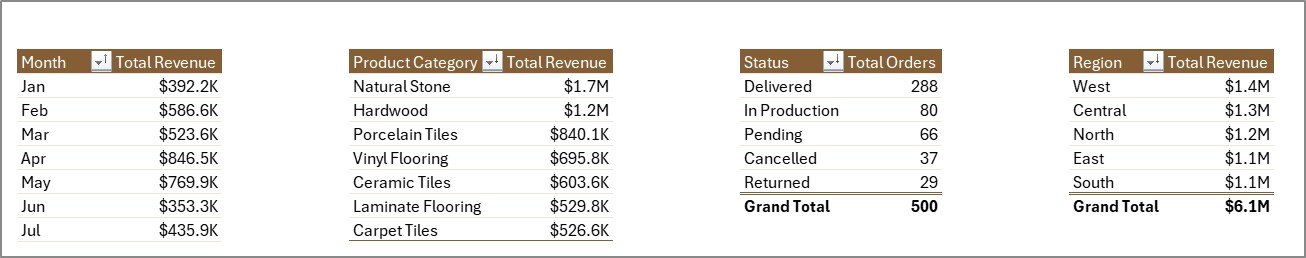
The Overview page gives a high-level view of flooring and tiles performance. KPI cards show Total Revenue, Gross Profit Value, Total Area Sold, Total Orders, and Avg. Quality Rating, while slicers help users filter the dashboard quickly.
Total Orders by Status: Shows how many orders are completed, pending, cancelled, or in progress. This helps managers monitor fulfillment workload and spot bottlenecks before they affect customers.
Total Revenue by Product Category: Compares revenue across flooring and tile categories. Use it to identify which product groups are driving sales and which categories may need pricing, promotion, or stock review.
Total Revenue by Region: Breaks revenue down by region so teams can see strong and weak markets. It supports regional planning, sales rep coaching, and territory-level decision-making.
Total Revenue by Month: Shows monthly revenue movement over time. This makes it easier to track seasonality, campaign impact, and demand changes in the flooring and tiles business.
Flooring and Tiles Dashboard in Excel
Sales Page
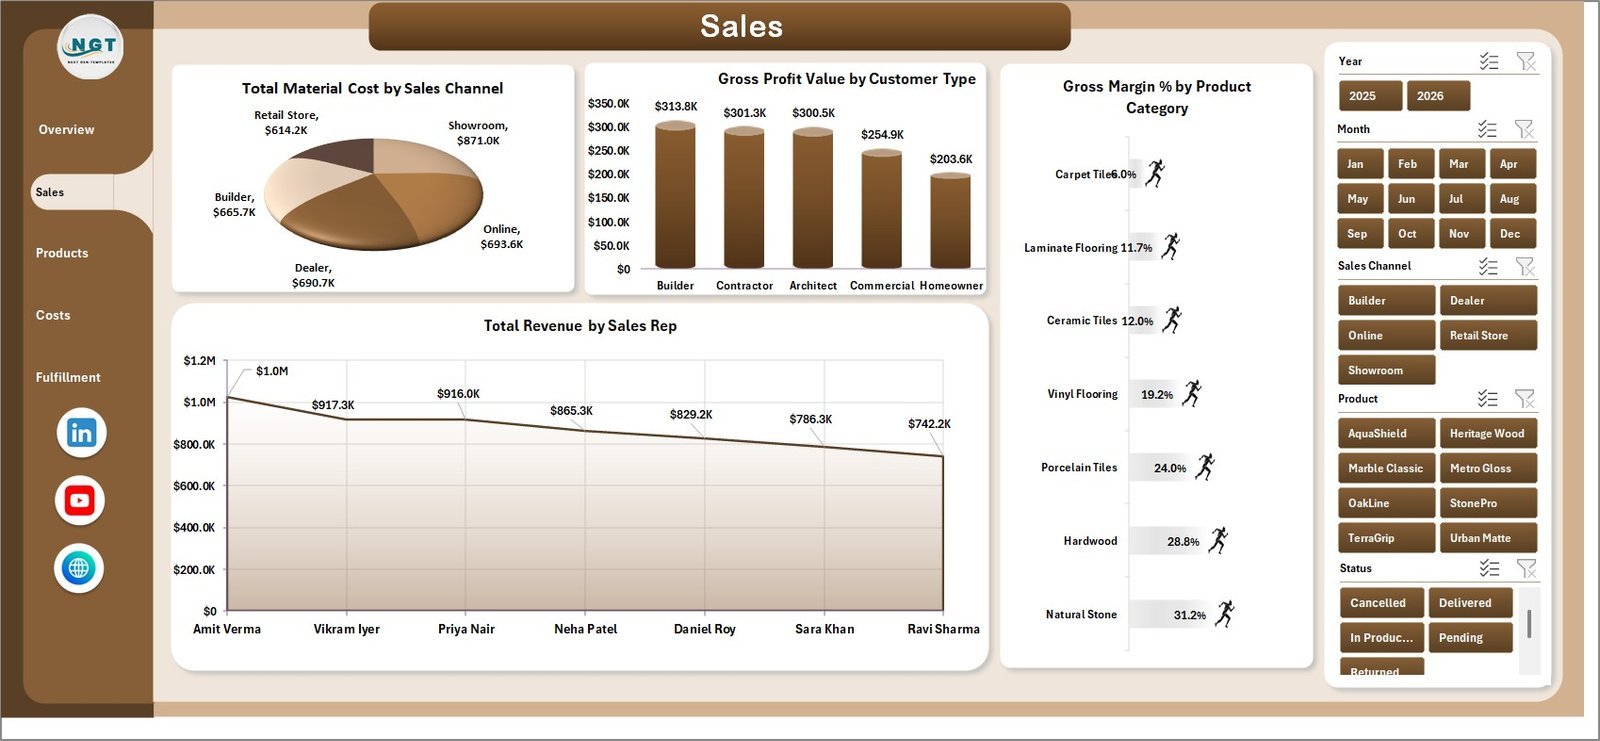
The Sales page focuses on revenue, material cost, gross profit, customer type, sales channel, category, and sales representative performance. It includes Total Material Cost by Sales Channel, Gross Profit Value by Customer Type, Gross Margin % by Product Category, and Total Revenue by Sales Rep.

Sales Page
Products Page
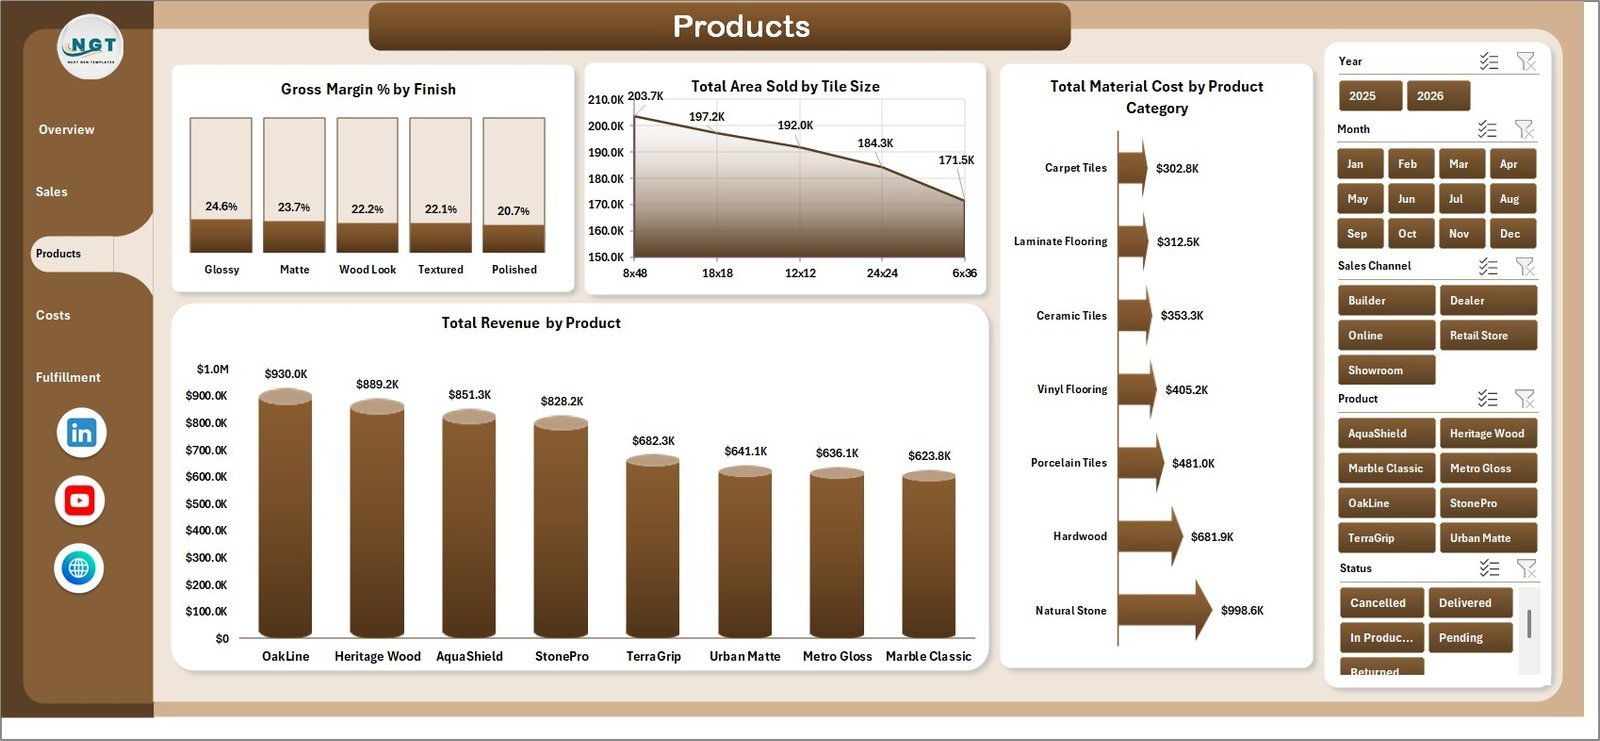
The Products page helps users compare finish, tile size, product category, and product-level revenue. It includes Gross Margin % by Finish, Total Area Sold by Tile Size, Total Material Cost by Product Category, and Total Revenue by Product.

Products Page
Costs Page
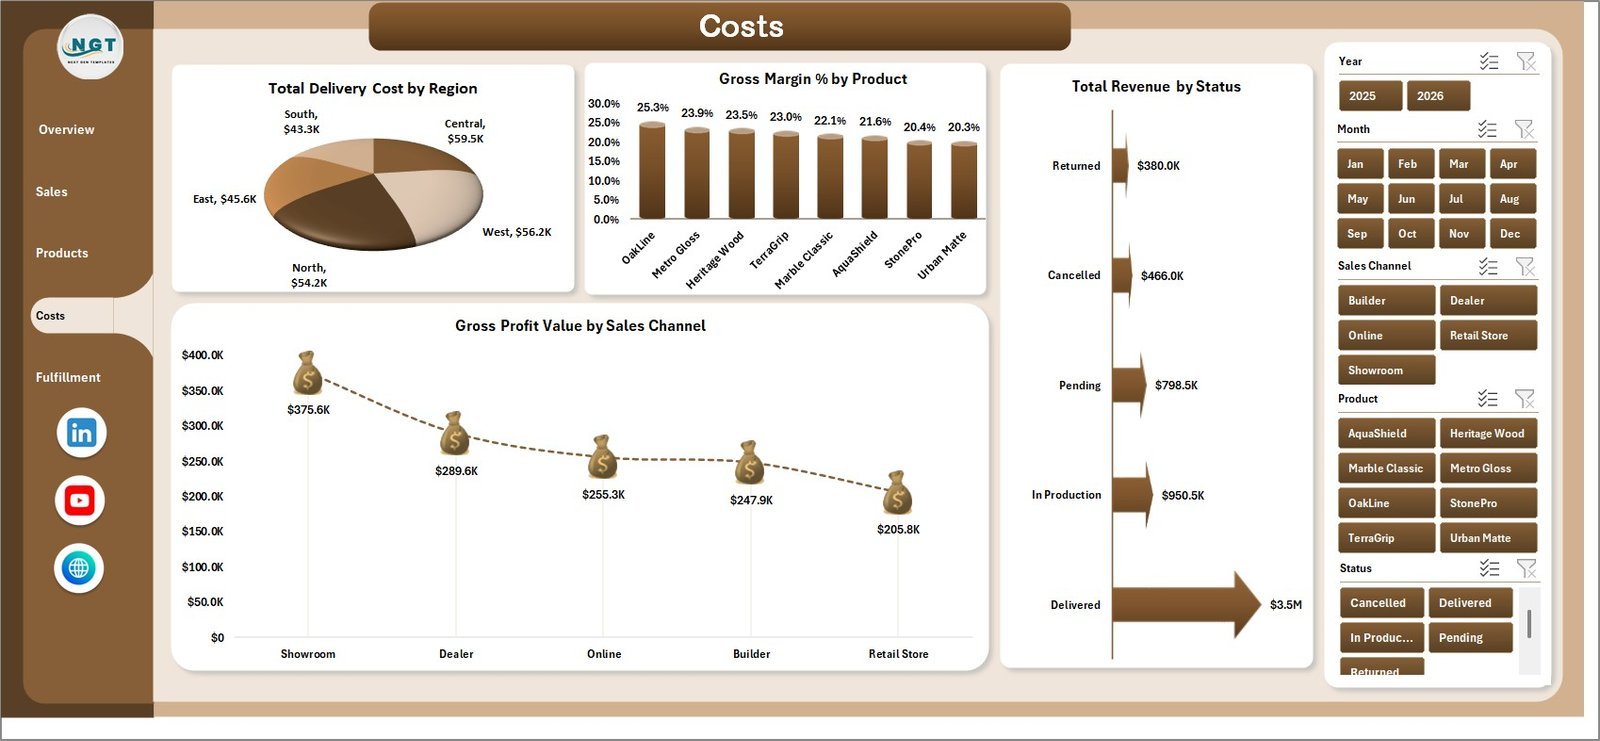
The Costs page supports cost control and margin review. It includes Total Delivery Cost by Region, Gross Margin % by Product, Total Revenue by Status, and Gross Profit Value by Sales Channel.

Costs Page
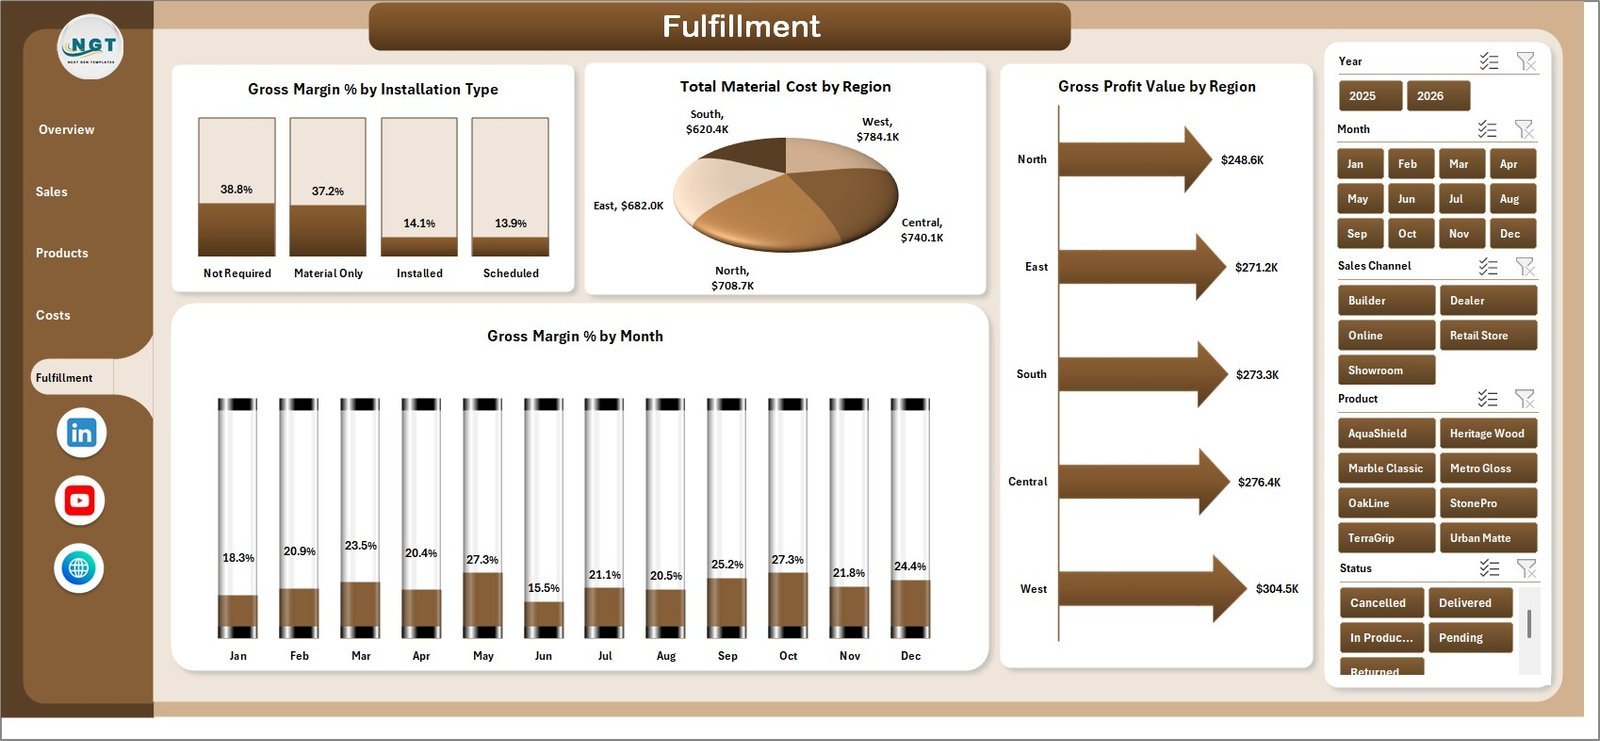
Fulfillment Page
The Fulfillment page connects installation type, material cost, gross profit, region, and monthly margin. It includes Gross Margin % by Installation Type, Total Material Cost by Region, Gross Profit Value by Region, and Gross Margin % by Month.

Fulfillment Page
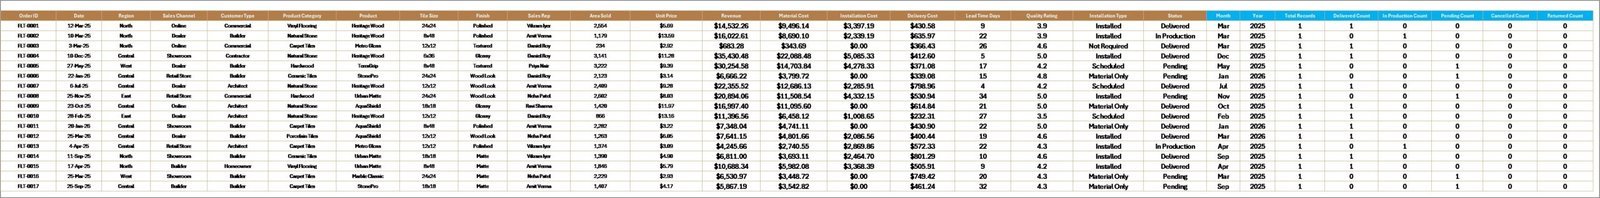
Data Sheet Tab
The Data sheet is where users add flooring and tiles records in the same structured format. Keep the column layout unchanged so dashboard cards, charts, slicers, and pivot tables continue working correctly.
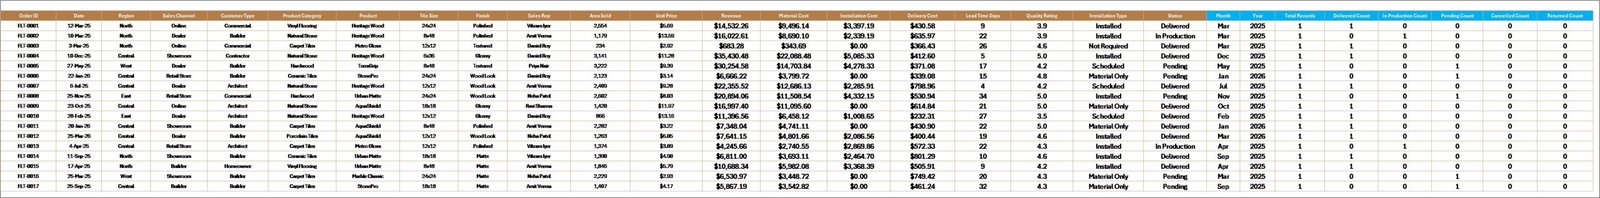
Data Sheet tab
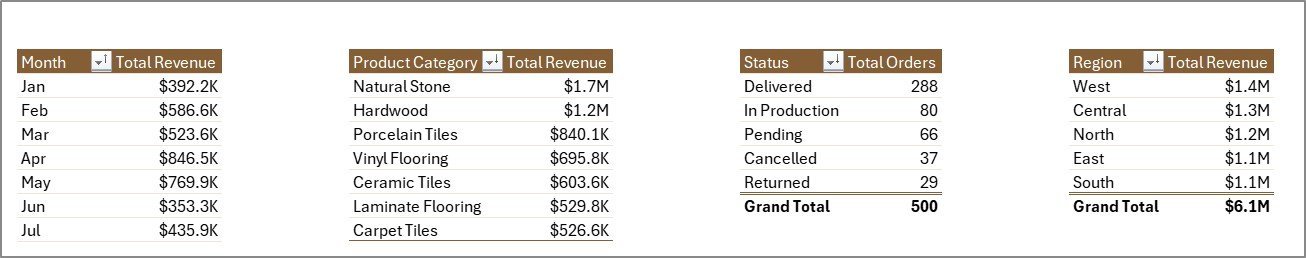
Support Sheet Tab
The Support sheet contains multiple pivot tables used to build the dashboard dynamically. After updating the Data sheet, go to the Data tab in the Excel Ribbon and click Refresh All. You can keep this sheet hidden after setup.
Support sheet tab
Flooring and Tiles Dashboard in Excel vs. Google Sheets vs. Paid CRM/SaaS – Where This Fits
| Feature | This Excel Dashboard | Google Sheets Alternative | Paid CRM/SaaS |
|---|---|---|---|
| Cost | $17.99 one-time | Low one-time cost | Monthly subscription |
| Platform | Microsoft Excel | Browser-based Sheets | Cloud SaaS |
| Setup time | Open, replace data, refresh | Copy file and replace data | Implementation and configuration |
| Customizable fields | High | High | Limited by plan or admin settings |
| Year-1 cost at 5 users | $17.99 total | Low one-time cost | Often hundreds or thousands of dollars |
| Best use case | Fast flooring sales and margin reporting | Shared lightweight reporting | Full CRM, inventory, or ERP workflow |
Who This Template Is For – and Who It’s Not For
This template is for flooring showrooms, tile distributors, installation contractors, regional sales managers, operations analysts, and small business owners who need clear Excel reporting for revenue, orders, costs, margin, area sold, and fulfillment.
It is not a replacement for barcode scanning, live inventory sync, accounting integration, route planning, CRM automation, or full ERP workflows. If you need those live operational features, dedicated software may be a better fit.
How to Use the Flooring and Tiles Dashboard in Excel
- Download and unzip the Excel dashboard file.
- Open the workbook in Microsoft Excel.
- Go to the Data sheet and replace the sample records with your own data.
- Keep the same column structure so pivots and charts work correctly.
- Go to the Excel Ribbon Data tab and click Refresh All.
- Use the slicers to review overview, sales, products, costs, and fulfillment views.
- Hide the Support sheet if you want a cleaner workbook for end users.
Real-World Use Cases
Raj, a tile distributor, reviews Total Revenue by Region and Total Revenue by Product Category before monthly territory meetings.
Meena, a showroom manager, uses Gross Margin % by Product and Finish to decide which product lines need pricing or supplier review.
Arjun, an installation coordinator, checks Gross Margin % by Installation Type and monthly margin movement to understand which job types are most profitable.
Frequently Asked Questions
Does this dashboard work in Microsoft Excel?
Yes. It is built for Microsoft Excel and uses worksheets, slicers, charts, and pivot tables.
Can I replace the sample data?
Yes. Replace the sample rows in the Data sheet, keep the same format, and click Refresh All from the Data tab.
What pages are included?
The workbook includes Overview, Sales, Products, Costs, Fulfillment, Data, and Support sheets.
Can I hide the Support sheet?
Yes. The Support sheet powers the dashboard with pivot tables and can be hidden after setup.
Is this a full inventory or CRM system?
No. It is a reporting dashboard for analysis. It does not include live inventory sync, barcode scanning, invoicing, or CRM automation.
Can I customize the dashboard?
Yes. Experienced Excel users can edit chart fields, slicers, colors, formulas, and the data model as needed.
About the Author
Built by PK – Microsoft Certified Professional with 15+ years of Excel, Google Sheets, and Power BI experience. Founder of NextGenTemplates, reaching 300K+ subscribers across YouTube channels. Every template is hand-built and tested before release.
Explore Related Templates
You may also like the Flooring and Tiles KPI Dashboard in Excel, Fertilizer Manufacturing Dashboard in Excel, and Construction and Real Estate Inventory Management KPI Dashboard in Excel. Browse more Excel Dashboard templates and Sales and Marketing Excel templates.
Click here to read the detailed blog post.
Download the Flooring and Tiles Dashboard in Excel today and turn your flooring sales, costs, product, and fulfillment records into clear business insight.
Last updated: June 14, 2026.


Reviews
There are no reviews yet.