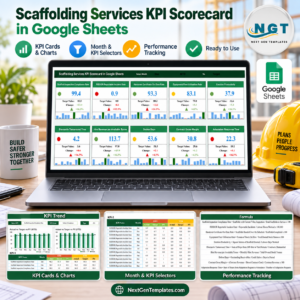
10 scaffolding KPIs, 4 business groups, 12 monthly periods, and MTD plus YTD comparisons sit inside the Scaffolding Services KPI Scorecard in Google Sheets. The scorecard turns monthly actual, target, and prior-year values into ten visual cards, direction-aware status lights, and per-KPI trends. It costs $8.99 on sale, becomes an editable copy in your Google Drive, and requires no add-on, macro, or subscription. The supplied numbers are fictional examples, not construction-industry benchmarks.
Key Features of the Scaffolding Services KPI Scorecard in Google Sheets
- 10 KPI cards: inspection, reportable incidents, handover, fleet use, erection productivity, dismantle turnaround, hire revenue, debtor days, margin, and adaptation response.
- MTD and YTD modes: switch the reporting horizon without rebuilding the page.
- Actual, Target, or PY comparison: choose the reference point shown on every card.
- Month selector: review January through December from one scorecard.
- Direction-aware traffic lights: 6 upper-the-better and 4 lower-the-better metrics are handled correctly.
- Compact monthly charts: each card retains a twelve-month visual history.
- KPI Trend page: select one metric and compare Actual, Target, and Previous Year across MTD and YTD charts.
- Editable definition table: formulas, definitions, units, groups, and UTB/LTB direction remain visible.
- Structured input table: each KPI carries monthly MTD and cumulative YTD values for Actual, Target, and PY.
- Browser collaboration: share the copy through normal Google Drive permissions.
What’s Inside the Scaffolding Services KPI Scorecard in Google Sheets
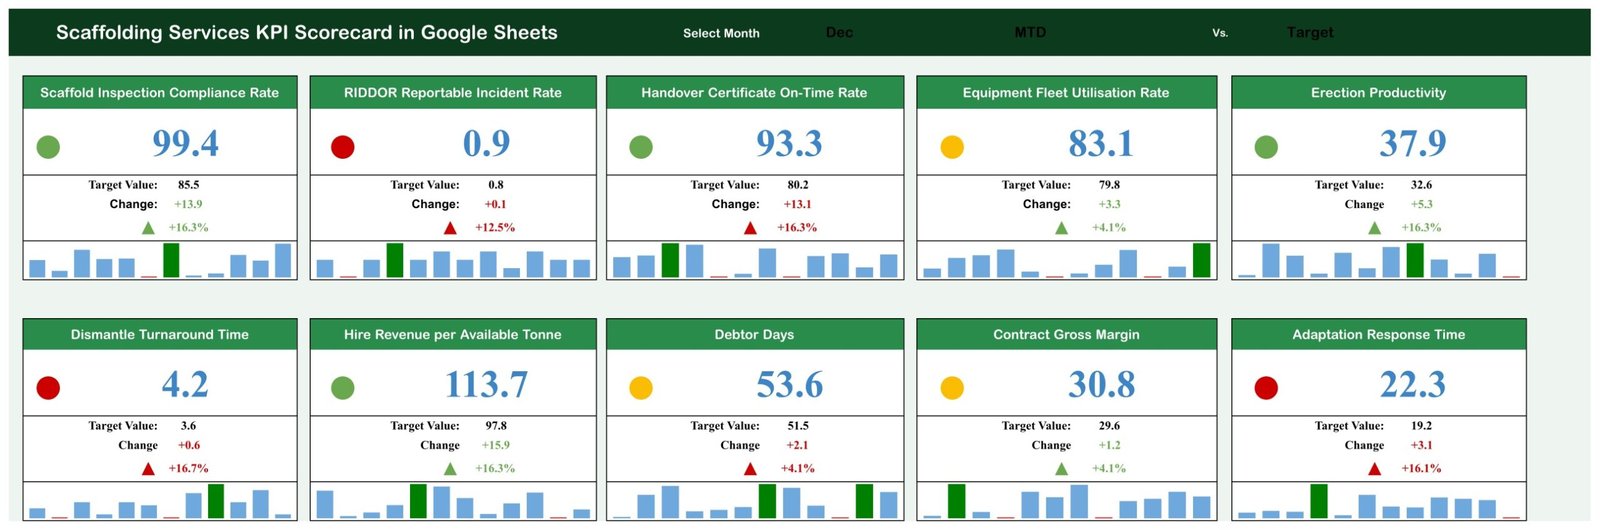
Scorecard: ten cards show the selected month’s value, target, absolute change, percentage change, status light, and compact monthly chart. The supplied December example includes 99.4 for Scaffold Inspection Compliance Rate, 0.9 for RIDDOR Reportable Incident Rate, 93.3 for Handover Certificate On-Time Rate, and 83.1 for Equipment Fleet Utilisation Rate. These are demonstration values only.
KPI Trend: choose a KPI and inspect its group, unit, type, formula, and definition alongside two charts: Actual versus Target versus PY for MTD and for YTD.

KPI Definition: the master list holds ten metrics with their group, unit, written formula, plain-language definition, and scoring direction. This page is the first place to review before replacing sample data.

KPI Data: each KPI has 12 monthly rows and separate MTD and YTD columns for Actual, Target, and PY. The table provides the numeric source for the scorecard and trend page.

The 10 Scaffolding KPIs
| Group | KPIs | Direction |
|---|---|---|
| Safety & Compliance | Scaffold Inspection Compliance Rate; RIDDOR Reportable Incident Rate; Handover Certificate On-Time Rate | Inspection and handover are UTB; incident rate is LTB |
| Operations & Utilisation | Equipment Fleet Utilisation Rate; Erection Productivity; Dismantle Turnaround Time | Turnaround is LTB; the other two are UTB |
| Commercial & Finance | Hire Revenue per Available Tonne; Debtor Days; Contract Gross Margin | Debtor Days is LTB; revenue and margin are UTB |
| Customer & Service | Adaptation Response Time | LTB |
Scaffolding Services KPI Scorecard vs. Excel vs. Paid Hire Software – Where This Fits
| Area | This Google Sheets KPI scorecard | Excel scorecard | Paid scaffold-hire software |
|---|---|---|---|
| Price model | $8.99 sale price, one time | Template plus Microsoft 365 if needed | Recurring subscription |
| Setup | Make a copy and replace monthly figures | Download and edit locally | Implementation and onboarding |
| Collaboration | Google Drive sharing | Usually OneDrive or shared file | Seat-based access |
| Custom metrics | Editable definition and data tables | Editable workbook | Depends on vendor and plan |
| Five-user year-one template cost | $8.99 total | Template plus licences | Usually hundreds or more |
| Asset, site, inspection, or hire records | No; aggregate monthly KPIs only | Depends on workbook | Often included |
| Regulatory reporting | No | No unless separately designed | Varies; verify independently |
Who This Template Is For – and Who It’s Not For
This scaffolding KPI template fits scaffold contractors, access-service companies, hire operations, and project teams that already hold approved monthly totals. As a scaffolding performance scorecard, it lets owners, operations managers, commercial managers, depot managers, and health-and-safety leaders use one review board without copying individual site or worker records into it.
It is not a scaffold register, inspection record, design-calculation tool, handover certificate, RAMS system, asset register, hire-control platform, timesheet, incident log, accounting system, or statutory reporting service. The presence of a RIDDOR-named KPI does not determine whether an incident is reportable and does not submit anything to an authority. Use the official HSE RIDDOR guidance and competent professional advice for reporting duties. The scorecard does not certify compliance with work-at-height, inspection, design, handover, training, or other legal requirements.
How to Use the Scaffolding Services KPI Scorecard in Google Sheets
- Open the downloaded PDF and click the Google Sheets link to make your own editable copy.
- Review all ten definitions, units, formulas, and UTB/LTB directions against your approved policies and jurisdiction.
- Replace the fictional monthly Actual, Target, and PY values in the KPI Data table.
- Select a month, then choose MTD or YTD and the comparison basis on the Scorecard.
- Open KPI Trend to investigate one result across the year.
- Protect formula cells and limit edit access to designated owners.
Real-World Use Cases
An operations manager can compare Equipment Fleet Utilisation Rate, Erection Productivity, and Dismantle Turnaround Time before deciding whether a problem is capacity, deployment, or yard return speed.
A commercial manager can read Hire Revenue per Available Tonne, Debtor Days, and Contract Gross Margin together rather than celebrating revenue while collection time or margin deteriorates.
A safety leader can review the inspection, incident-rate, and handover indicators as internal signals, while continuing to use the company’s approved records and official reporting process.
A customer-service lead can track Adaptation Response Time without storing customer names, addresses, or site details in this summary workbook.
Frequently Asked Questions
How many KPIs are included?
Ten. They span Safety & Compliance, Operations & Utilisation, Commercial & Finance, and Customer & Service.
Can I change the KPI definitions?
Yes. Review the definition and data structures carefully and test the scorecard after any change.
How are lower-is-better metrics scored?
RIDDOR Reportable Incident Rate, Dismantle Turnaround Time, Debtor Days, and Adaptation Response Time are LTB metrics. Their comparisons treat lower actual values as favourable.
Does this replace scaffold inspection or handover records?
No. It holds aggregate KPI values only and is not evidence that any scaffold was inspected, designed, handed over, or safe to use.
Does the scorecard make a RIDDOR report?
No. It neither decides reportability nor submits reports. Follow current official HSE guidance and your responsible person’s process.
Are the example figures benchmarks?
No. They are fictional values used to demonstrate the formulas, cards, and charts.
Do I need an add-on?
No. The supplied workbook is formula-driven and works in Google Sheets without an add-on or macro.
About the Author
Built by PK – Microsoft Certified Professional with 15+ years of Excel, Google Sheets, and Power BI experience. Founder of NextGenTemplates, reaching 300K+ subscribers across YouTube channels. Every template is hand-built and tested before release.
Explore Related Templates
- Home Renovation Contractor KPI Scorecard in Google Sheets
- Paving Contractor KPI Scorecard in Google Sheets
- Concrete Contractor KPI Scorecard in Google Sheets
- Roofing Contractor KPI Scorecard in Google Sheets
- Browse the Google Sheets KPI collection.
Turn approved monthly totals into one consistent management review. Get this editable scaffolding scorecard for a one-time $8.99 sale price.
Watch the step-by-step video Demo:
Last updated: September 11, 2026.