

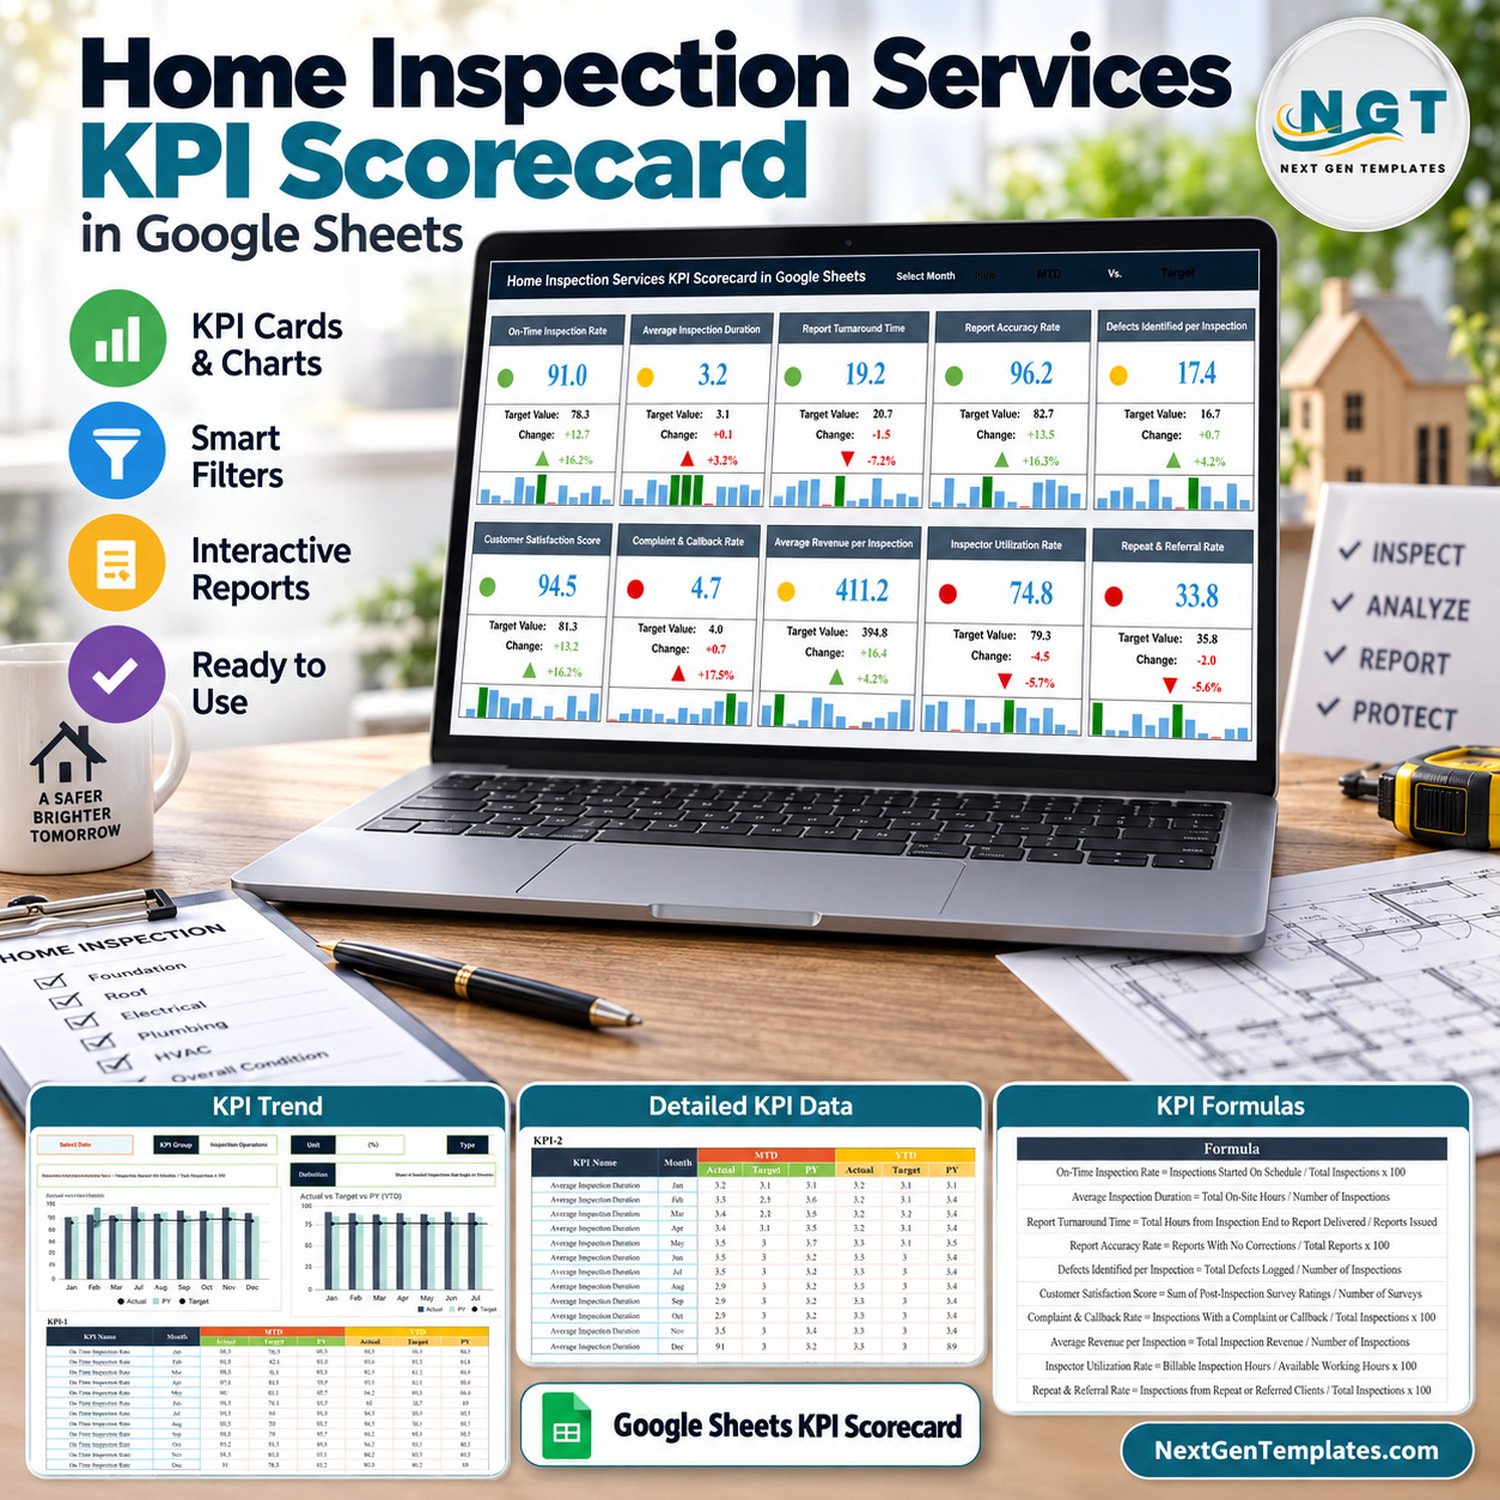
Review 10 home inspection business KPIs on one monthly page. The Home Inspection Services KPI Scorecard in Google Sheets puts on-time inspections, report turnaround, report accuracy, customer satisfaction, revenue per inspection and inspector utilization side by side as ten KPI cards. Pick a month, switch between MTD and YTD, compare against Target or Previous Year, and every card updates its value, traffic light, change and 12-month mini bar chart. It ships with twelve months of fictional sample data so you can see it working before you type a number. It is a management scorecard for the business side of an inspection company, not report-writing, scheduling or licensing software.
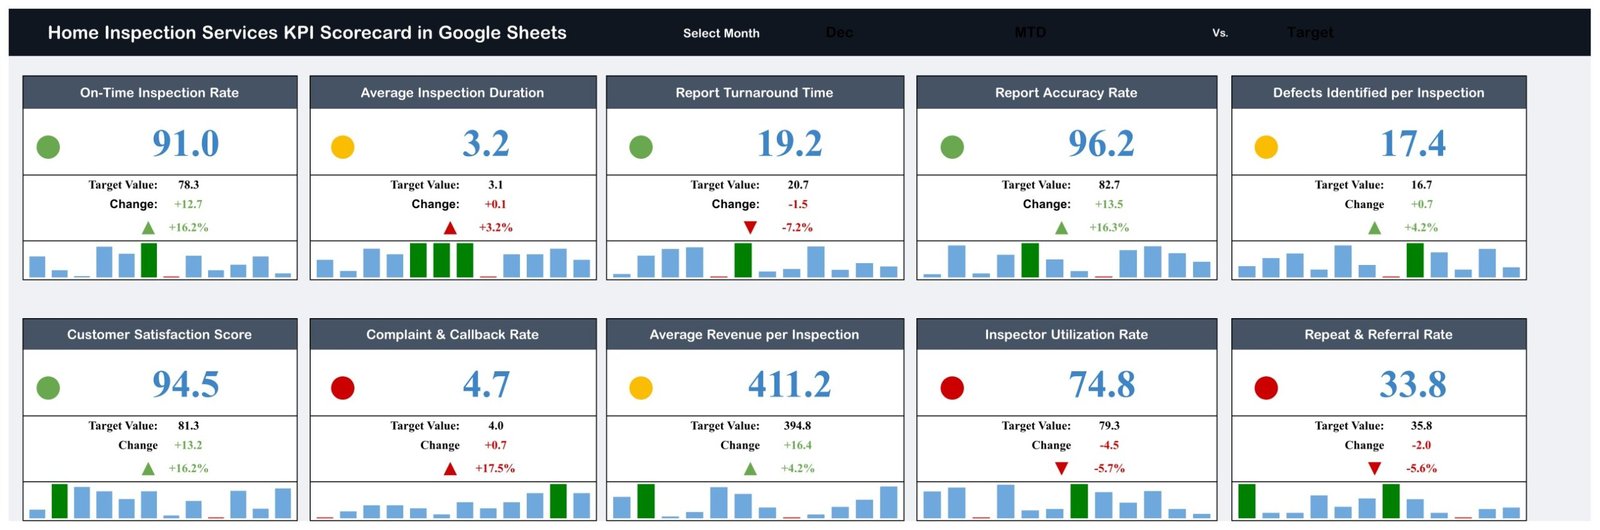
The Scorecard page: ten KPI cards with status lights, change vs comparison and monthly mini charts
✅ Instant download · One-time payment · No subscription · No per-user fees · Lifetime access
Key Features of the Home Inspection Services KPI Scorecard
- 📅 Three selectors drive the page. Select Month, MTD or YTD, and Target or PY at the top of the Scorecard. The sample file opens on December, MTD vs Target.
- 🚦 Traffic-light status on every card. Green, amber and red lights compare the actual value with the chosen comparison, and the rules respect each KPI’s direction.
- 🎯 Upper-the-Better and Lower-the-Better KPIs. Seven KPIs are UTB and three are LTB: Average Inspection Duration, Report Turnaround Time and Complaint & Callback Rate.
- 📊 Change and change % with arrows. Each card shows the target (or PY) value, the absolute change and the percentage change with an up or down arrow.
- 📈 12-month mini charts. A small bar chart under every card shows the KPI across the year.
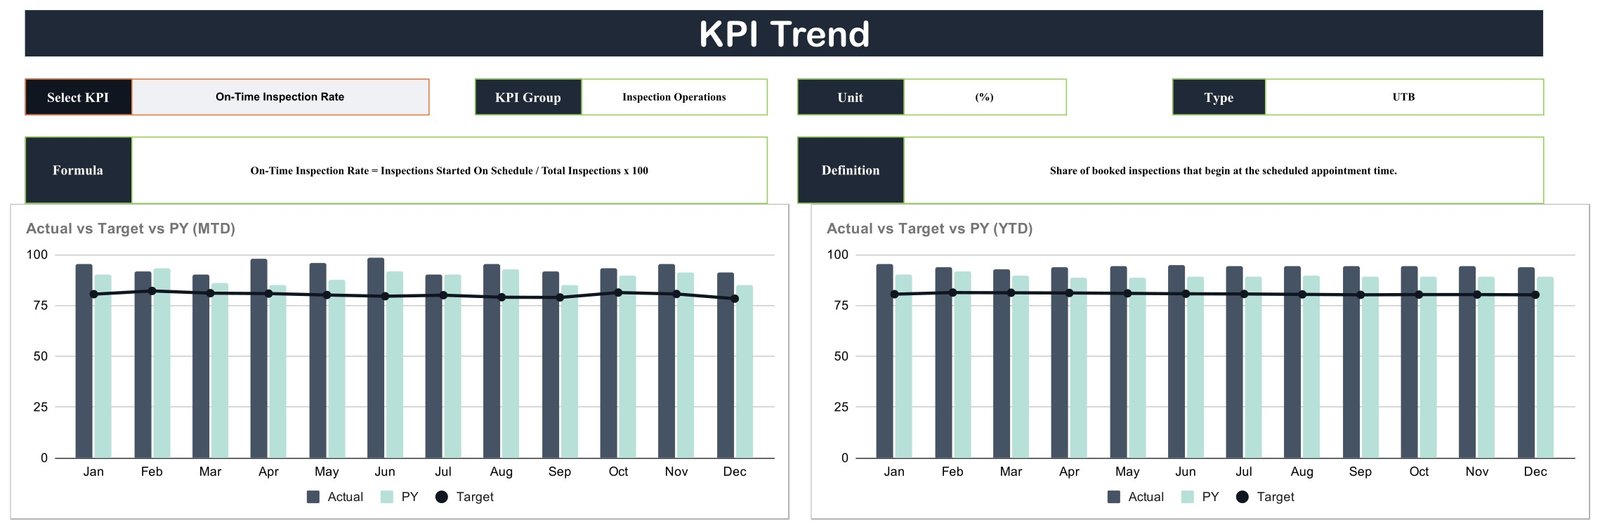
- 🔍 KPI Trend page. Choose any KPI to see its group, unit, formula, definition and type, plus Actual vs Target vs PY charts for MTD and YTD.
- 🧩 One KPI Definition list. Group, name, unit, formula, definition and UTB/LTB type for all ten KPIs live in one editable table.
What’s Inside the Home Inspection Services KPI Scorecard in Google Sheets
Page 1: Scorecard
Ten cards in two rows: On-Time Inspection Rate, Average Inspection Duration, Report Turnaround Time, Report Accuracy Rate, Defects Identified per Inspection, Customer Satisfaction Score, Complaint & Callback Rate, Average Revenue per Inspection, Inspector Utilization Rate and Repeat & Referral Rate. In the December MTD vs Target sample view, four cards are green, three amber and three red.
Page 2: KPI Trend
A Select KPI dropdown fills the KPI Group, Unit, Type, Formula and Definition boxes, and two column charts compare Actual, PY and Target month by month for MTD and for YTD.
Page 3: KPI Definition
Ten rows grouped into Inspection Operations, Report Quality, Customer Experience, Financial and Business Growth, each with its unit, formula, plain-English definition and UTB or LTB type.

Page 4: Input Data
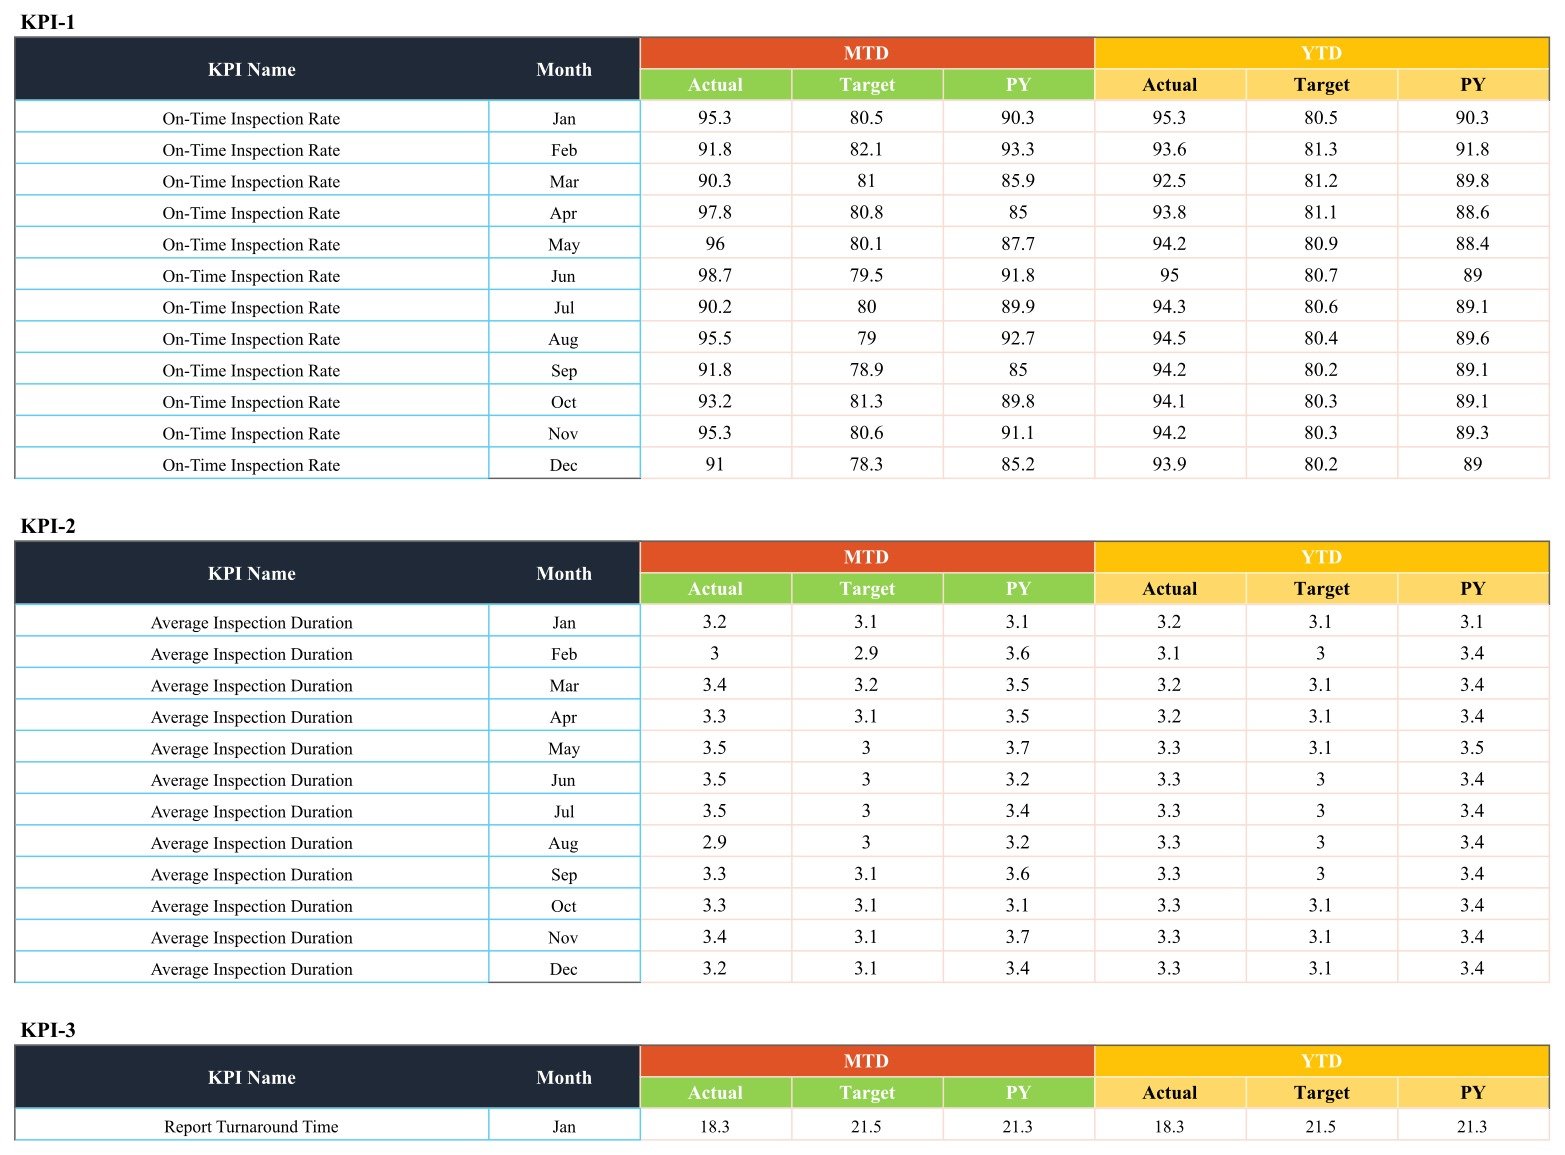
One block per KPI (KPI-1 to KPI-10) with twelve month rows and MTD Actual, Target and PY plus YTD Actual, Target and PY columns. All six columns are typed values; YTD is entered by you, not calculated from the monthly figures.
Scorecard vs Spreadsheet vs Inspection Software
| Consideration | This Google Sheets scorecard | A blank spreadsheet | Inspection business software |
|---|---|---|---|
| Cost | One-time purchase | Free, but you build everything | Usually a monthly subscription |
| Setup | Make a copy, replace sample numbers | Design layout, formulas and charts | Account setup and onboarding |
| Monthly KPI review | 10 cards, traffic lights, trend page | Whatever you create | Varies by plan |
| Report writing, booking, payments | Not included | Not included | Often included |
| Sharing | Google Drive sharing | Depends on the tool | User seats |
Who This Template Is For
Owners of single-inspector or multi-inspector home inspection companies, operations managers who hold a monthly review, and consultants who help an inspection business agree a small set of measures. It is not inspection report software, a booking or payment system, a licensing or standards-of-practice tool, or legal or real-estate advice. It does not pull data from other systems; you enter the monthly numbers.
How to Use It
- Download the PDF and click its Google Sheets link to make your own copy.
- Edit the KPI Definition table if you want different names, formulas or directions.
- Type your monthly MTD and YTD Actual, Target and PY values into Input Data.
- Choose the month, MTD or YTD, and Target or PY on the Scorecard.
- Open KPI Trend to review any KPI across the year.
Frequently Asked Questions
Does it write inspection reports?
No. It summarises KPI values you enter. It does not create reports, checklists or client documents.
Is YTD calculated automatically?
No. YTD Actual, Target and PY are typed into Input Data alongside the MTD values.
Can I change the KPIs?
Yes. Names, groups, units, formulas, definitions and types are editable on KPI Definition. The Scorecard has ten card positions.
Do I need Excel or an add-on?
No. It runs in Google Sheets in the browser with a Google account. No macros or add-ons.
What do I receive?
A PDF that contains the link to create your editable Google Sheets copy.
Explore Related Templates
Read the full walkthrough on our blog: Home Inspection Services KPI Scorecard in Google Sheets guide. Browse more Google Sheets templates and Google Sheets KPI templates. For sharing your copy, see Google’s Google Sheets sharing help.
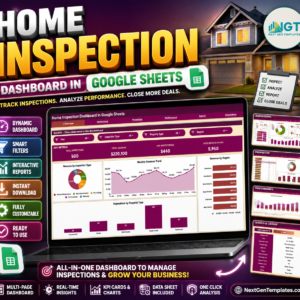
- Home Inspection Dashboard in Google Sheets – a different build: a slicer-driven analytics dashboard on inspection records rather than a monthly KPI scorecard
- Home Renovation Contractor KPI Scorecard in Google Sheets
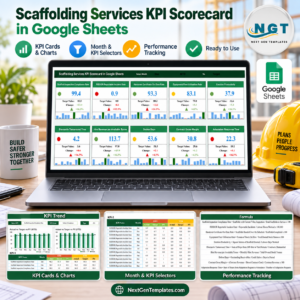
- Scaffolding Services KPI Scorecard in Google Sheets
- Demolition Services KPI Scorecard in Google Sheets
Tutorials: youtube.com/@PKAnExcelExpert
About the Author
Built by PK – Microsoft Certified Professional with 15+ years of Excel, Google Sheets and Power BI experience, founder of NextGenTemplates.
Watch the step-by-step video Demo:
Last updated: September 17, 2026.


















Reviews
There are no reviews yet.