

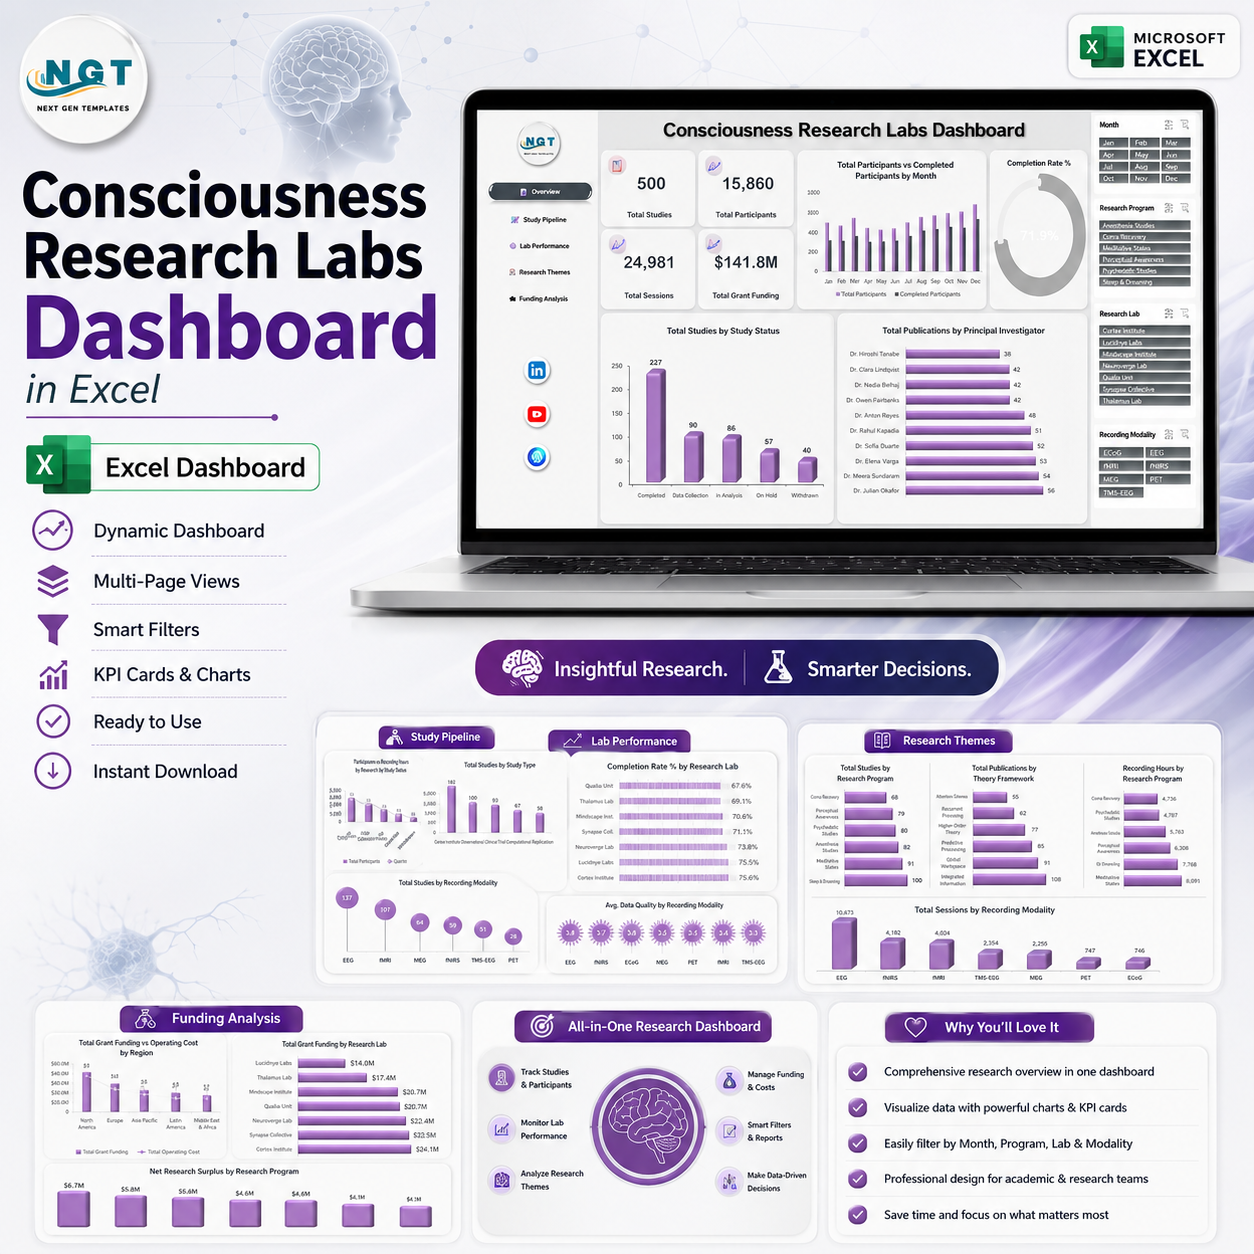
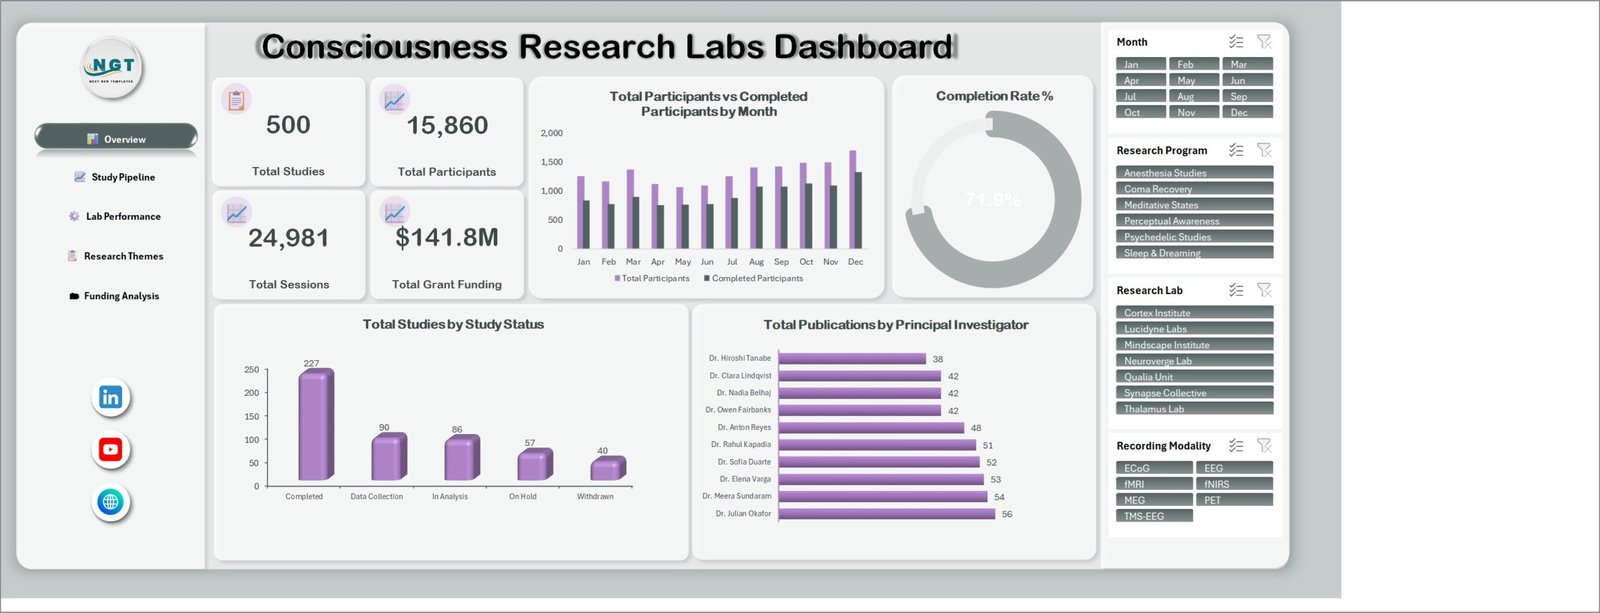
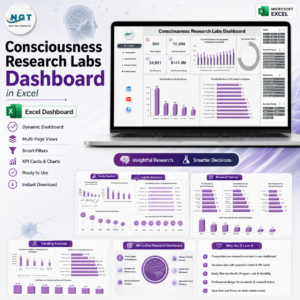
The Consciousness Research Labs Dashboard in Excel turns a year of neuroscience programme data into five report pages you can read in under a minute. The sample build carries 500 studies, 15,860 enrolled participants, 24,981 recording sessions and $141.8M in grant funding across seven labs and six research programmes, and every number recalculates the moment you paste your own rows in. It is built with plain Excel formulas and pivot-driven charts – no macros, no Power Pivot licence, no add-ins – so it opens on any machine running Excel 2016 or later, including Excel for Mac and Microsoft 365. Downloads are instant, the file is unlocked and fully editable, and if it does not open on your setup we refund it. Over 300,000 subscribers follow the NextGenTemplates channels for templates built this way. Consciousness Research Labs Dashboard in Excel
A note on which template this is: this is the analytical Excel dashboard – five wide report pages driven by slicers, built for exploring a research portfolio. It is not a monthly KPI scorecard with a month picker and traffic lights. If you want the scorecard format instead, browse the Excel KPI Dashboard category.
Key Features of the Consciousness Research Labs Dashboard in Excel
- Four synced slicers on every page. Month, Research Program, Research Lab and Recording Modality sit in a fixed right-hand rail. Click Psychedelic Studies plus fMRI and all five pages answer that question together.
- Four headline cards. Total Studies, Total Participants, Total Sessions and Total Grant Funding sit above the fold on the Overview page and move with the slicers.
- A completion-rate donut. One 71.9% figure for enrolment-to-completion, so a drop after a protocol change shows up immediately.
- Study status breakdown. Completed 227, Data Collection 90, In Analysis 86, On Hold 57 and Withdrawn 40 – the pipeline in one column chart.
- Principal investigator publication ranking. All ten PIs from 38 to 56 publications, ranked, on both the Overview and Lab Performance pages.
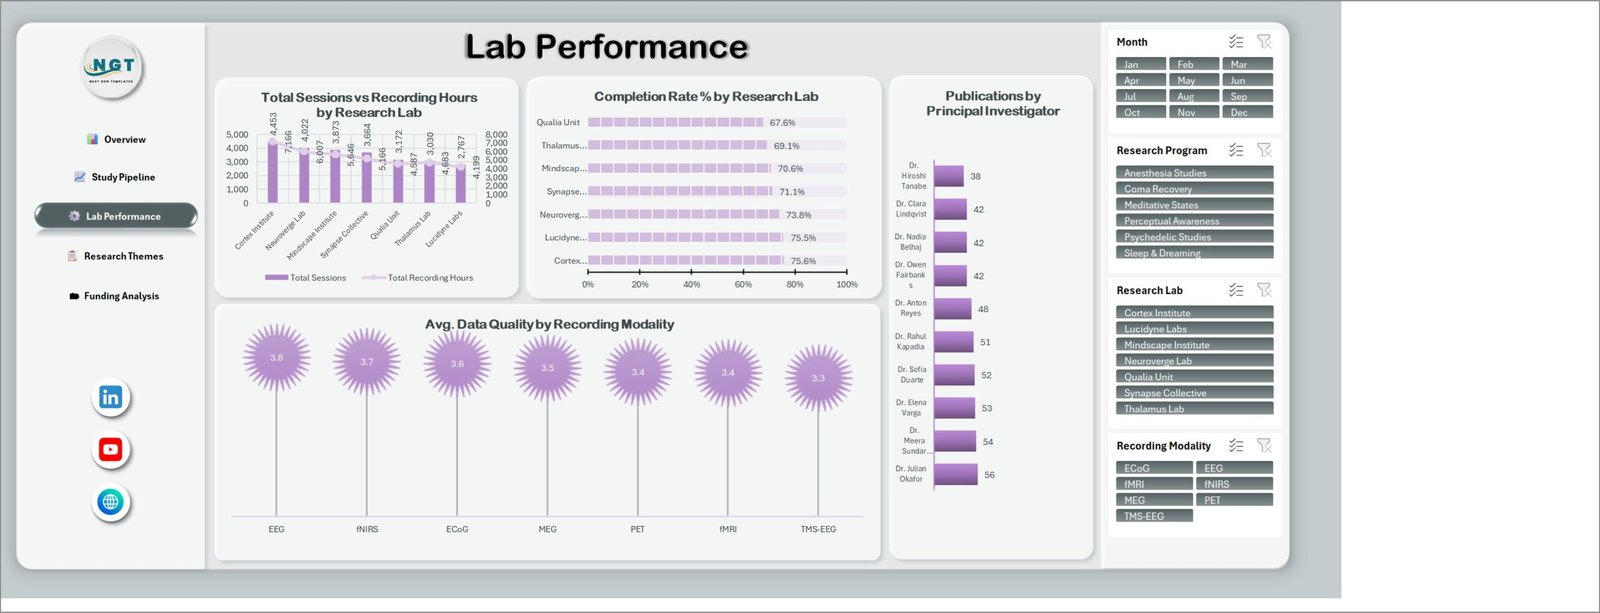
- Seven-lab comparison. Sessions against recording hours, plus completion rate from 67.6% to 75.6%, so a lab that runs many sessions but converts few of them is obvious.
- Recording modality depth. Studies, sessions and average data-quality score for EEG, fMRI, MEG, fNIRS, TMS-EEG, ECoG and PET.
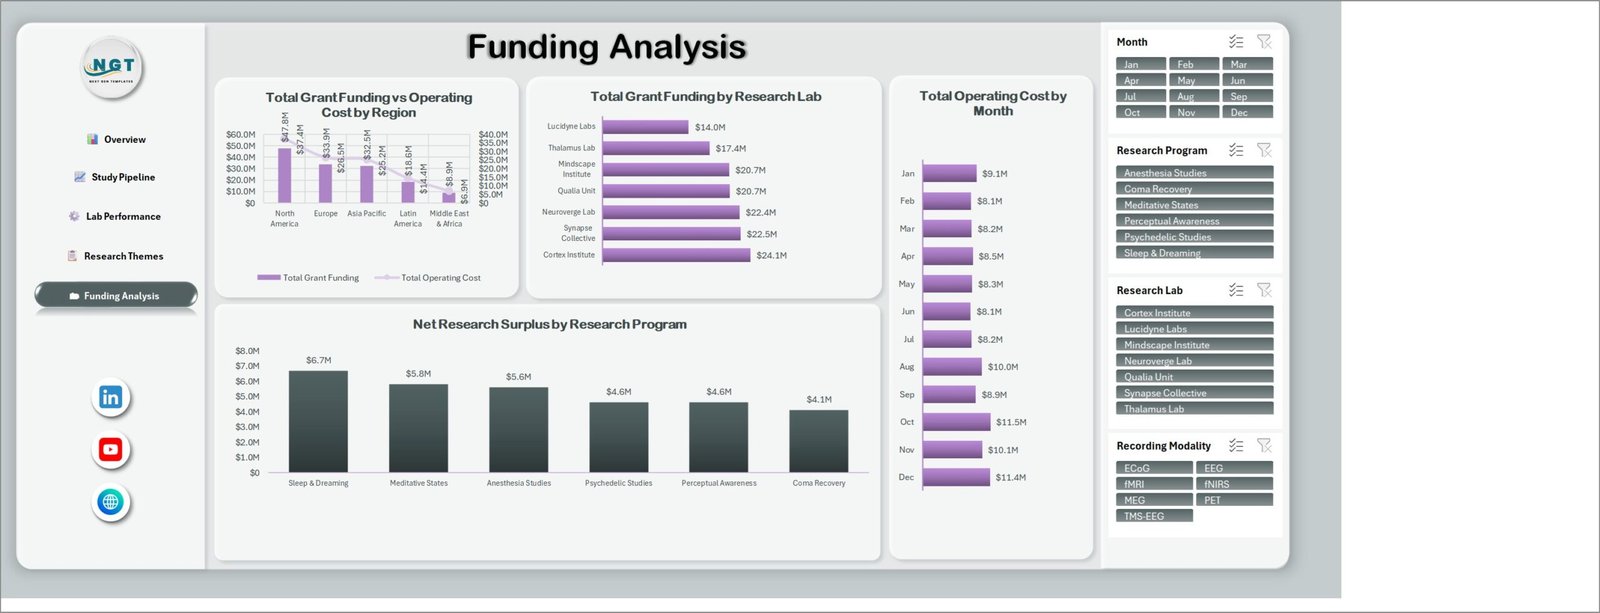
- Funding against cost. Grant funding versus operating cost across five regions, monthly operating cost, and net research surplus by programme. Consciousness Research Labs Dashboard in Excel
What’s Inside the Consciousness Research Labs Dashboard in Excel
Page 1 – Overview. The four KPI cards, Total Participants vs Completed Participants by Month, the Completion Rate % donut, Total Studies by Study Status and Total Publications by Principal Investigator.
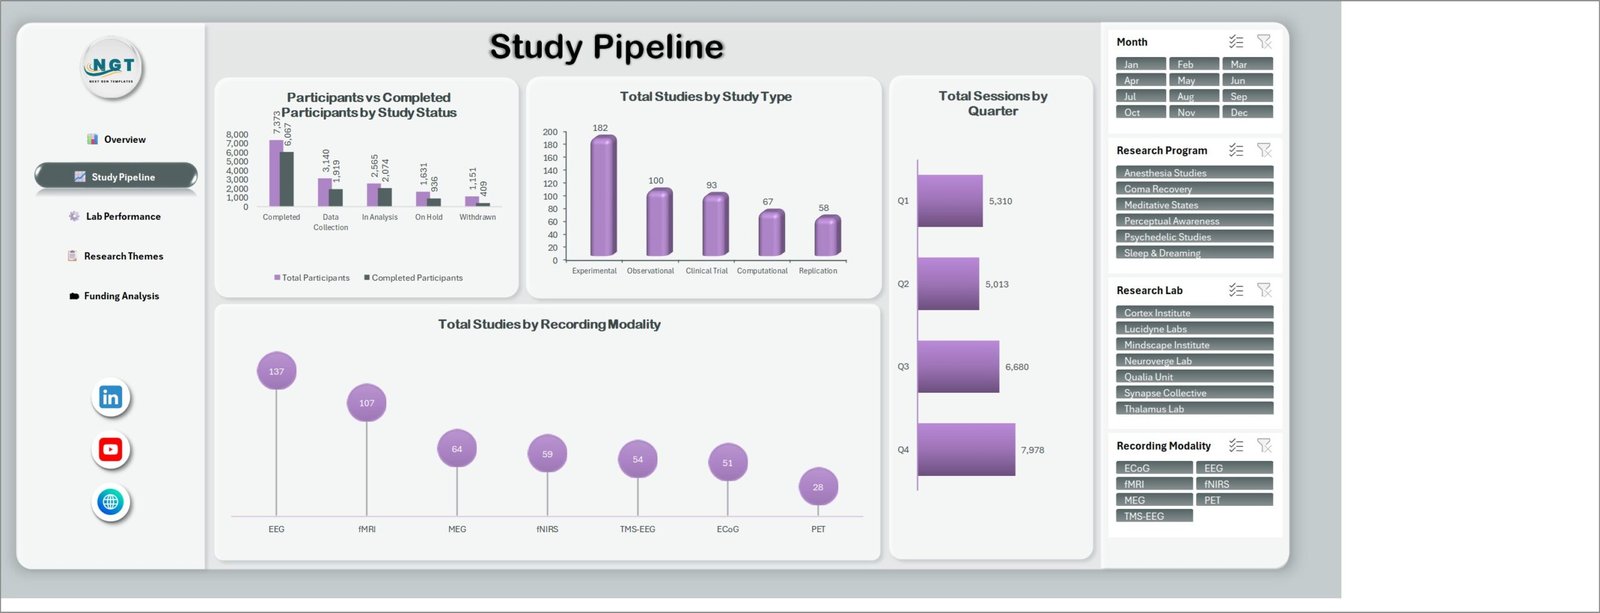
Page 2 – Study Pipeline. Participants vs Completed Participants by Study Status, Total Studies by Study Type (Experimental 182, Observational 100, Clinical Trial 93, Computational 67, Replication 58), Total Sessions by Quarter (Q1 5,310 rising to Q4 7,978) and Total Studies by Recording Modality.
Page 3 – Lab Performance. Total Sessions vs Recording Hours by Research Lab, Completion Rate % by Research Lab, Publications by Principal Investigator and Avg. Data Quality by Recording Modality (EEG 3.8 down to TMS-EEG 3.3).
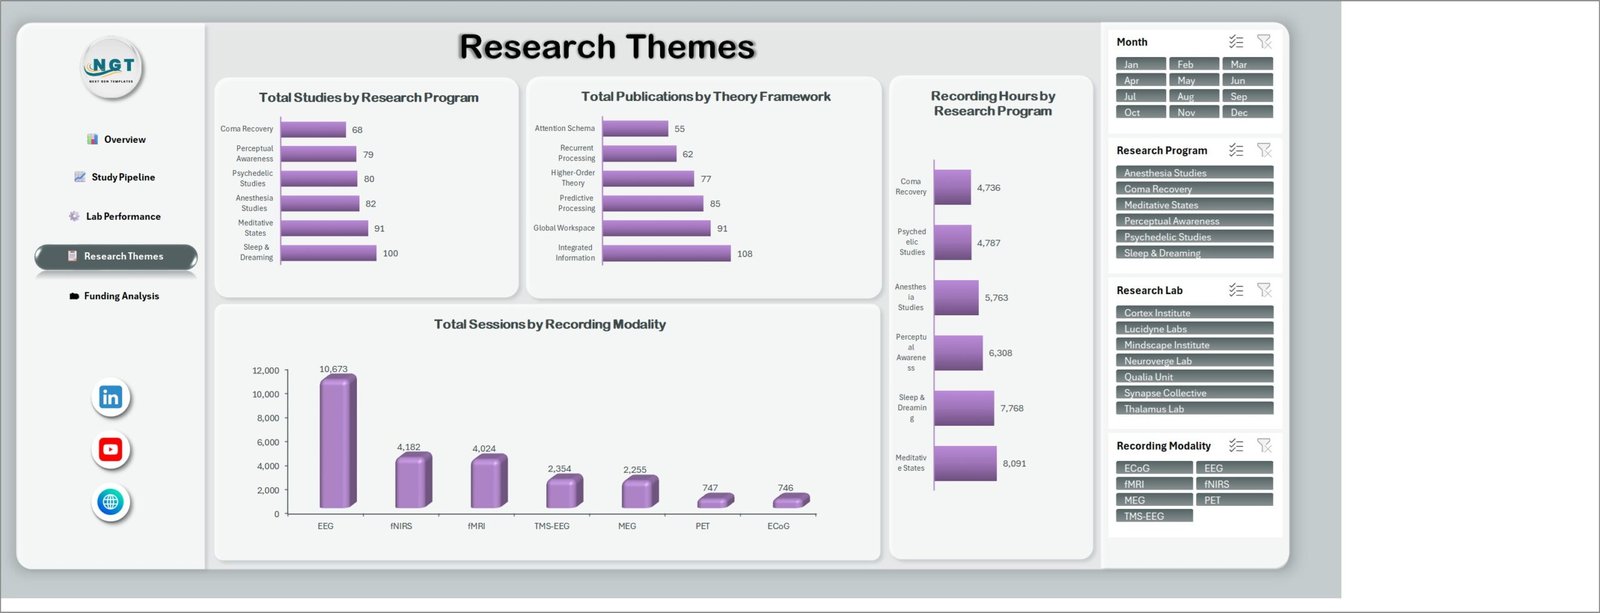
Page 4 – Research Themes. Total Studies by Research Program, Total Publications by Theory Framework (Integrated Information 108, Global Workspace 91, Predictive Processing 85, Higher-Order Theory 77, Recurrent Processing 62, Attention Schema 55), Recording Hours by Research Program and Total Sessions by Recording Modality.
Page 5 – Funding Analysis. Total Grant Funding vs Operating Cost by Region, Total Grant Funding by Research Lab, Total Operating Cost by Month and Net Research Surplus by Research Program, where Sleep & Dreaming clears $6.7M and Coma Recovery $4.1M.
Behind the pages sit the data sheet you paste into and the pivot layer that feeds every chart. Nothing is hard-coded to the sample rows. Consciousness Research Labs Dashboard in Excel
Consciousness Research Labs Dashboard in Excel vs. Google Sheets vs. Paid Research SaaS – Where This Fits
| What matters | This Excel dashboard | Google Sheets build | REDCap Cloud / LabArchives |
|---|---|---|---|
| Cost | $17.99 once | Free tool, days of build time | $3,000-$25,000 per year |
| Platform | Excel 2016+, Mac, 365 | Browser only | Vendor cloud |
| Setup time | Under 20 minutes | 2-5 days to build | 6-12 weeks with vendor onboarding |
| Real-time team collaboration | Via OneDrive or SharePoint | Native | Native |
| Mobile access | Excel mobile, read-only slicers | Full | Full |
| Customisable fields | Add columns and the pivots follow | Yes, you build them | Change requests to the vendor |
| Share with a link | Yes, from OneDrive | Yes | Yes |
| Year-1 cost at 5 users | $17.99 | $0 plus build time | $15,000+ |
| Grant funding vs operating cost view | Built in, by region and programme | Build it yourself | Finance module, usually extra |
| Modality-level data quality scoring | Built in for 7 modalities | Build it yourself | Rarely included |
Who This Template Is For – and Who It’s Not For
It fits lab managers running several consciousness or neuroscience programmes at once, research directors reporting to a funding board, grants officers who need income against operating cost by region, and PhD coordinators tracking enrolment and withdrawal across concurrent studies.
It does not fit anyone who needs live instrument feeds – this reads a data sheet, it does not connect to an EEG rig. It is not an eCRF or a regulated clinical data capture system, so do not use it as a system of record for a regulated trial. And if you have a single study with twenty participants, a plain sheet will serve you better than five report pages. Consciousness Research Labs Dashboard in Excel
How to Use the Consciousness Research Labs Dashboard in Excel
- Download the ZIP, extract it and open the workbook in Excel. Enable editing when prompted.
- Open the data sheet and replace the sample rows with your own studies, sessions, participants, publications and cost lines. Keep the column headers as they are.
- Press Ctrl + Alt + F5 to refresh all pivots. Every chart, card and slicer picks up the new rows.
- Use the right-hand slicer rail to filter. The four slicers are connected across all five pages, so one click re-scopes the whole report.
- Adjust programme names, lab names and modality labels in the data sheet – the slicer buttons rebuild themselves from your values.
- Print or export any page to PDF for a funding board pack.
Real-World Use Cases
Dr. Meera, lab director at a university consciousness centre. She runs six programmes across three sites. Each quarter she filters to the quarter, exports the Lab Performance page, and shows the board that Cortex Institute converts 75.6% of enrolled participants while Qualia Unit sits at 67.6% – which is what triggered a recruitment review.
Tomas, grants and finance officer. He works only on the Funding Analysis page. North America draws $47.8M of grant funding against $37.4M of operating cost; Middle East & Africa runs $8.9M against $6.9M. The net surplus chart tells him which programmes can absorb a new post-doc.
Aisha, study coordinator. She lives on the Study Pipeline page. When On Hold studies climbed to 57 she used the modality slicer to find that most of them were fMRI-dependent and waiting on scanner time.
Frequently Asked Questions
Does this need macros or any add-in?
No. It is a plain .xlsx workbook with formulas, pivot tables and slicers. Nothing to enable, nothing to install, and it passes corporate macro blocks.
Which Excel versions does it work in?
Excel 2016, 2019, 2021 and Microsoft 365 on Windows and Mac. Slicers need a desktop version – Excel Online will display the charts but slicer clicks are limited.
Can I add my own research programmes, labs and modalities?
Yes. Type them into the data sheet and refresh. The slicer buttons and every chart axis rebuild from your values, so you are not stuck with the seven sample labs.
Is this the same as your KPI scorecard templates?
No. This is the analytical dashboard – five wide pages driven by slicers. The KPI scorecard line is a different format with a month picker, target-versus-actual traffic lights and a trend page.
How many rows can I paste in?
The sample carries 500 studies and around 25,000 sessions. Pivot tables handle far more; tens of thousands of rows refresh in a couple of seconds on ordinary hardware.
Can I rebrand it for my institution?
Yes. The workbook is unlocked. Swap the logo, change the colour palette and edit the page titles.
Do I get updates?
Yes. Re-download from your account whenever the file is revised. There is no subscription. Consciousness Research Labs Dashboard in Excel
About the Author
Built by PK – Microsoft Certified Professional with 15+ years of Excel, Google Sheets, and Power BI experience. Founder of NextGenTemplates, reaching 300K+ subscribers across YouTube channels. Every template is hand-built and tested before release.
Explore Related Templates
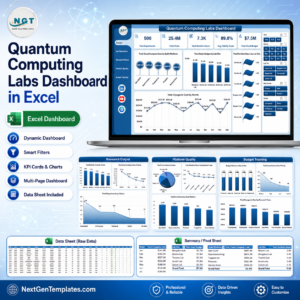
- Quantum Computing Labs Dashboard in Excel – the same five-page layout for a physics lab portfolio.
- Laboratory Instruments Dashboard in Excel – instrument utilisation, calibration and downtime.
- Clinical Trials Management Dashboard in Excel – site enrolment, screening and protocol deviations.
- Clinical Data Management Dashboard in Excel – query ageing and data-cleaning throughput.
- Browse the full Excel Dashboard category or every MS Excel template.
Get the Consciousness Research Labs Dashboard in Excel for $17.99 instead of $29.99. Instant download, unlocked file, lifetime updates, and a refund if it does not open on your setup. Read the full walkthrough on PK-AnExcelExpert.com.
Last updated: 19 August 2026.




























Reviews
There are no reviews yet.