

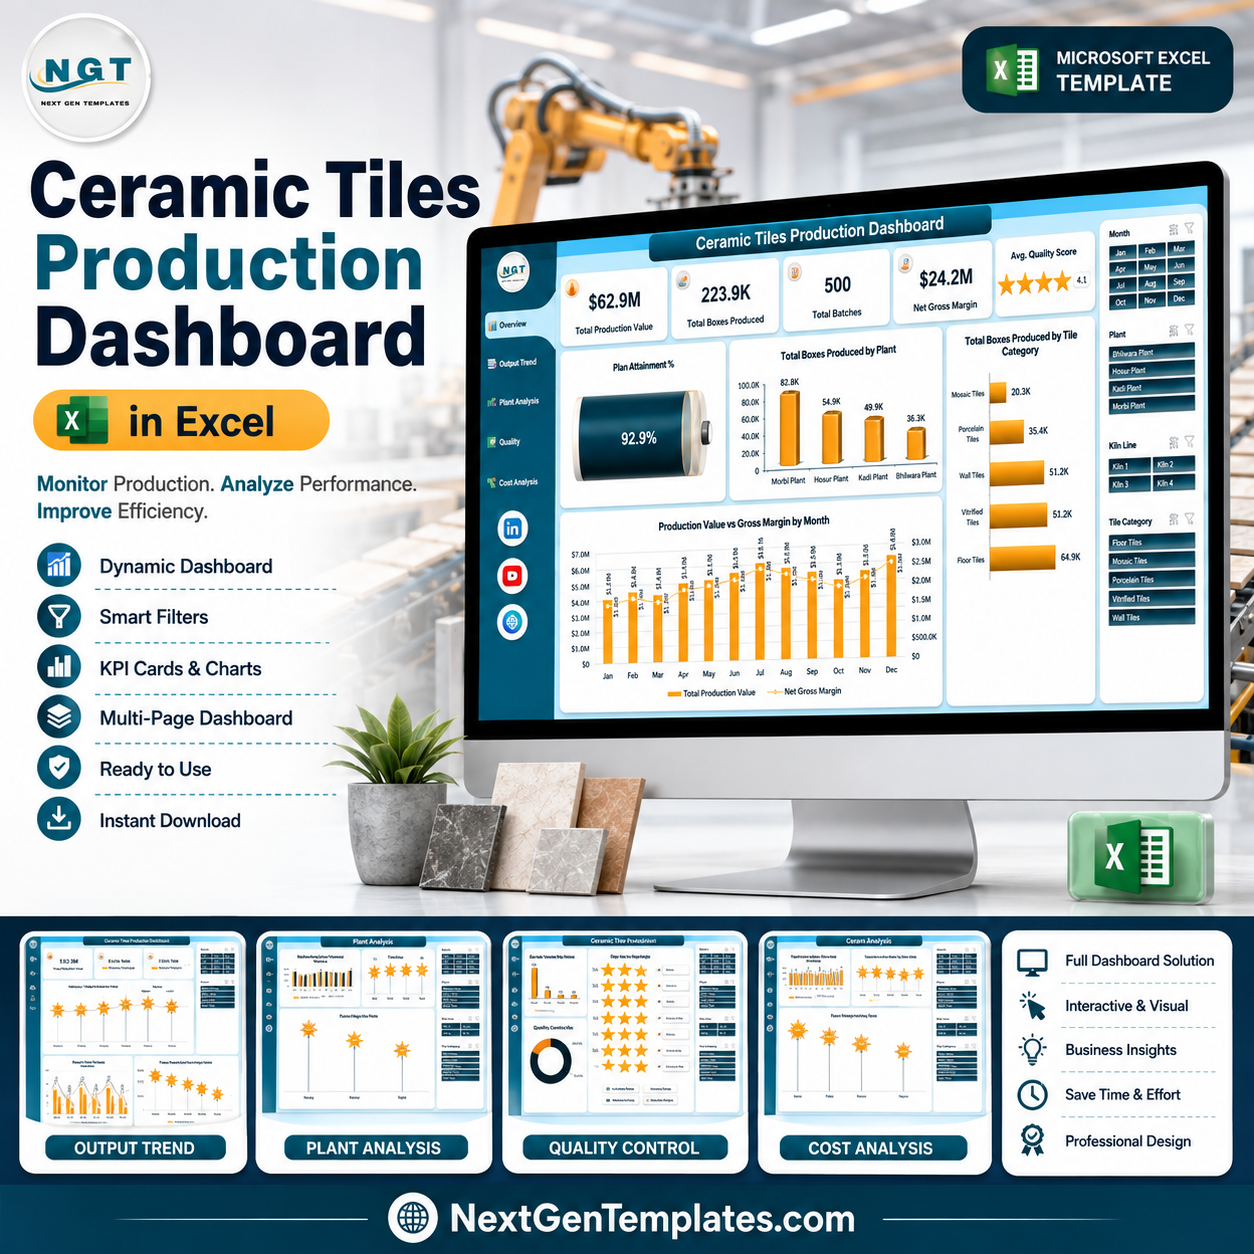
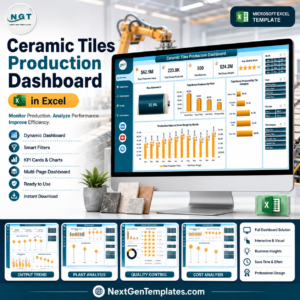
The Ceramic Tiles Production Dashboard in Excel reports on 500 sample batch records across 5 interactive pages, with 5 KPI cards, 20 charts and 4 page-synced slicers (Month, Plant, Kiln Line and Tile Category). Setup takes under 10 minutes: paste your own batch records into the Data sheet, refresh, and every page redraws from your numbers.
🌍 Join 8,400+ teams in 40+ countries using NextGenTemplates to replace paid SaaS tools with one-time-purchase Excel, Google Sheets, Power BI, and HTML templates.
✅ Instant download · One-time payment · No subscription · No per-user fees · Lifetime access
Important: this is a production reporting workbook that charts the data you type in. It does not test tiles, certify quality, or assess safety or compliance. See the “not for” list below.
🔑 Key Features of the Ceramic Tiles Production Dashboard in Excel
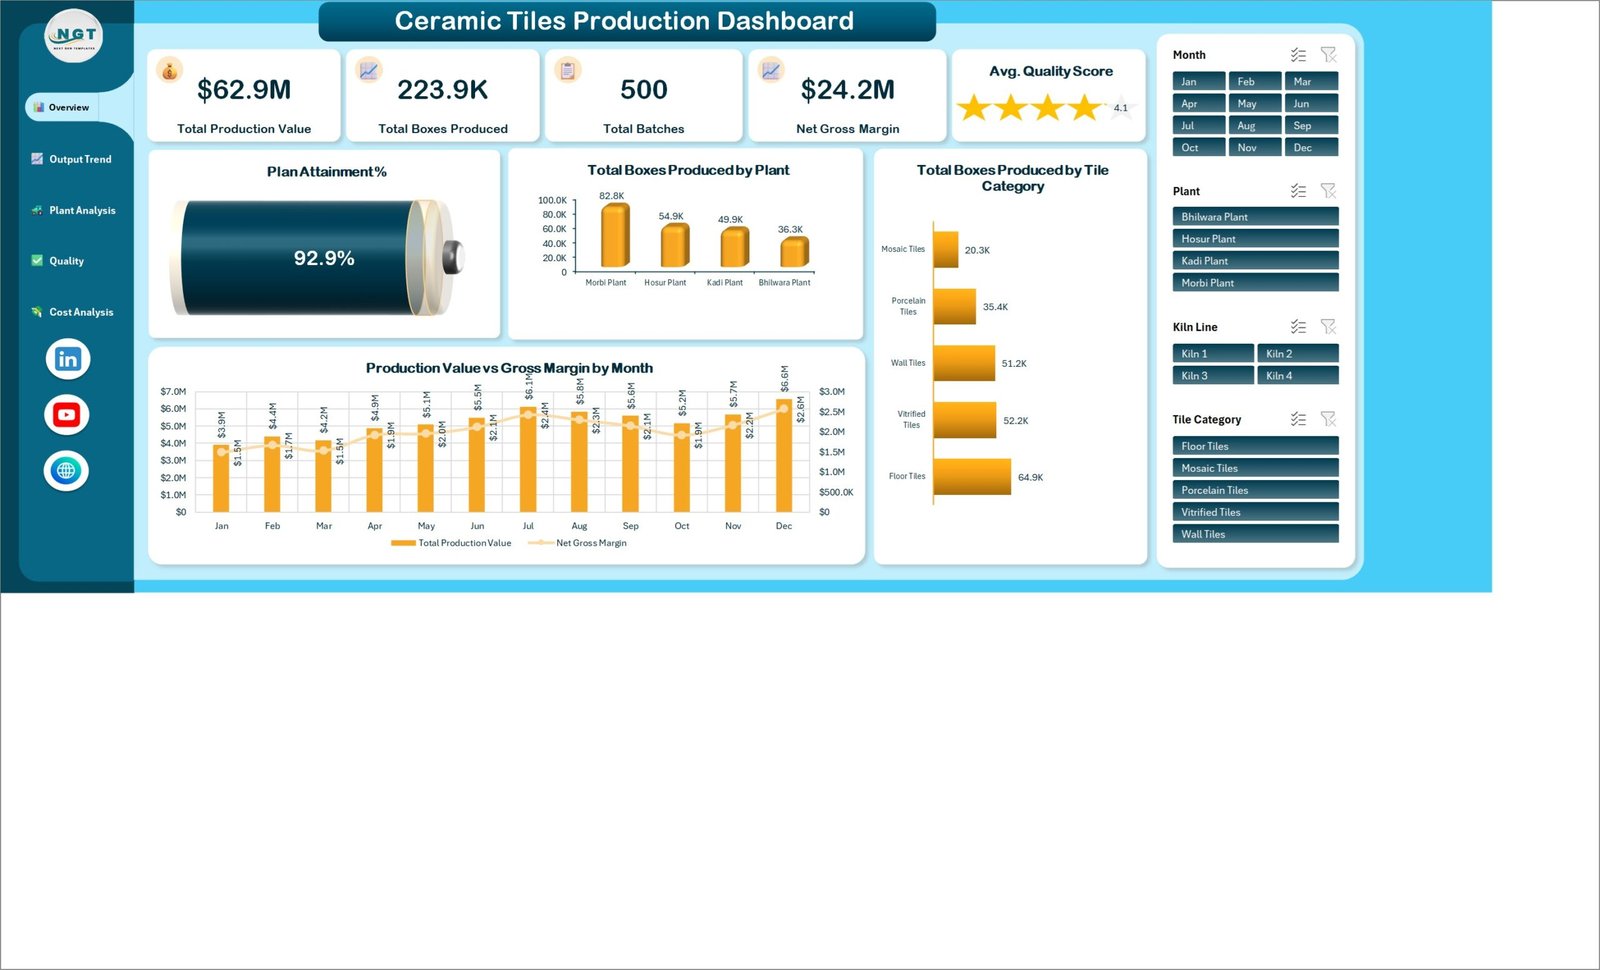
📊 Five KPI cards on one screen. The Overview page totals Production Value, Boxes Produced, Batches, Net Gross Margin and Average Quality Score. On the shipped demo data these read $62.9M, 223.9K boxes, 500 batches, $24.2M and 4.1 – every figure recalculates from your own rows.
🎯 A Plan Attainment % gauge. The Overview carries a battery-style gauge comparing Boxes Produced against Boxes Planned; the demo data sits at 92.9%. Because both fields are columns you fill in, the gauge follows whatever plan you set for the month, plant or kiln line.
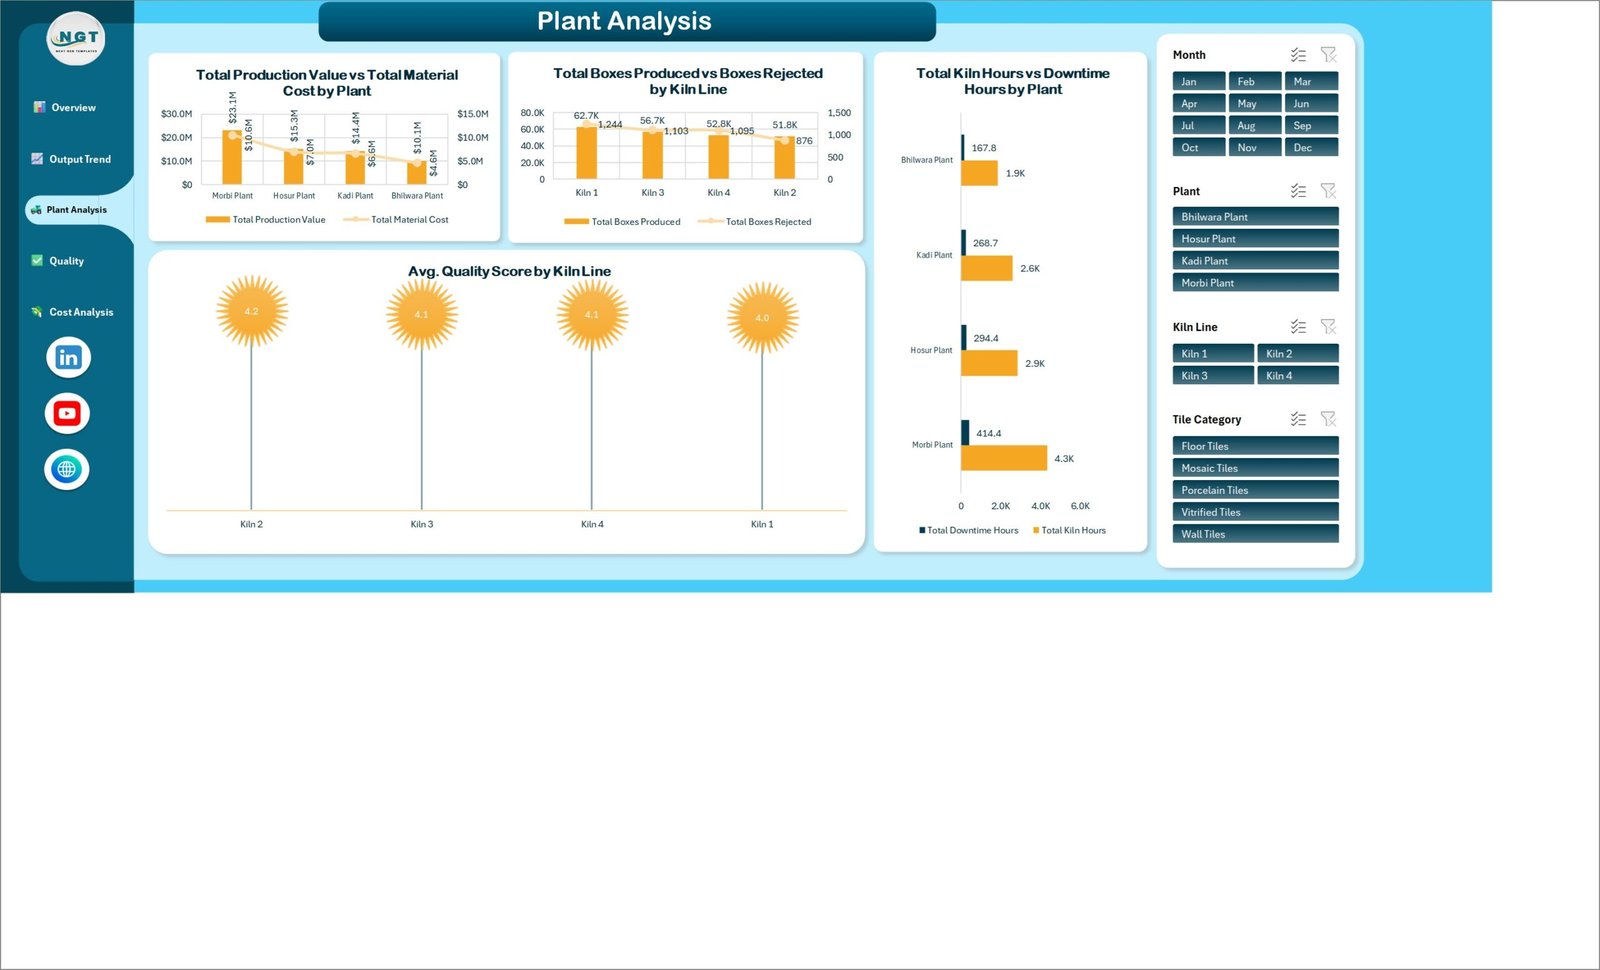
🔥 Kiln and downtime reporting. Total Kiln Hours vs Downtime Hours by Plant, Total Downtime Hours by Month, and Total Boxes Produced vs Boxes Rejected by Kiln Line let you see which of the four kiln lines is running hot and which is losing hours.
🧱 Category, size and finish breakdowns. Output splits by Tile Category (Floor, Wall, Vitrified, Porcelain and Mosaic), while rejections split by Tile Size (300×300, 600×600, 800×800 and 1200×600 mm) and by Finish Type (Glossy, Matte, Rustic and Polished).
💰 Cost and margin on the same page. Production Value is charted against Raw Material Cost and Energy Cost, and Net Gross Margin is broken out by Region and by Order Type (Domestic, Export and OEM) so the commercial picture sits next to the plant picture.
🎛️ Four slicers that move all five pages together. Click Morbi Plant or Kiln 3 once and the Overview, Output Trend, Plant Analysis, Quality Control and Cost Analysis pages all filter to it. This works because the slicers are connected to shared pivot caches, not copied per sheet.
🧾 A plain .xlsx with no macros. The workbook holds seven sheets – five dashboard pages, a Data sheet and a Support sheet that stores every pivot table. Nothing needs enabling, and it opens in Excel 2016 or later and in Microsoft 365 on Windows and Mac.
📦 What’s Inside the Ceramic Tiles Production Dashboard in Excel
Page 1: Overview
The landing page shows five KPI cards – Total Production Value, Total Boxes Produced, Total Batches, Net Gross Margin and an Avg. Quality Score star card – above a Plan Attainment % gauge. Charts are Total Boxes Produced by Plant, Total Boxes Produced by Tile Category, and Production Value vs Gross Margin by Month.
Page 2: Output Trend
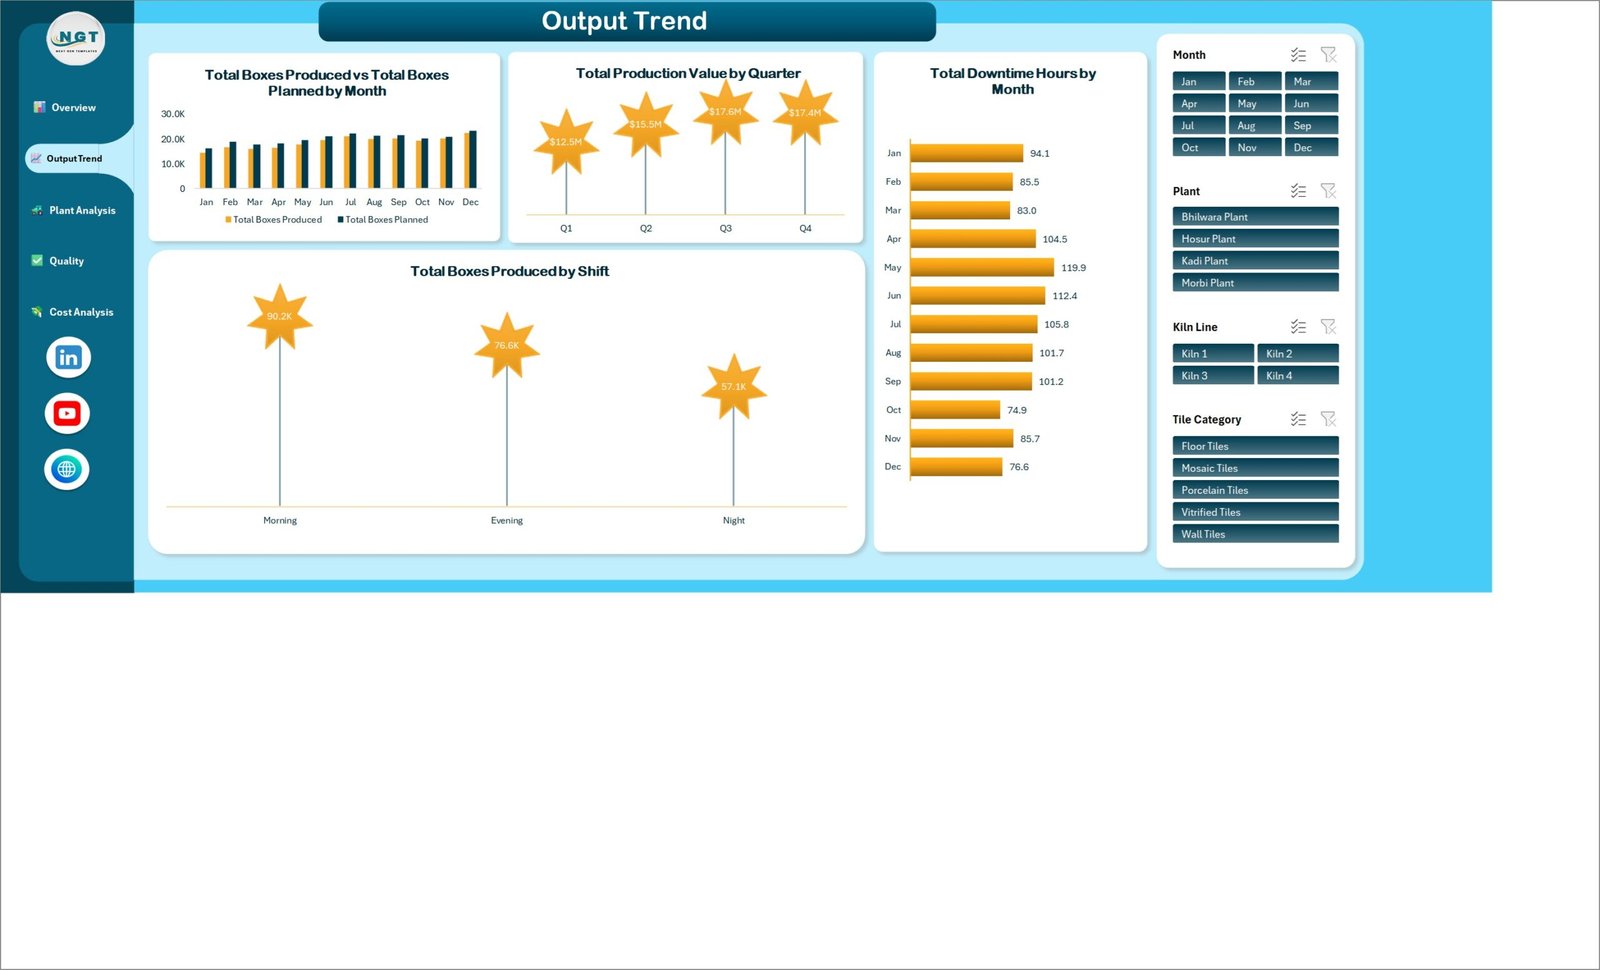
The trend page compares plan against actual over the year with Total Boxes Produced vs Total Boxes Planned by Month, then adds Total Production Value by Quarter, Total Downtime Hours by Month, and Total Boxes Produced by Shift across Morning, Evening and Night.
Page 3: Plant Analysis
Four plants sit side by side here: Total Production Value vs Total Material Cost by Plant, Total Boxes Produced vs Boxes Rejected by Kiln Line, Total Kiln Hours vs Downtime Hours by Plant, and Avg. Quality Score by Kiln Line.
Page 4: Quality Control
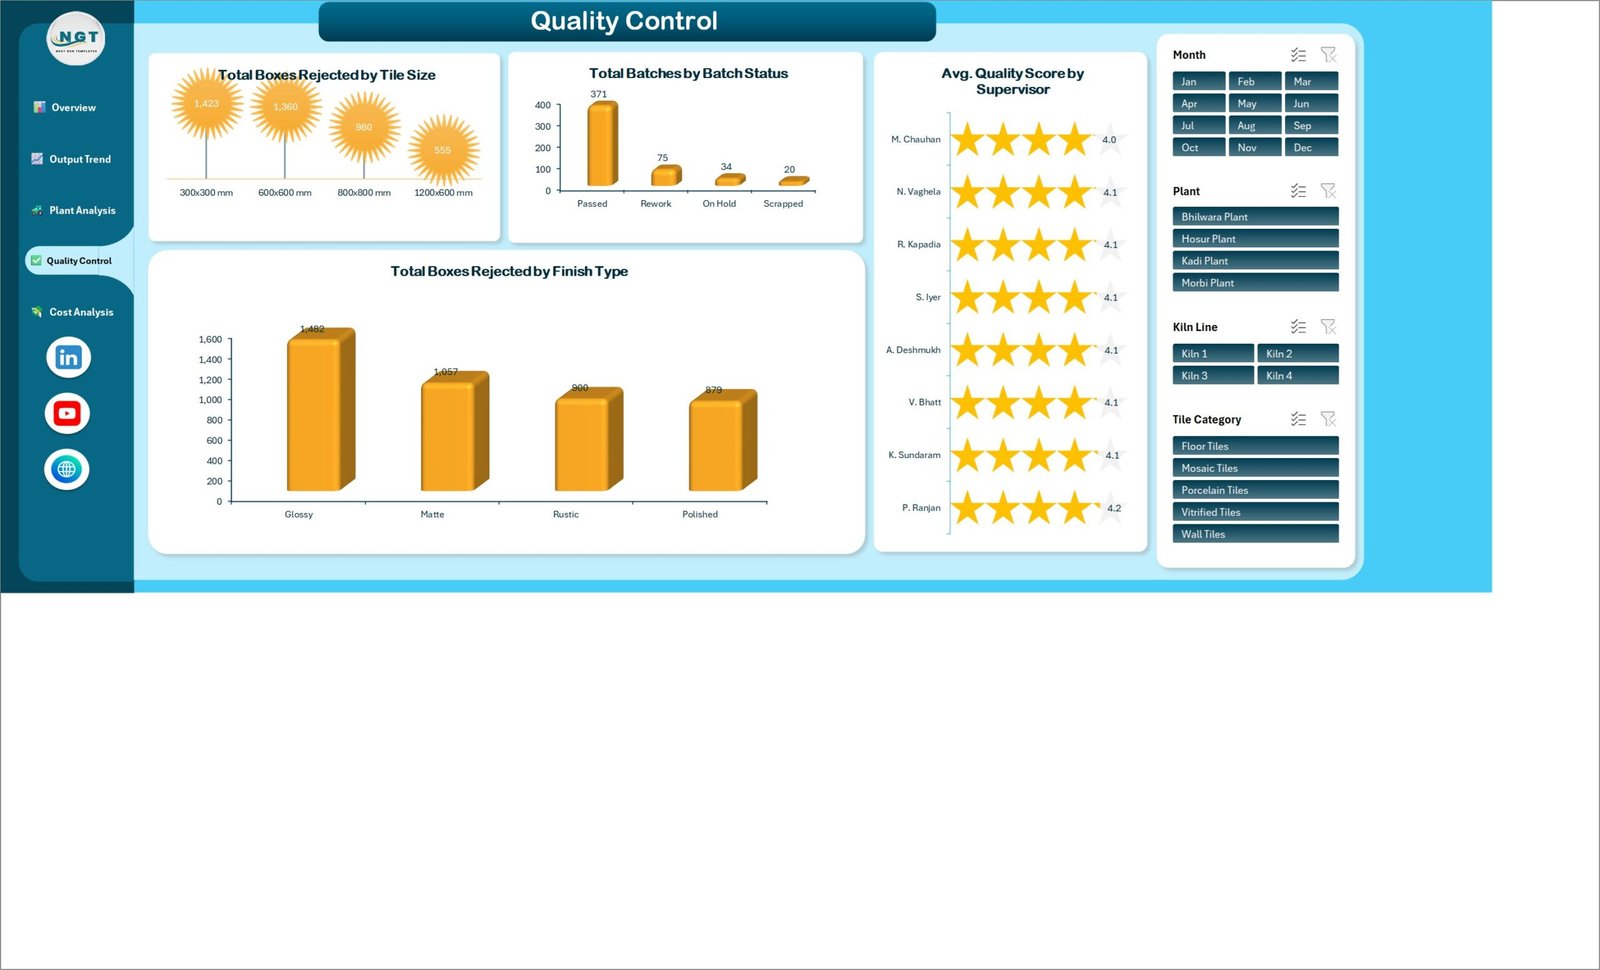
This page summarises the quality labels you record: Total Boxes Rejected by Tile Size, Total Batches by Batch Status (Passed, Rework, On Hold, Scrapped), Avg. Quality Score by Supervisor, and Total Boxes Rejected by Finish Type. Quality Score and Batch Status are values your team types into the Data sheet – the dashboard totals and charts them, it does not test or certify anything.
Page 5: Cost Analysis
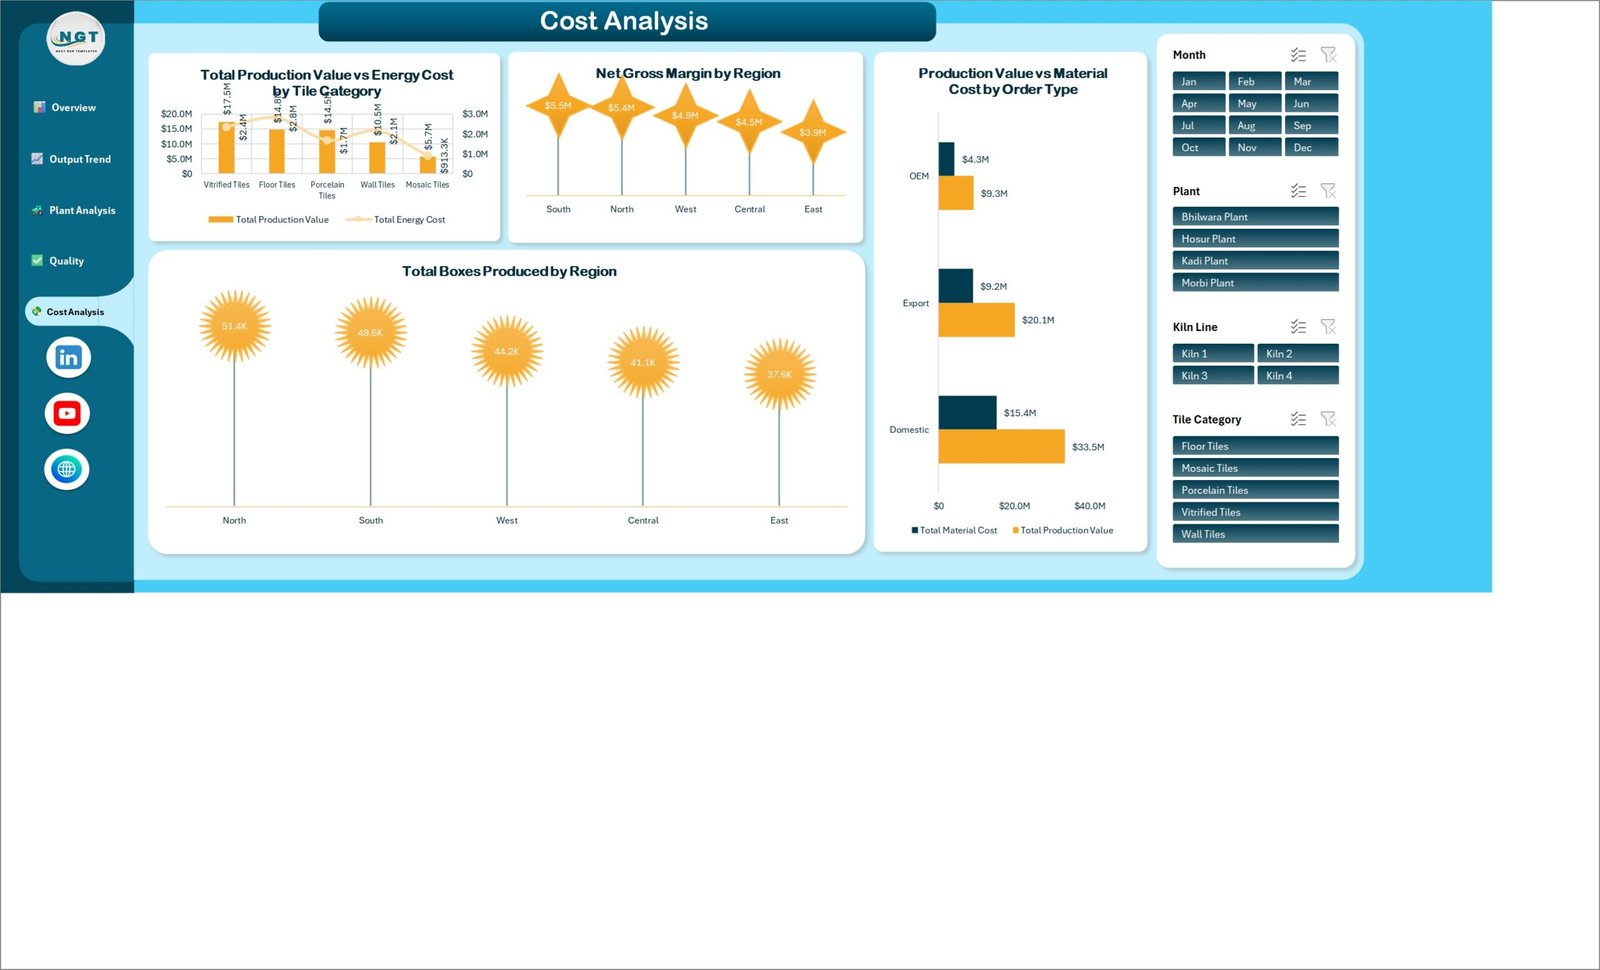
The commercial page carries Total Production Value vs Energy Cost by Tile Category, Net Gross Margin by Region, Production Value vs Material Cost by Order Type, and Total Boxes Produced by Region across North, South, East, West and Central.
Data sheet
500 demo batch rows across 32 columns – Batch ID, Production Date, Plant, Kiln Line, Shift, Supervisor, Tile Category, Tile Size, Finish Type, Order Type, Region, Batch Status, Dispatch Status, Boxes Planned, Boxes Produced, Boxes Rejected, Kiln Hours, Downtime Hours, Production Value, Raw Material Cost, Energy Cost, Quality Score and the Month, Year and Quarter helper fields. The rows are sample data for demonstration only; replace them with your own.
Support sheet
Every pivot table that feeds the twenty charts lives on this one hidden-away sheet, so the dashboard pages stay clean. You never edit it – it exists so that a single refresh updates all five pages at once.
📊 Ceramic Tiles Production Dashboard in Excel vs. a Google Sheets Build vs. Paid MES/SaaS — Where This Fits
| Feature | Ceramic Tiles Production Dashboard in Excel | Google Sheets equivalent | SAP Digital Manufacturing / Tulip MES |
|---|---|---|---|
| Cost | $17.99 one-time | $0-25 build-it-yourself | $40-200 / user / month |
| Platform | Microsoft Excel 2016+ / 365, offline | Browser only | Vendor cloud |
| Setup time | Under 10 minutes | Hours to build from scratch | Weeks of implementation |
| Real-time team collaboration | Via OneDrive / SharePoint | ✅ Native | ✅ Native |
| Mobile access | Excel mobile app | ✅ Browser | ✅ App |
| Customisable fields | ✅ Every column and chart is editable | ✅ Editable | Vendor-controlled |
| Works with no internet | ✅ Yes | ❌ No | ❌ No |
| Kiln, shift and rejection breakdowns out of the box | ✅ 20 pre-built charts | Build each one yourself | ✅ Included |
| Year-1 cost at 5 users | $17.99 total | Your build time | $2,400-12,000 |
For a tile plant that wants plant, kiln, quality-label and cost reporting without an MES rollout, the Ceramic Tiles Production Dashboard in Excel sits in the sweet spot.
👥 Who This Template Is For — and Who It’s Not For
✅ This template is built for:
- Production and plant managers at ceramic tile factories running 1-6 kiln lines who report monthly output to an owner or board
- Operations analysts who currently rebuild the same output-vs-plan chart by hand every month
- Finance and commercial teams who need production value, material cost, energy cost and margin in one place
- Consultants and MBA students building a manufacturing reporting case in Excel
- Anyone in building materials – tiles, sanitaryware, bricks, cement products – whose data is batch-based
❌ This template is NOT for:
- Anyone who needs product testing or conformance against tile standards such as ISO 13006 or EN 14411 – this workbook performs no testing and makes no conformance claim
- Recording or proving technical properties like breaking strength, slip resistance or water absorption class – it has no such fields and no such logic
- Quality-management certification work (ISO 9001, ISO 14001), CE marking, or Declaration of Performance paperwork – it is not an audit or certification tool
- Plant safety, workplace safety or incident management – it holds no safety data and must not be used for safety decisions
- Emissions, effluent or environmental-compliance reporting to a regulator
- Live machine or SCADA data – rows are entered or pasted, not streamed from the kiln
- Teams that need multi-user simultaneous editing with an audit trail – use a database or MES instead
⚙️ How to Use the Ceramic Tiles Production Dashboard in Excel
- Unzip the download and open the .xlsx in Microsoft Excel. No macros to enable.
- Open the Data sheet and read the 32 column headers so you know what each field expects.
- Delete the 500 demo rows and paste your own batch records, keeping the column order intact.
- Fill Boxes Planned as well as Boxes Produced – the Plan Attainment gauge needs both.
- Enter your own labels in Plant, Kiln Line, Tile Category, Tile Size, Finish Type, Region and Batch Status; the slicers pick them up automatically.
- Press Ctrl+Alt+F5 (Refresh All). Every pivot, chart and KPI card on all five pages updates.
- Use the four slicers to filter, and the left-hand navigation buttons to jump between pages.
- Print or export to PDF for your monthly production review.
💼 Real-World Use Cases
Rakesh runs a two-plant tile works with four kiln lines. He pastes the month’s batch sheet into the Data tab on the first working day, filters to each plant with the slicer, and walks his owners through Plan Attainment, downtime hours and rejected boxes in a fifteen-minute review – work that used to take him two days of manual charting.
Meera is the commercial controller at a building-materials group. She uses the Cost Analysis page to compare Production Value against Energy Cost by Tile Category, then looks at Net Gross Margin by Region before setting the next quarter’s price list. Nothing leaves her laptop, which suits her group’s data policy.
Anil consults for mid-size manufacturers. He hands the workbook to each new client as a starting reporting pack, swaps in their plant and kiln names, and has a working monthly dashboard on day one instead of week three.
❓ Frequently Asked Questions
Does the Ceramic Tiles Production Dashboard certify that my tiles meet ISO 13006 or EN 14411?
No. The Ceramic Tiles Production Dashboard in Excel performs no testing and issues no certificate. It charts the numbers and labels your team types in. Conformance to tile standards, CE marking and Declarations of Performance require an accredited testing laboratory and are entirely outside this workbook.
What KPIs does the Ceramic Tiles Production Dashboard in Excel track?
It tracks Total Production Value, Total Boxes Produced, Total Batches, Net Gross Margin, Average Quality Score and Plan Attainment %, plus kiln hours, downtime hours, boxes rejected, raw material cost and energy cost. All of them recalculate when you replace the sample data with your own.
How long does setup take?
Under 10 minutes. Unzip the file, open the Data sheet in the Ceramic Tiles Production Dashboard in Excel, delete the 500 demo rows, paste your own batch records in the same column order, and press Refresh All. There is nothing to install and no add-in to configure.
Is the Quality Score a real test result?
No. Quality Score, Batch Status and Boxes Rejected are plain columns on the Data sheet that your supervisors fill in from your own internal grading. The Ceramic Tiles Production Dashboard in Excel averages and charts those entries; it does not measure, verify or validate them.
How does this compare to an MES like SAP Digital Manufacturing or Tulip?
An MES connects to machines, enforces workflow and costs $40-200 per user per month. The Ceramic Tiles Production Dashboard in Excel is a $17.99 one-time reporting layer over data you already keep in a spreadsheet. It does not replace an MES, and it needs no rollout.
Can I add my own plants, kiln lines and tile sizes?
Yes. Type your own values into the Plant, Kiln Line, Tile Category, Tile Size, Finish Type and Region columns of the Data sheet. The slicers and every chart in the Ceramic Tiles Production Dashboard in Excel are pivot-driven, so new labels appear after a refresh with no formula edits.
Does it need macros, and which Excel versions work?
The Ceramic Tiles Production Dashboard in Excel is a macro-free .xlsx built on pivot tables, pivot charts and slicers. It opens in Excel 2016, 2019, 2021 and Microsoft 365 on Windows and Mac. Slicer behaviour is best on the desktop app rather than Excel for the web.
👤 About the Author
Built by PK — Microsoft Certified Professional with 15+ years of Excel, Google Sheets, and Power BI experience. Founder of NextGenTemplates, reaching 300K+ subscribers across YouTube channels (@PK-AnExcelExpert, @NextGenTemplates, @NeoTechNavigators). Every template is hand-built and tested before release.
🔗 Explore Related Templates
Staying in heavy production, the Cement Mixer Production Dashboard in Excel is the closest neighbour to this one – same batch-and-plant shape, different industry – and it also ships as a Cement Mixer Production Dashboard in Power BI. For a shorter ceramic-specific scorecard, the Ceramic Manufacturing KPI Dashboard in Excel covers headline metrics only, while the Flooring and Tiles KPI Dashboard in Power BI takes the tiles theme downstream into sales. Heavy-equipment teams usually pair this with the Railway Equipment Manufacturing Dashboard in Excel, and shop-floor supervisors add the Daily Production Output Tracker in Google Sheets for day-by-day entry. Browse more in our Manufacturing Excel Templates and Excel Dashboard Templates collections.
💎 Save more: the Plant Production Manager Toolkit – 9 Premium Templates (Excel + Power BI) bundles this style of reporting pack with eight more production templates.
📖 Click here to read the Detailed Blog Post
🎥 Visit our YouTube channel for step-by-step video tutorials
👉 YouTube.com/@NextGenTemplates
📅 Last updated: August 2026






















Reviews
There are no reviews yet.