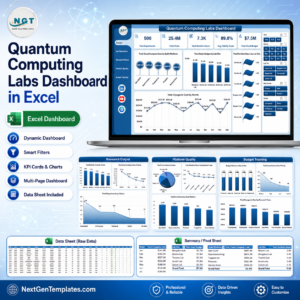


Quantum Computing Labs Dashboard in Excel is built for teams that need to monitor quantum research activity without waiting for a custom BI project. A lab can track hundreds or thousands of experiments, shots, runtime hours, fidelity scores, grant budgets, cloud compute costs, cryogenic costs, and research outputs in one Excel file. Because it is a downloadable Excel dashboard, you can replace the sample data, refresh the pivots, and review the dashboard before committing to paid lab management software.
Key Features of Quantum Computing Labs Dashboard in Excel
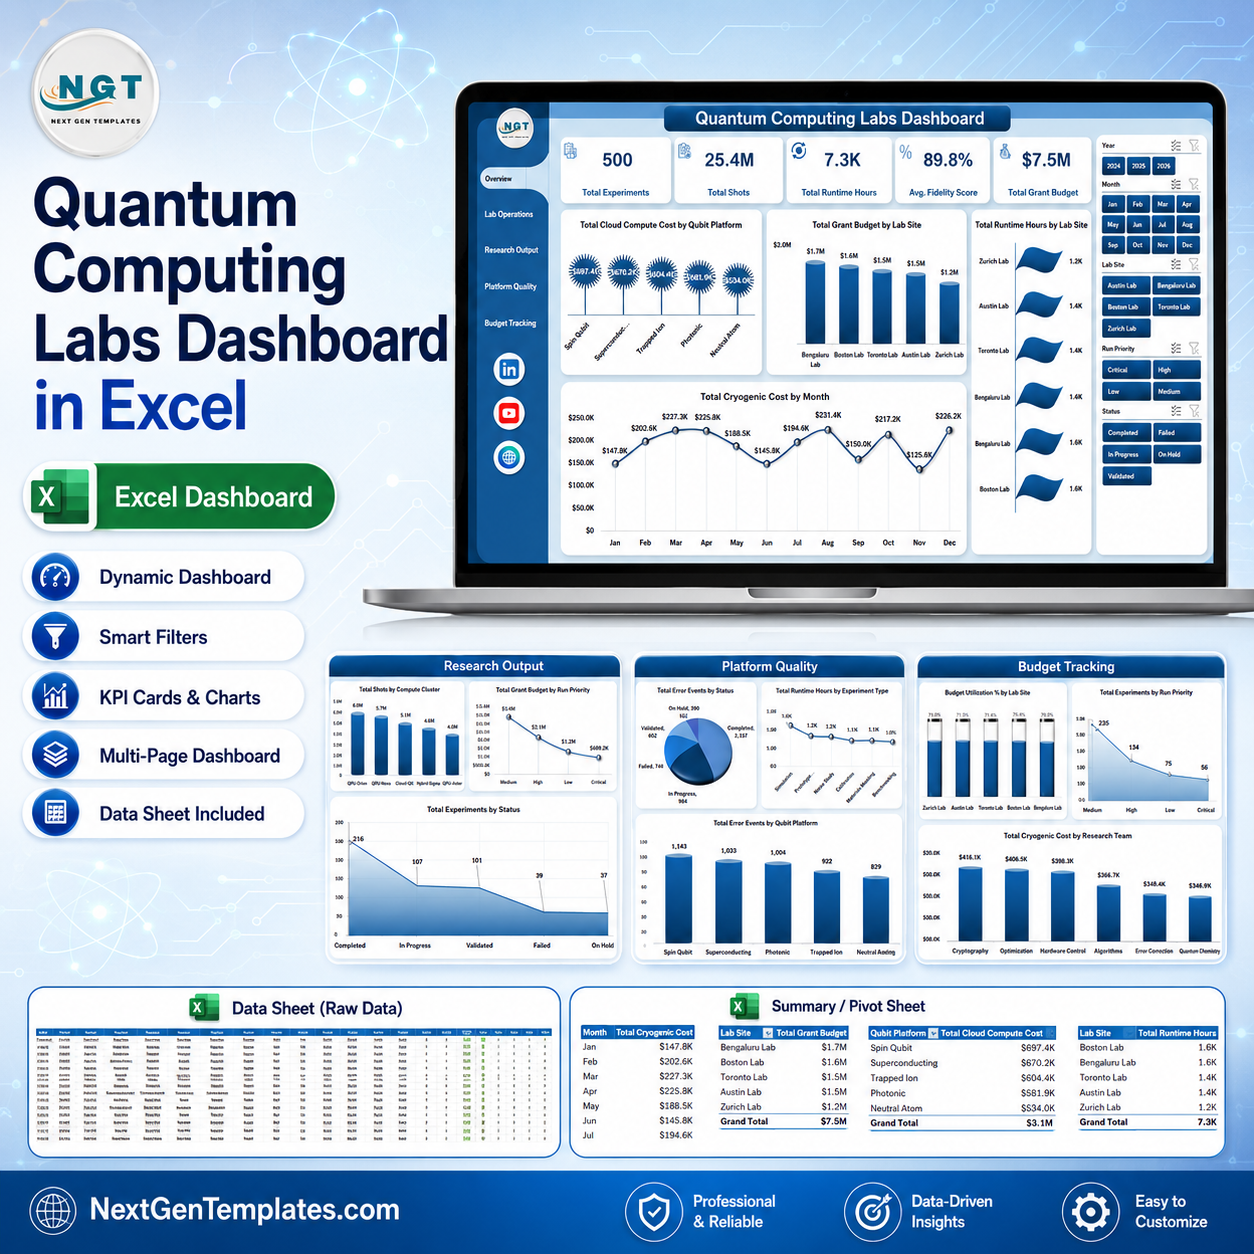
This template includes multiple dashboard pages, KPI cards, slicers, pivot-driven charts, editable source data, and a support sheet for dynamic refresh. The overview page gives leadership a quick view of Total Experiments, Total Shots, Total Runtime Hours, Avg. Fidelity Score, and Total Grant Budget. The analysis pages then help lab managers compare compute platforms, lab sites, research teams, experiment statuses, run priorities, principal investigators, experiment types, and monthly cost movement.
What’s Inside the Quantum Computing Labs Dashboard in Excel
The workbook includes an Overview Page, Lab Operations page, Research Output page, Platform Quality page, Budget Tracking page, Data Sheet tab, and Support Sheet tab.
Quantum Computing Labs Dashboard in Excel
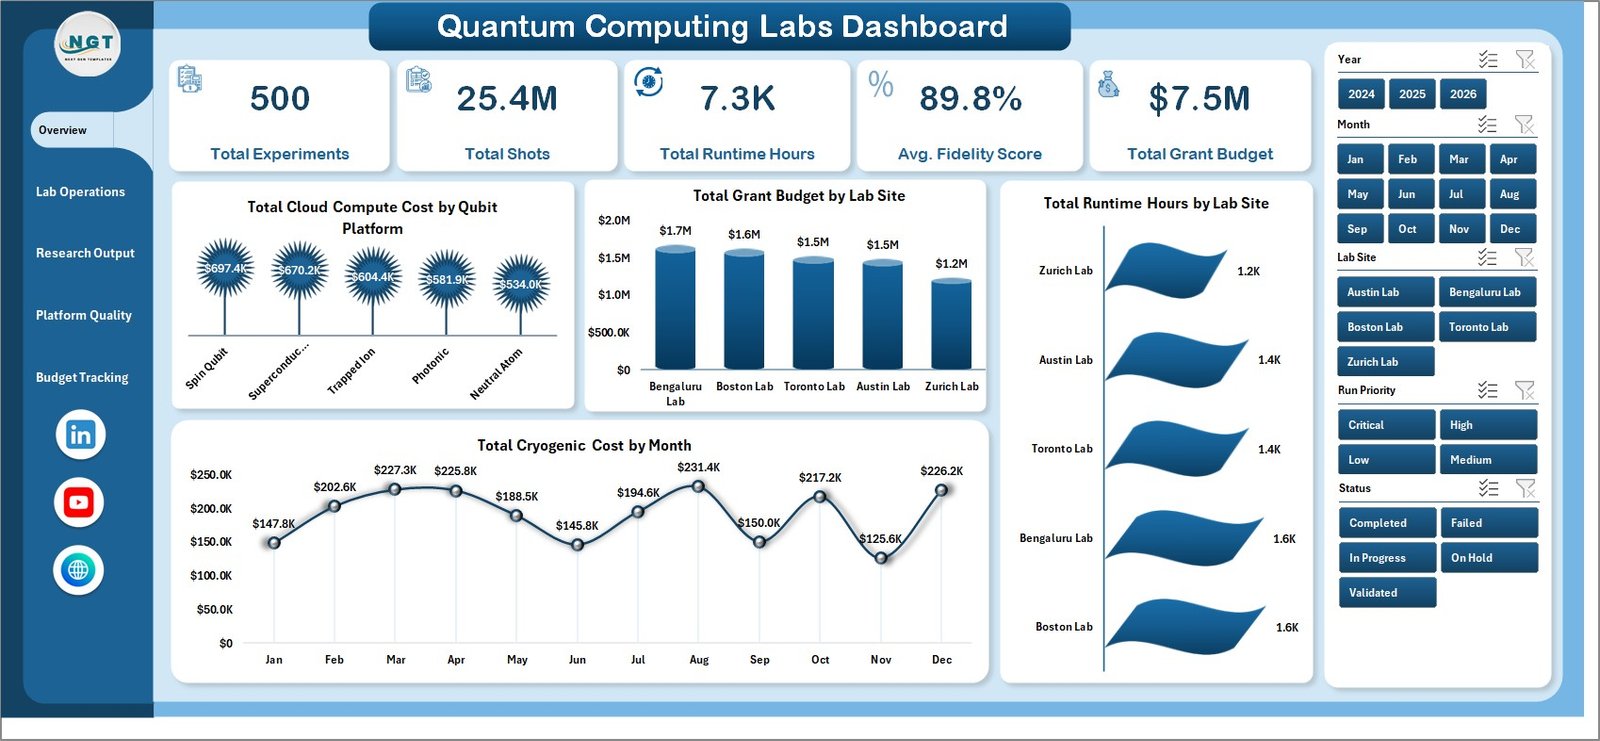
The Overview Page summarizes high-level lab performance with cards for Total Experiments, Total Shots, Total Runtime Hours, Avg. Fidelity Score, and Total Grant Budget. Charts show Total Cloud Compute Cost by Qubit Platform, Total Grant Budget by Lab Site, Total Runtime Hours by Lab Site, and Total Cryogenic Cost by Month.
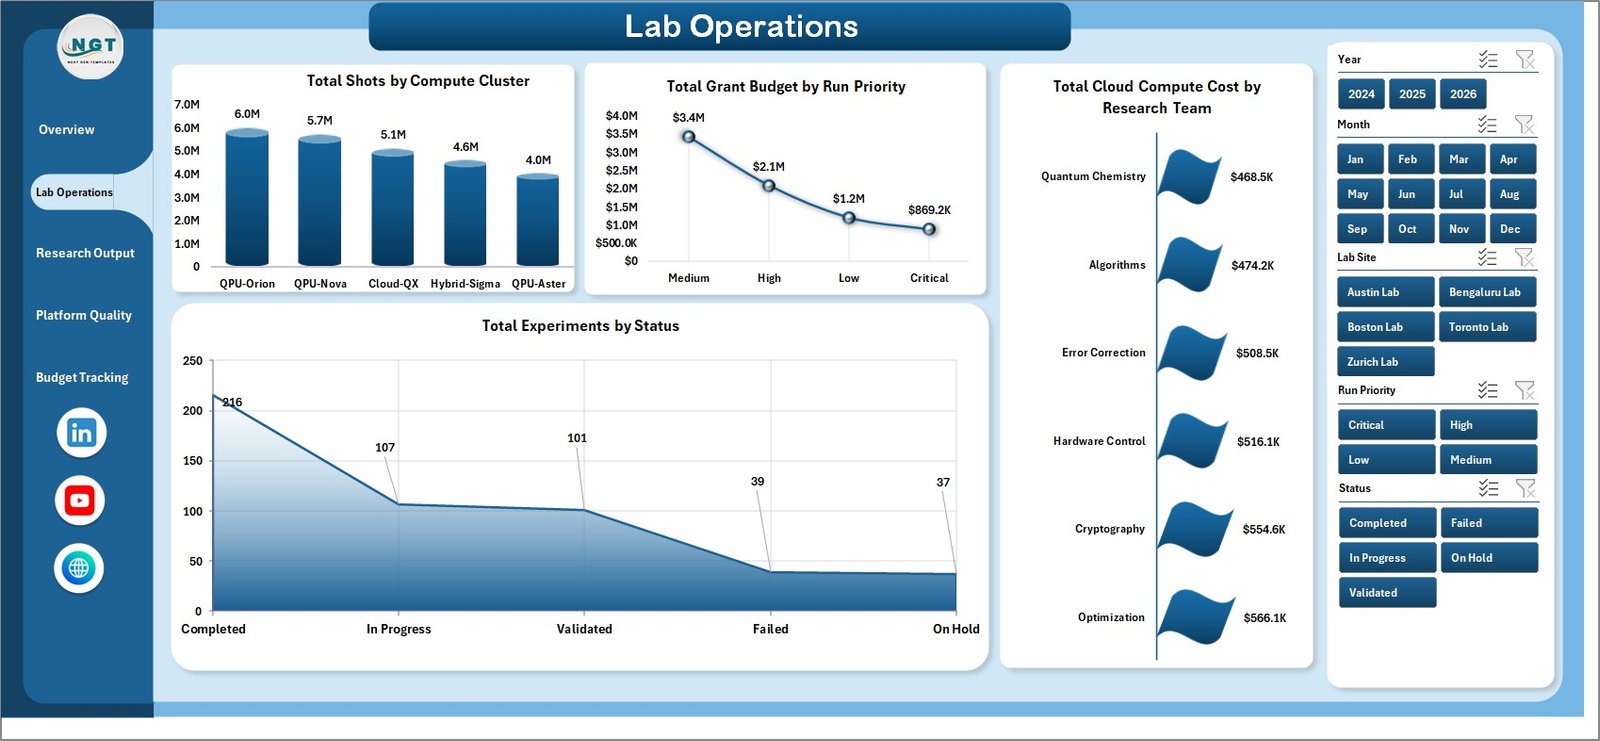
Lab Operations
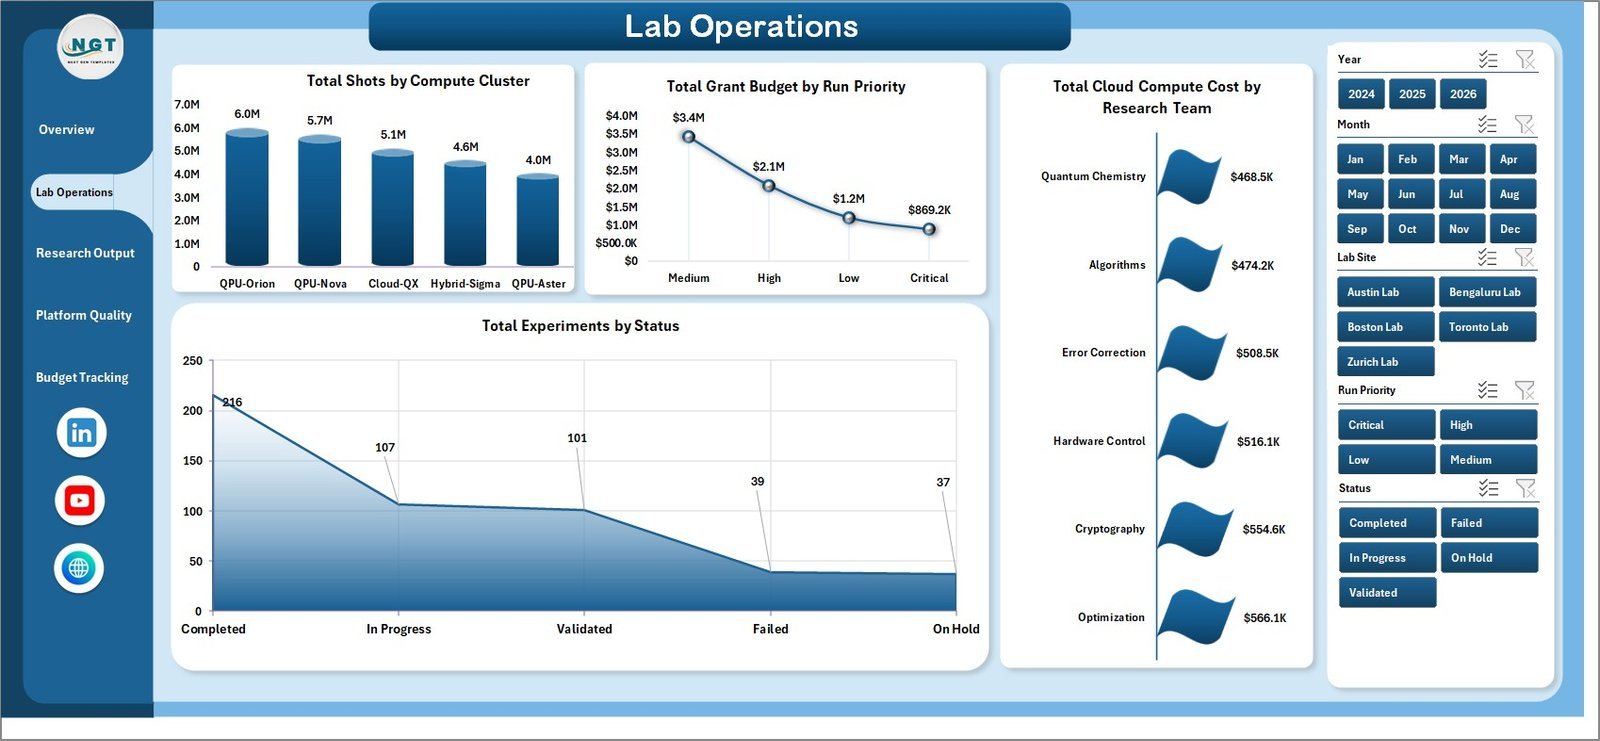
The Lab Operations page analyzes Total Shots by Compute Cluster, Total Grant Budget by Run Priority, Total Cloud Compute Cost by Research Team, and Total Experiments by Status. This helps operations teams spot workload concentration, funding pressure, and experiments that need attention.
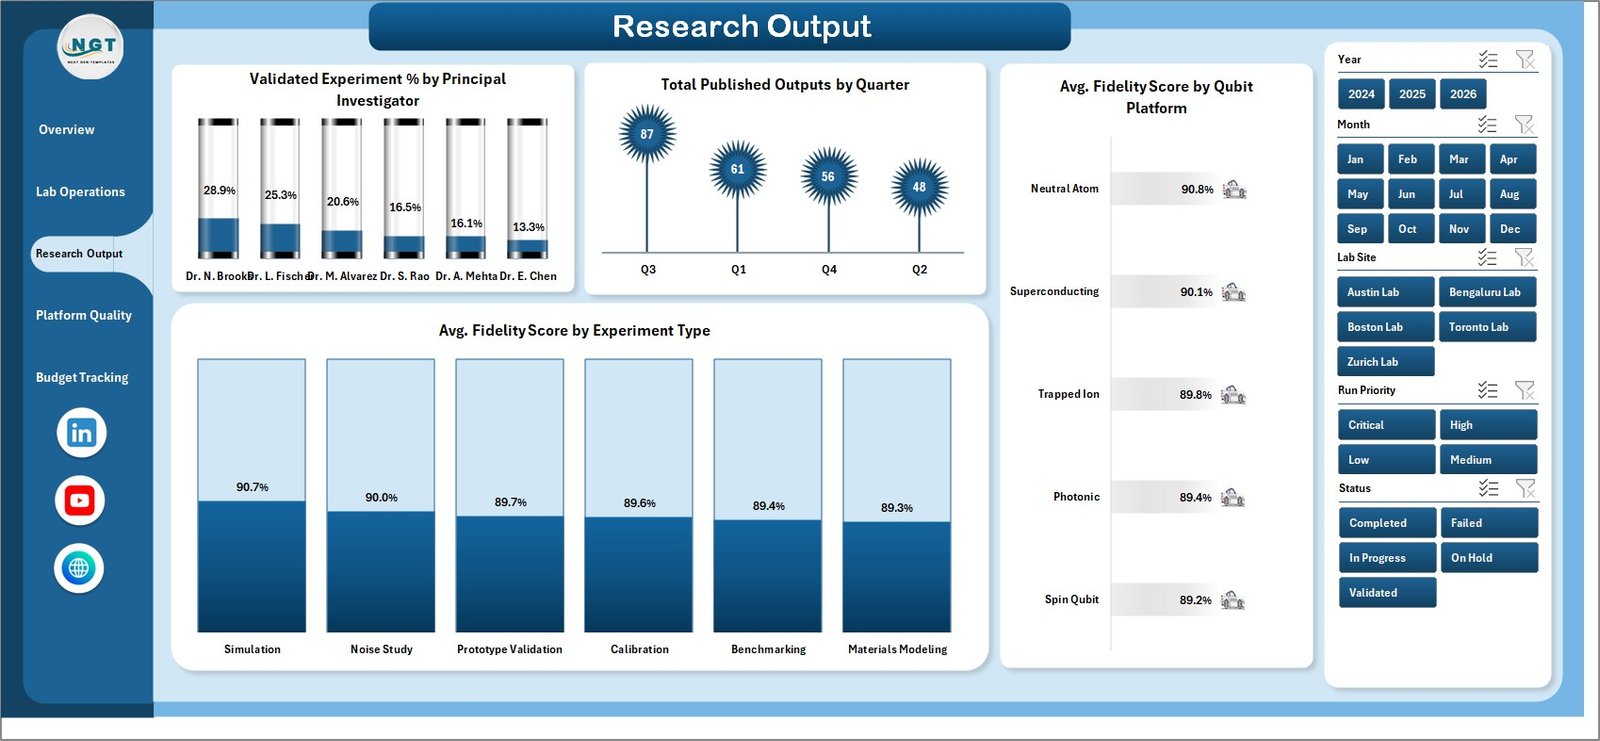
Research Output
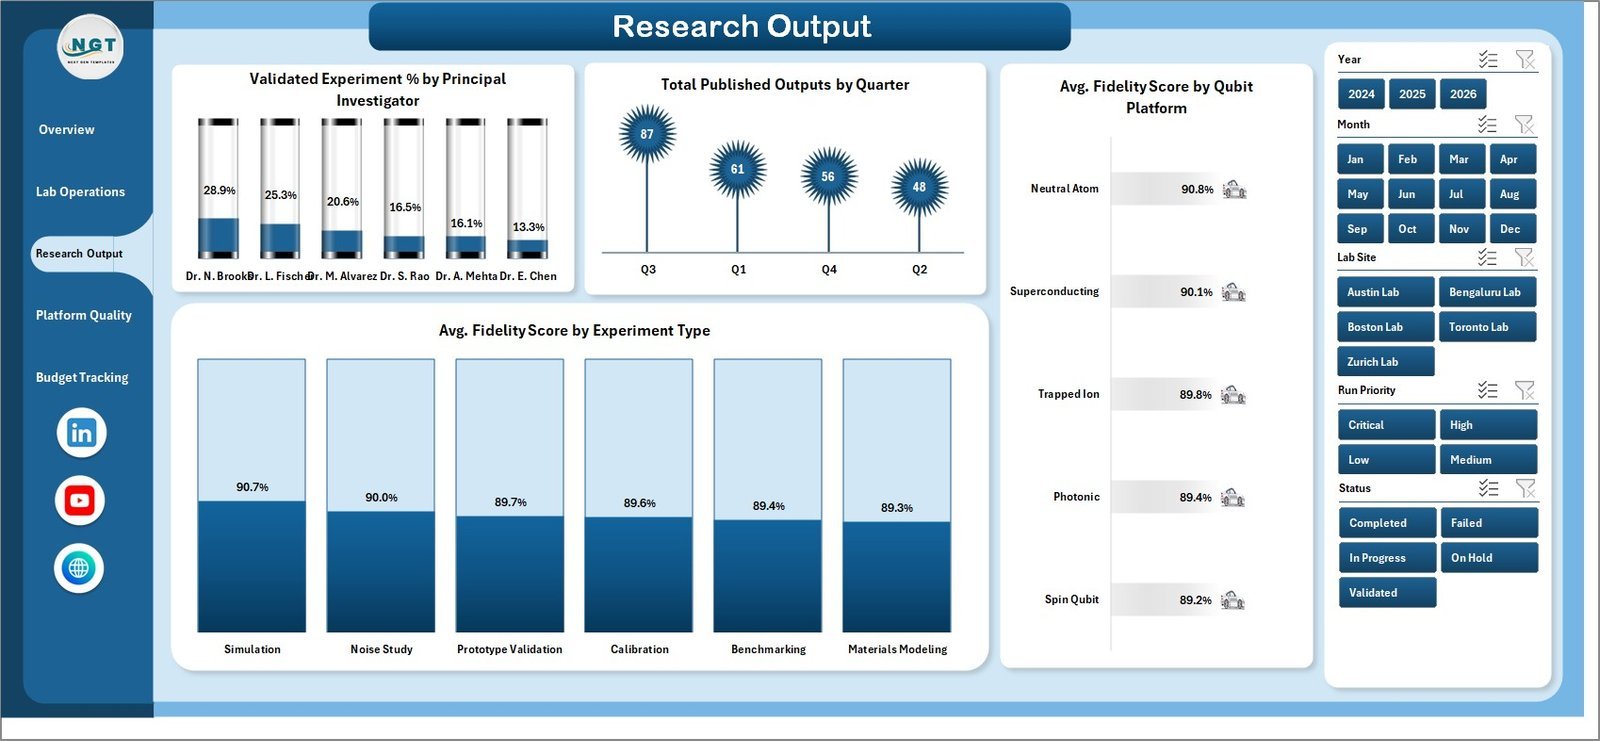
The Research Output page focuses on Validated Experiment % by Principal Investigator, Total Published Outputs by Quarter, Avg. Fidelity Score by Qubit Platform, and Avg. Fidelity Score by Experiment Type. It connects technical experiment quality with visible research output.
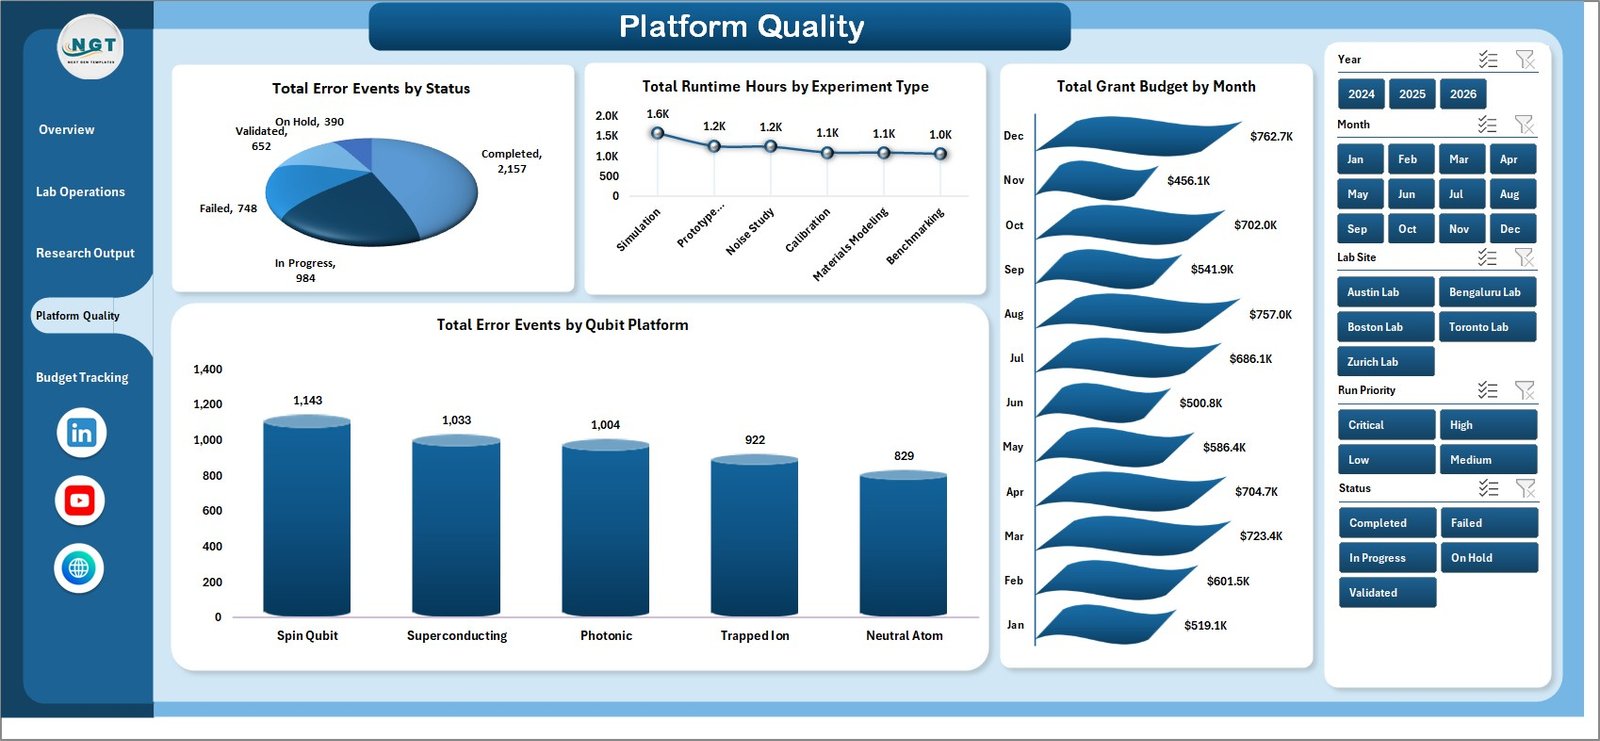
Platform Quality
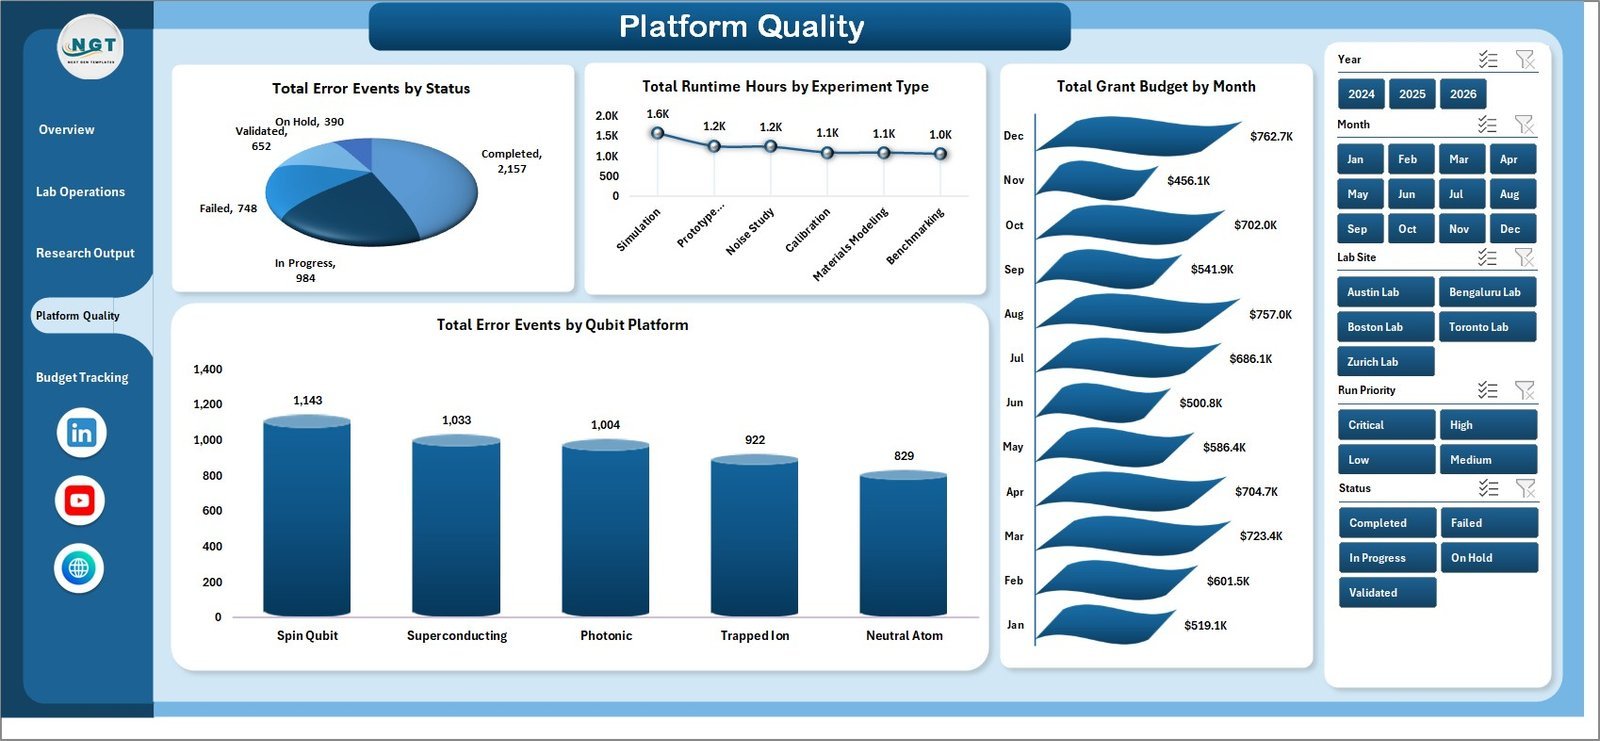
The Platform Quality page reviews Total Error Events by Status, Total Runtime Hours by Experiment Type, Total Grant Budget by Month, and Total Error Events by Qubit Platform. It is useful when comparing platform reliability and deciding where follow-up investigation is needed.
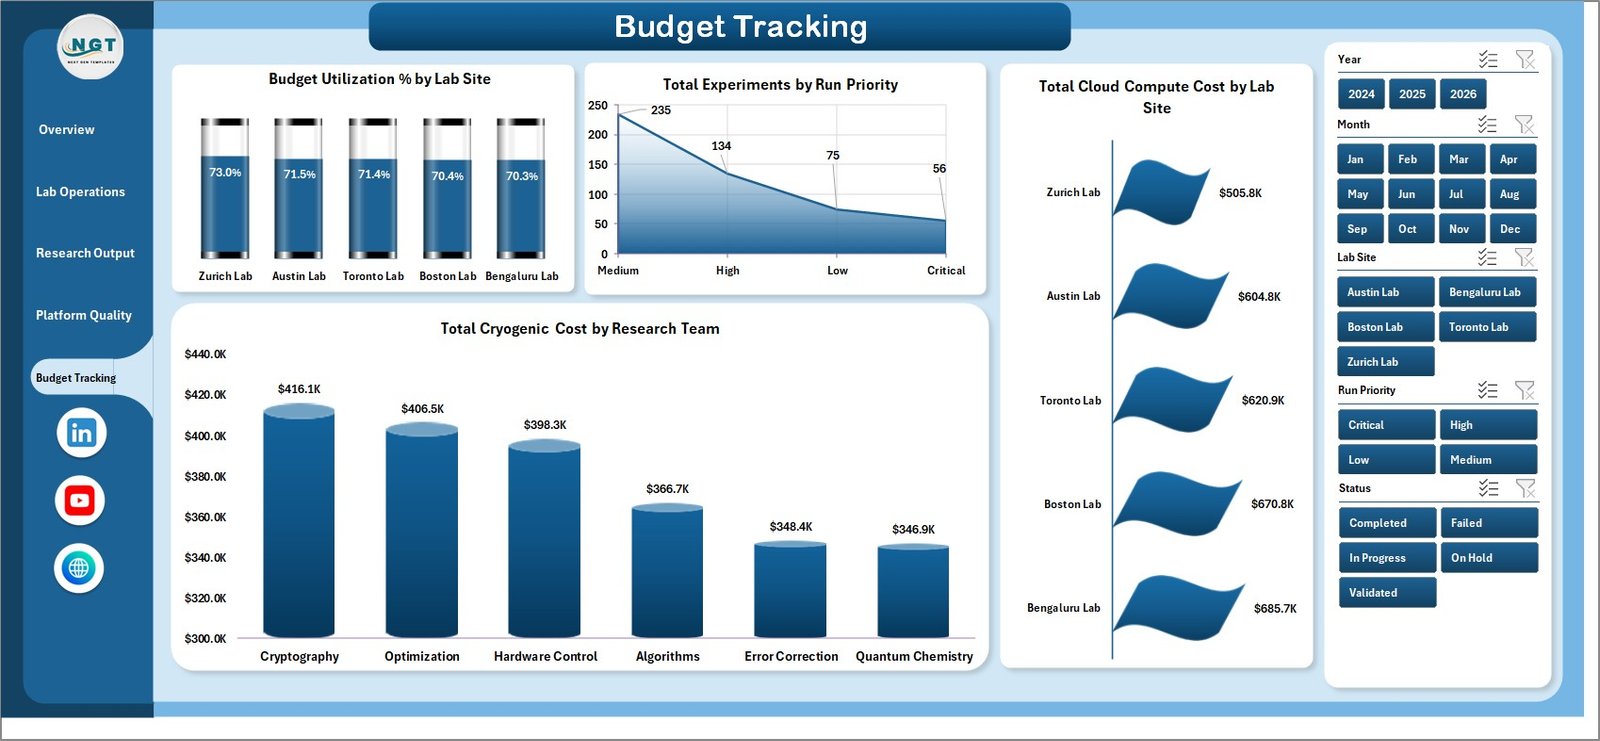
Budget Tracking
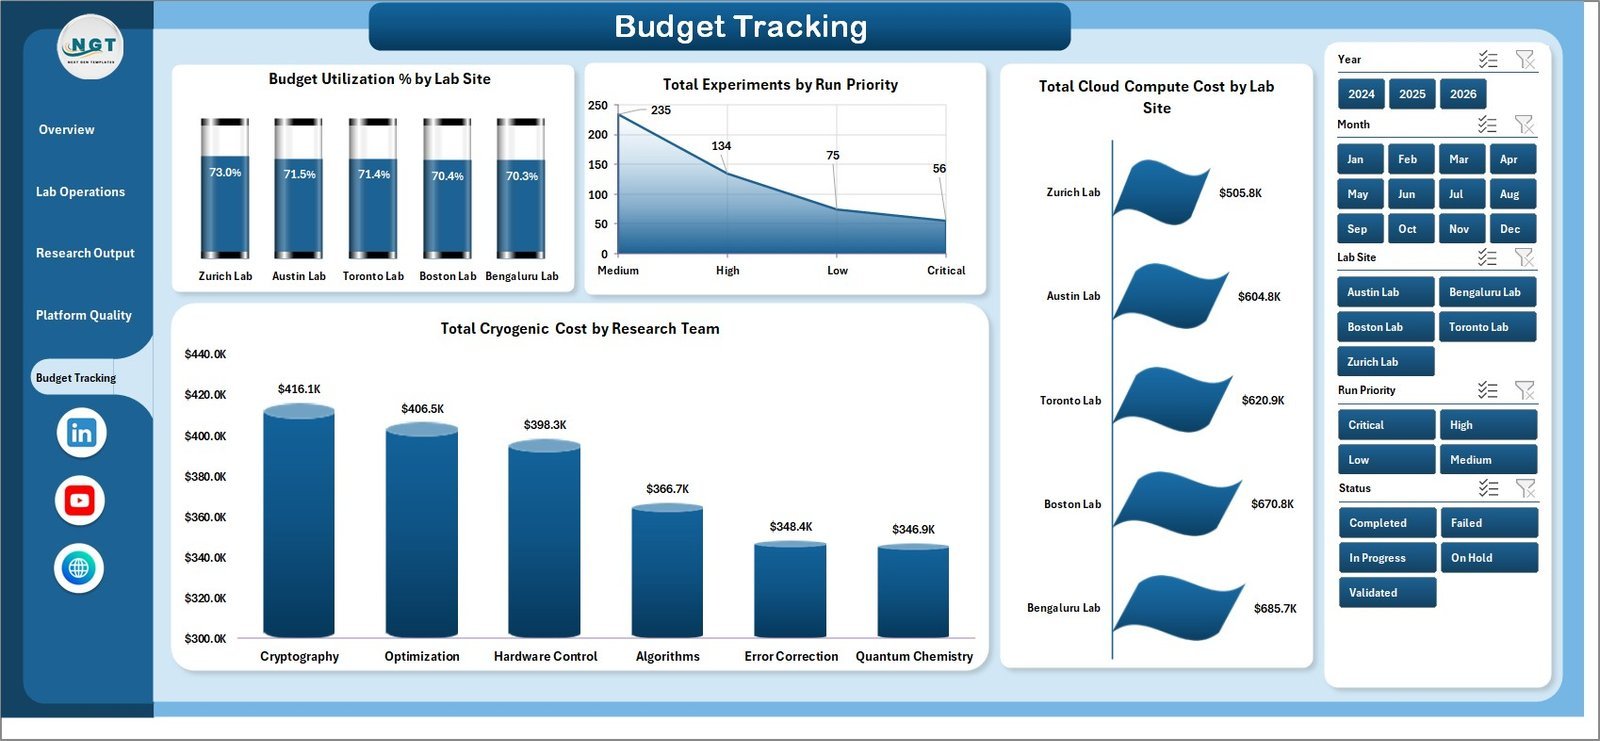
The Budget Tracking page shows Budget Utilization % by Lab Site, Total Experiments by Run Priority, Total Cloud Compute Cost by Lab Site, and Total Cryogenic Cost by Research Team. Finance and program managers can use it to compare spending patterns across labs and teams.

Data Sheet tab
The Data Sheet tab is where you add or replace records in the same format. After updating the data, use Refresh All from the Excel Data ribbon to update the dashboard.

Support sheet tab
Quantum Computing Labs Dashboard in Excel vs. Google Sheets vs. Paid CRM/SaaS – Where This Fits
| Area | This Excel dashboard | Google Sheets alternative | Paid SaaS alternative |
|---|---|---|---|
| Cost | One-time template purchase | Low cost, depends on Google account setup | Monthly or annual subscription |
| Setup time | Replace data and refresh | Often needs rebuilding formulas and charts | Requires configuration and onboarding |
| Custom fields | Editable in Excel | Editable but easier to break with shared access | Limited by admin settings |
| Lab analytics | Built around experiments, shots, fidelity, budgets, and platforms | Possible with custom setup | Depends on the system purchased |
Who This Template Is For – and Who It’s Not For
This template is for research lab coordinators, quantum computing program managers, grant administrators, academic teams, and innovation groups that already use Excel for reporting. It is not for teams that require real-time database syncing, user permissions, automated instrument integrations, or validated regulatory audit trails.
How to Use the Quantum Computing Labs Dashboard in Excel
Download and unzip the file. Open the workbook in Microsoft Excel, go to the Data Sheet tab, replace the sample rows with your own lab records, then click Refresh All from the Data tab. Review the dashboard pages and use slicers to filter the view by platform, lab site, team, priority, status, and month.
Real-World Use Cases
Research Director: Compare fidelity scores and published outputs across platforms and investigators before a quarterly review.
Lab Operations Manager: Monitor shots, runtime hours, compute clusters, experiment status, and cost pressure by research team.
Grant Program Analyst: Track budget utilization, grant budget by lab site, and monthly cost movement for funding reports.
Frequently Asked Questions
Can I replace the sample data?
Yes. The Data Sheet tab is designed so you can add your own rows in the same format and refresh the workbook.
Does this require macros?
No macro requirement is stated for this dashboard. It uses Excel sheets, slicers, charts, and pivot-based support data.
Can I hide the Support Sheet?
Yes. The Support Sheet can be hidden after setup because it mainly supports the dynamic dashboard calculations and pivots.
Which Excel version should I use?
Use a modern desktop version of Microsoft Excel for the best dashboard, pivot, chart, and slicer experience.
Is this a SaaS tool?
No. It is a downloadable Excel dashboard template with a one-time purchase price.
About the Author
Built by PK – Microsoft Certified Professional with 15+ years of Excel, Google Sheets, and Power BI experience. Founder of NextGenTemplates, reaching 300K+ subscribers across YouTube channels. Every template is hand-built and tested before release.
Explore Related Templates
Browse more Excel dashboard templates and Excel analysis templates on NextGenTemplates.
Get the Quantum Computing Labs Dashboard in Excel today and turn your lab operations, research output, platform quality, and budget data into a clear Excel dashboard.
Last updated: July 30, 2026