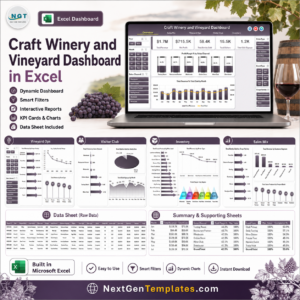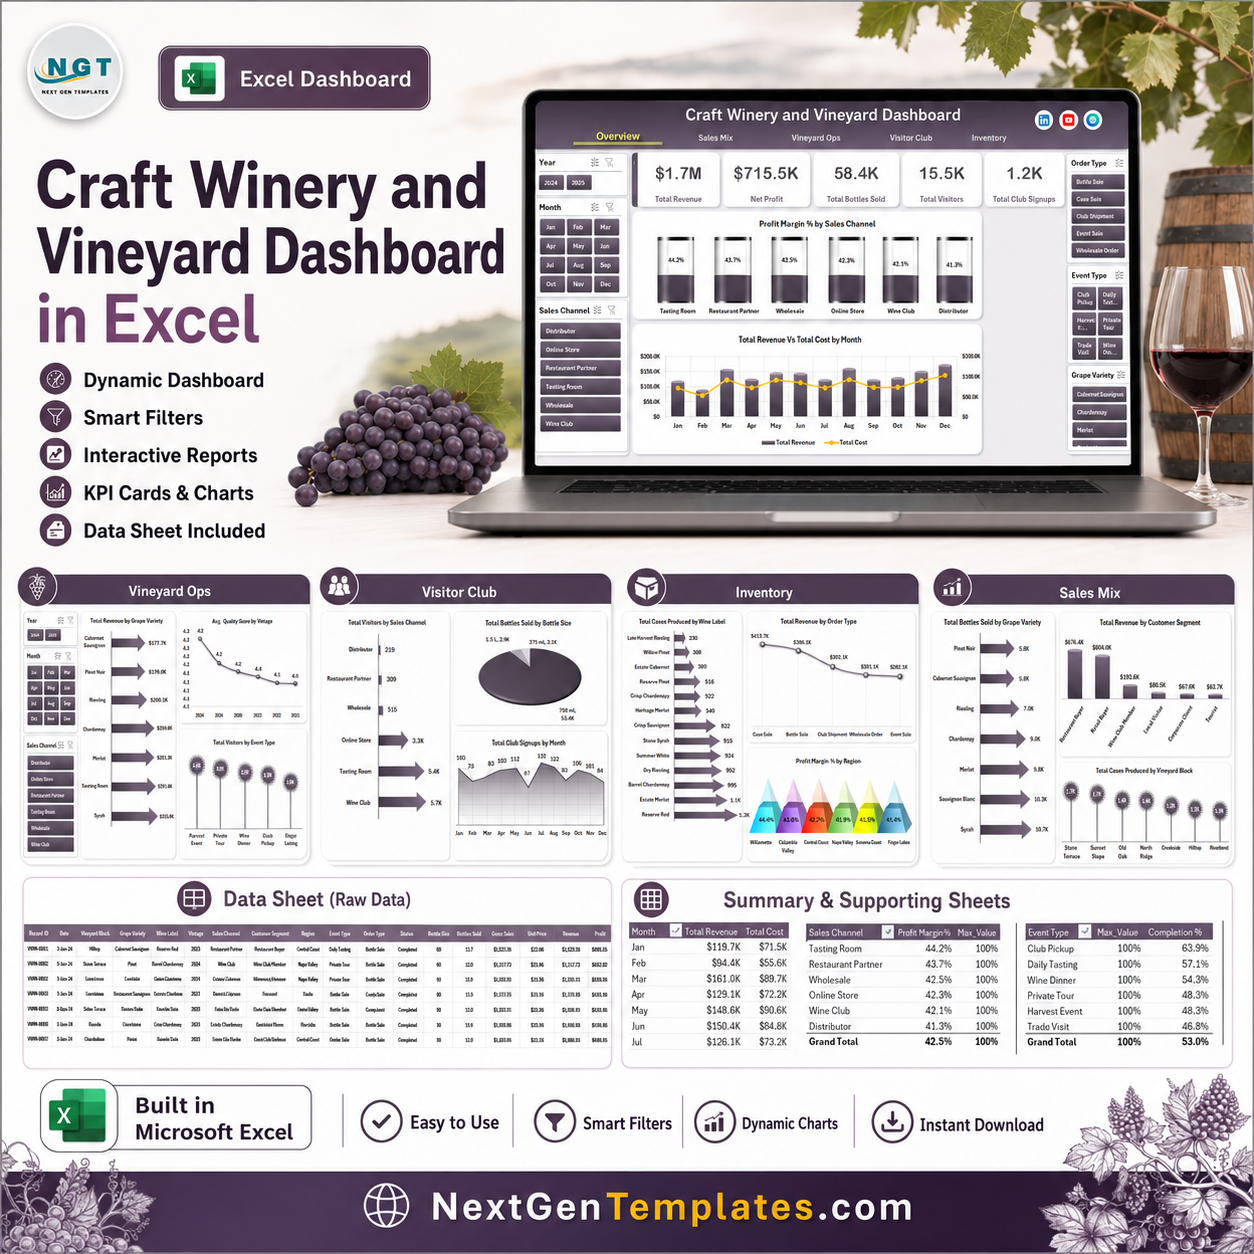


Last updated: July 2026. The U.S. has more than 11,000 wineries, and small wine businesses often manage tasting room sales, club signups, vineyard output, and inventory in separate files. The Craft Winery and Vineyard Dashboard in Excel brings those moving pieces into 7 organized worksheet tabs with 5 headline KPI cards, 18 business charts, slicer-based filtering, a structured data sheet, and a support sheet for refreshable pivot tables. It is built for winery owners who want practical reporting without a monthly SaaS bill.
Trusted by 8,400+ teams using NextGenTemplates across 40+ countries. Instant download, one-time payment, no subscription, no per-user fees, and editable Excel access after purchase.
Key Features of Craft Winery and Vineyard Dashboard in Excel
- 7 worksheet tabs covering Overview, Sales Mix, Vineyard Ops, Visitor Club, Inventory, Data, and Support.
- 5 executive KPI cards for Total Revenue, Net Profit, Total Bottles Sold, Total Visitors, and Total Club Signups.
- 18 dashboard charts for revenue, cost, profit margin, grape variety, sales channel, vineyard block, region, event type, bottle size, and club signup analysis.
- Interactive slicers let users filter the dashboard quickly without rebuilding pivot tables.
- Refreshable pivot architecture updates all charts after replacing the sample data and clicking Data > Refresh All.
- No VBA required, so the file is easier to open, audit, and adapt in standard Microsoft Excel.
What’s Inside the Craft Winery and Vineyard Dashboard in Excel
The Overview page gives leadership a quick read on revenue, profit, bottle sales, visitor volume, and club growth. It includes Profit Margin % by Sales Channel, Completion % by Event Type, and Total Revenue vs Total Cost by Month, so owners can see whether events, direct sales, and wholesale activity are driving profitable growth.
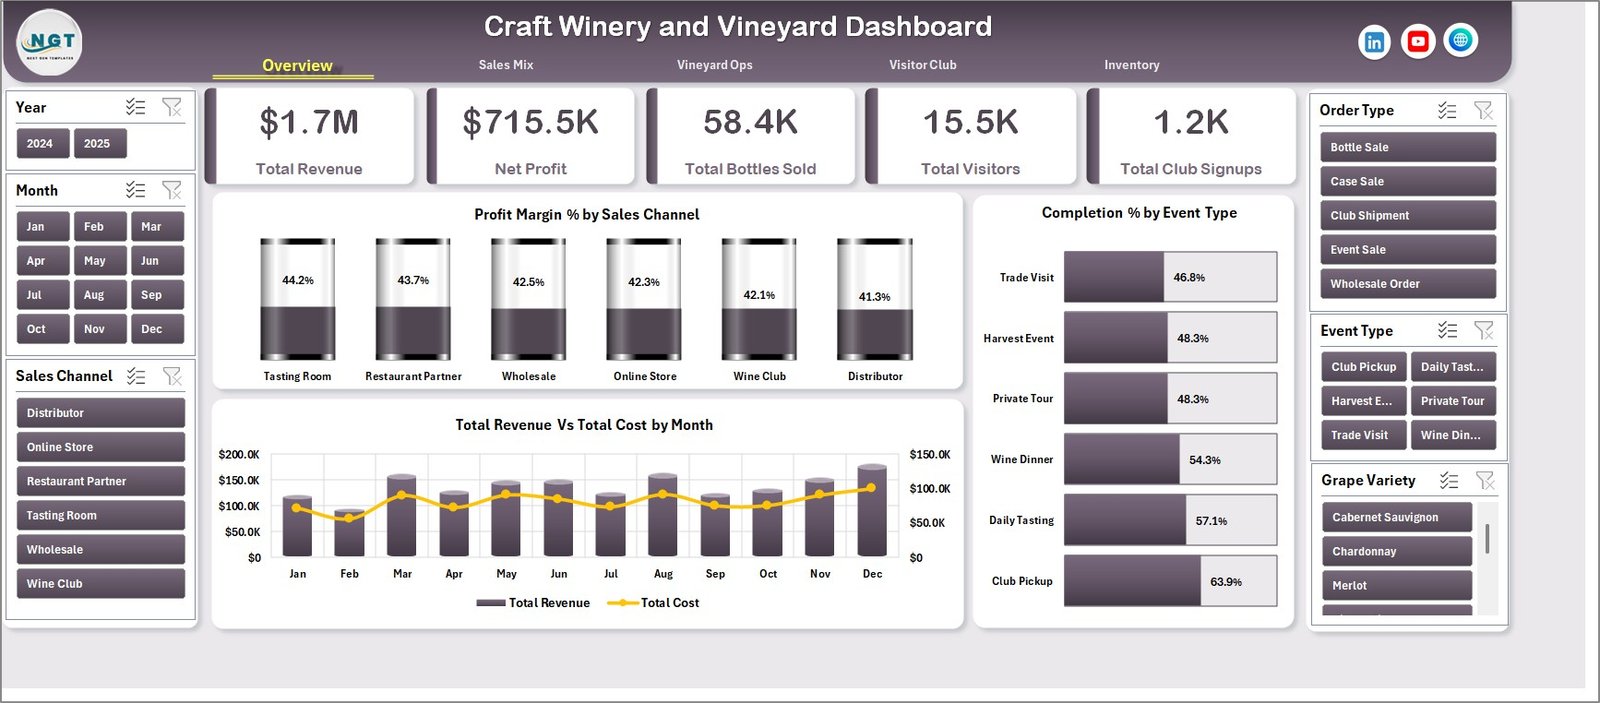
Craft Winery and Vineyard Dashboard in Excel
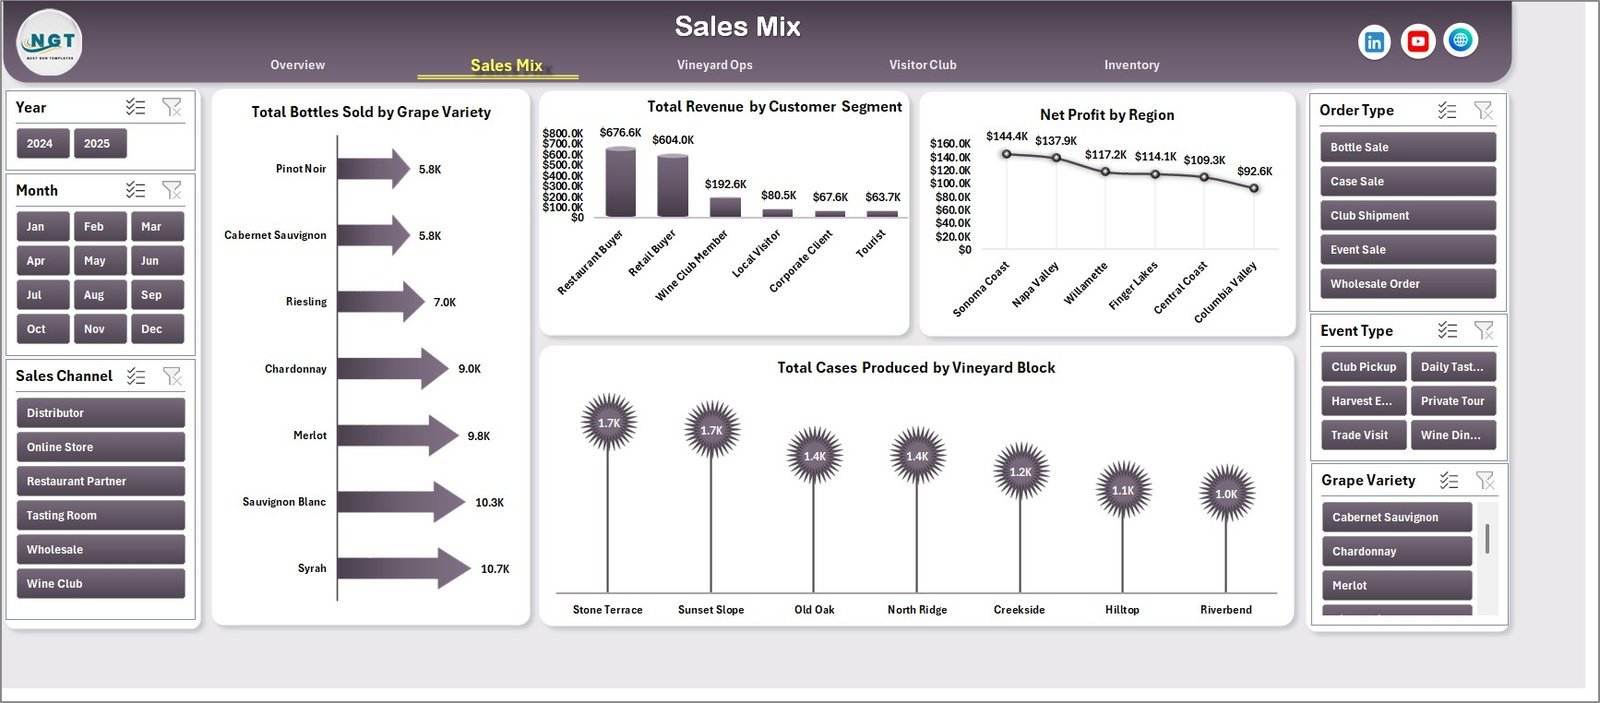
The Sales Mix page explains how sales volume and profit are distributed. It shows Total Bottles Sold by Grape Variety, Total Revenue by Customer Segment, Net Profit by Region, and Total Cases Produced by Vineyard Block. Use this page to identify which varieties, customer groups, and vineyard blocks deserve more attention.
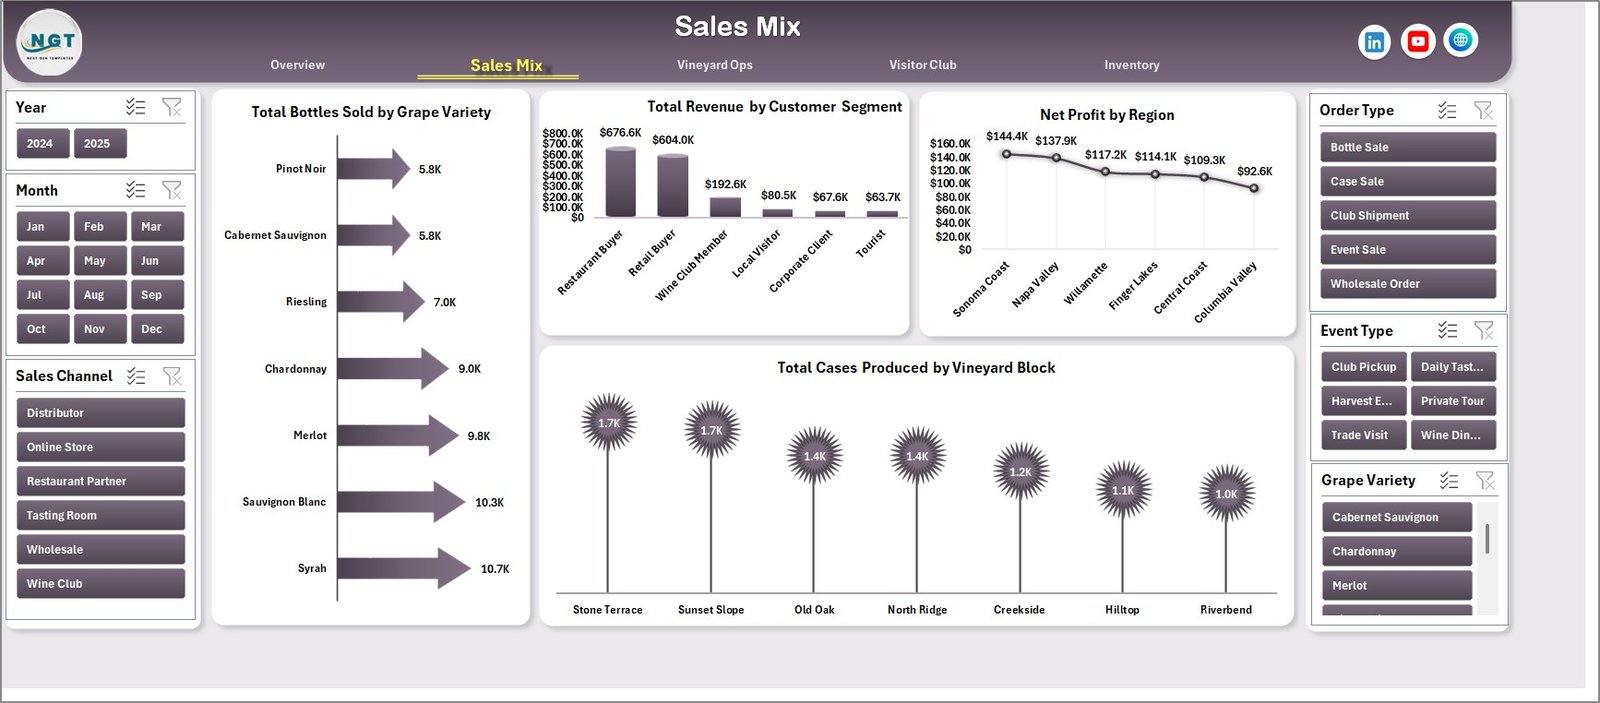
Sales Mix
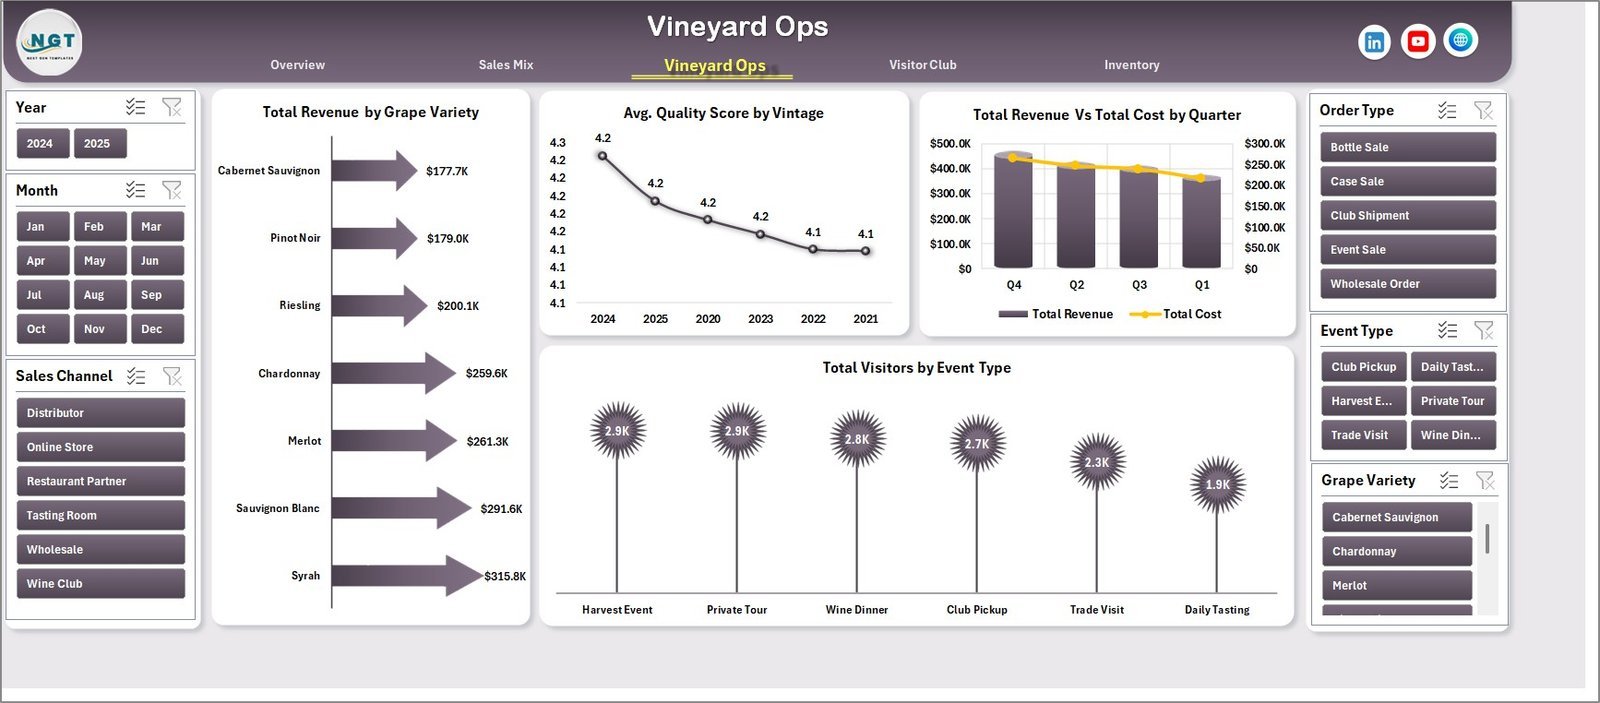
The Vineyard Ops page links field and production performance with sales results. It includes Total Revenue by Grape Variety, Avg. Quality Score by Vintage, Total Revenue vs Total Cost by Quarter, and Total Visitors by Event Type. It is helpful for seasonal reviews, harvest planning, and vintage-level quality discussions.
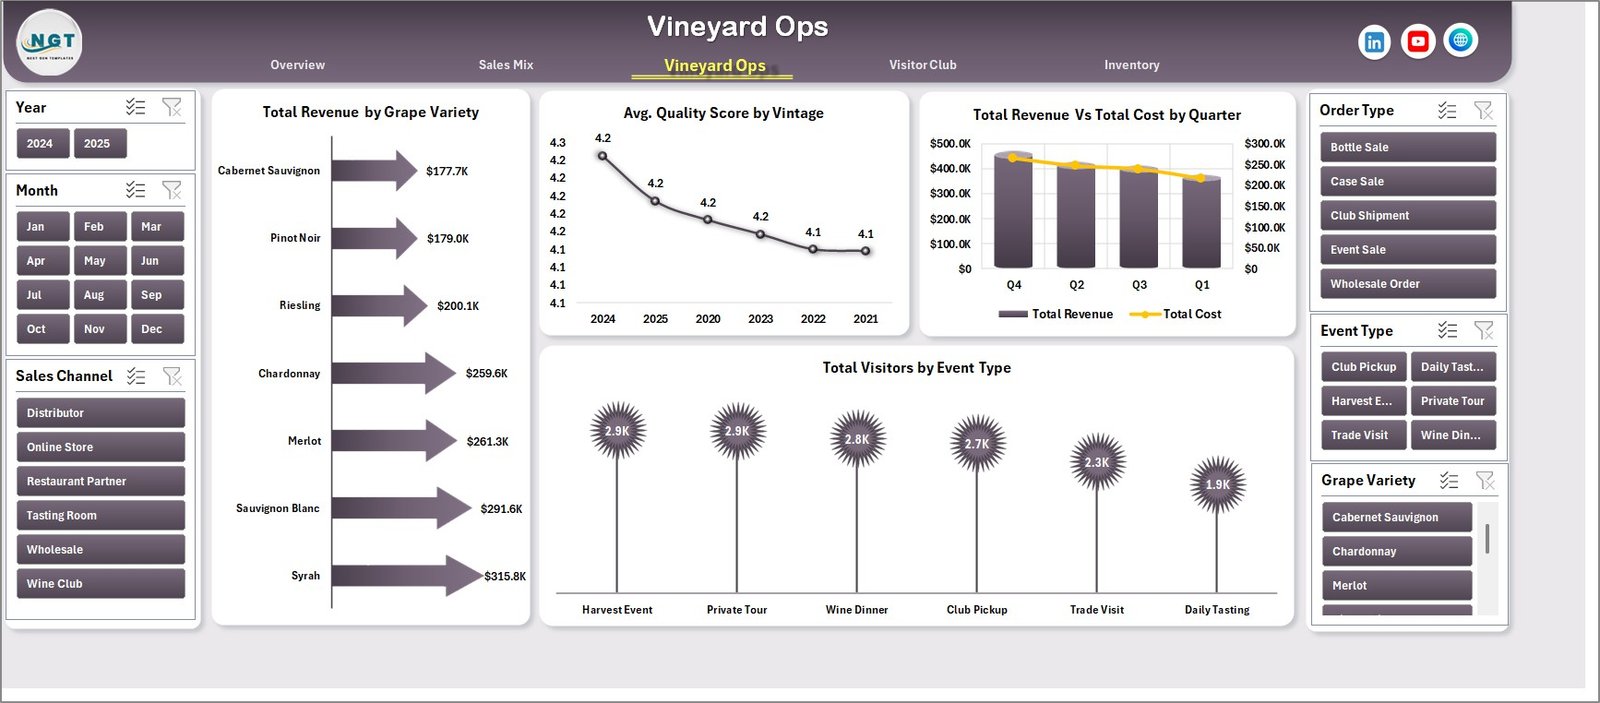
Vineyard Ops
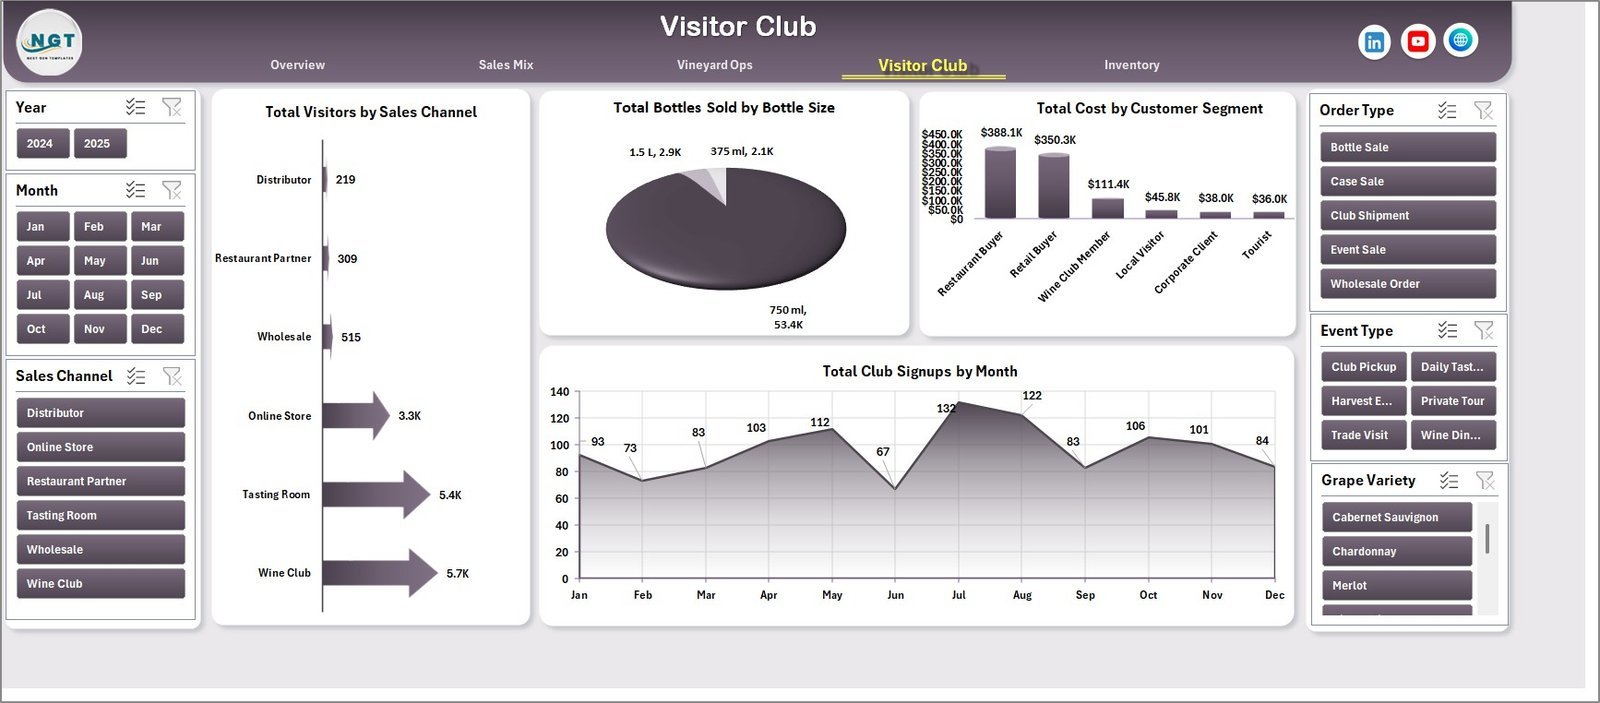
The Visitor Club page focuses on tasting room traffic and wine club growth. It covers Total Visitors by Sales Channel, Total Bottles Sold by Bottle Size, Total Cost by Customer Segment, and Total Club Signups by Month. This helps teams compare event activity, bottle formats, customer costs, and recurring member acquisition.
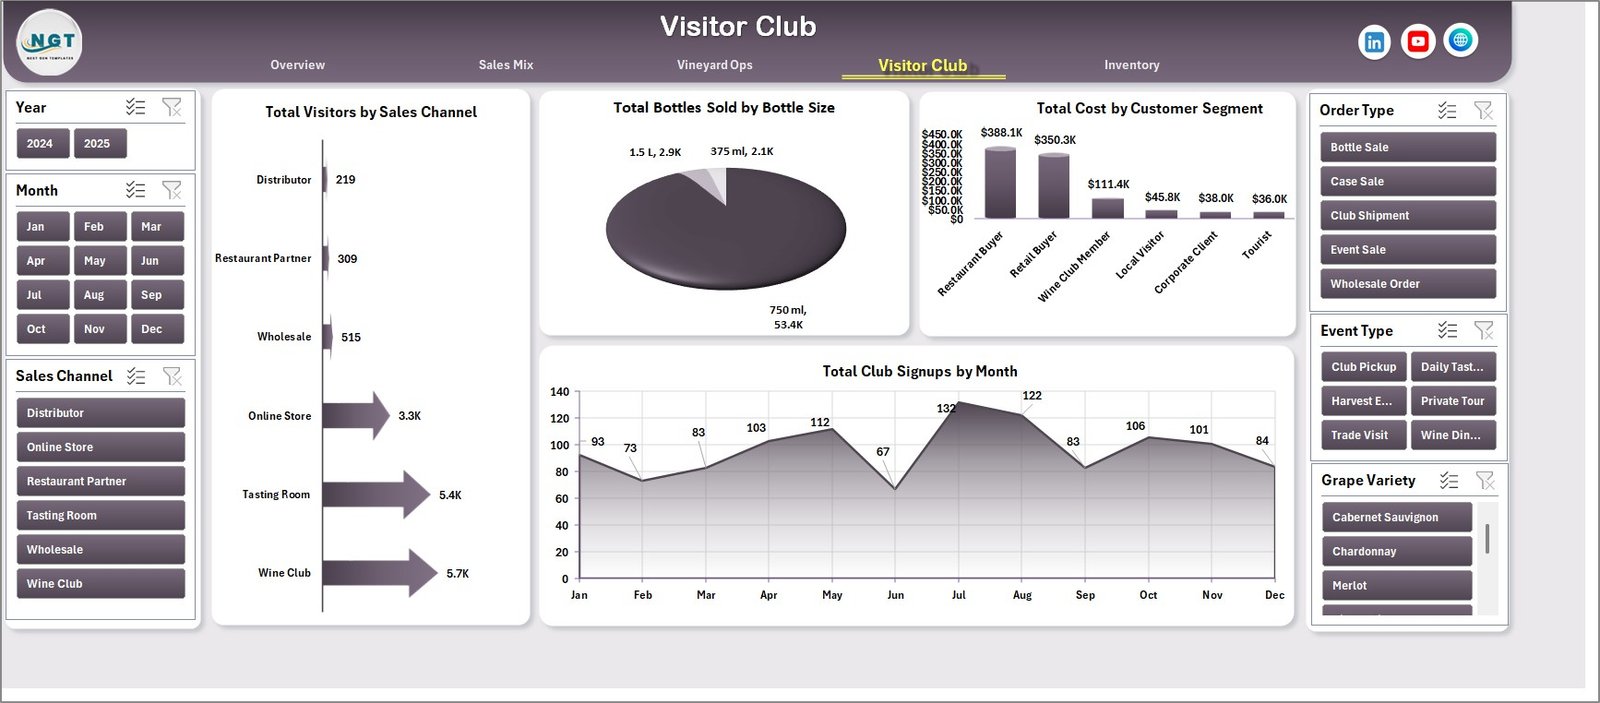
Visitor Club
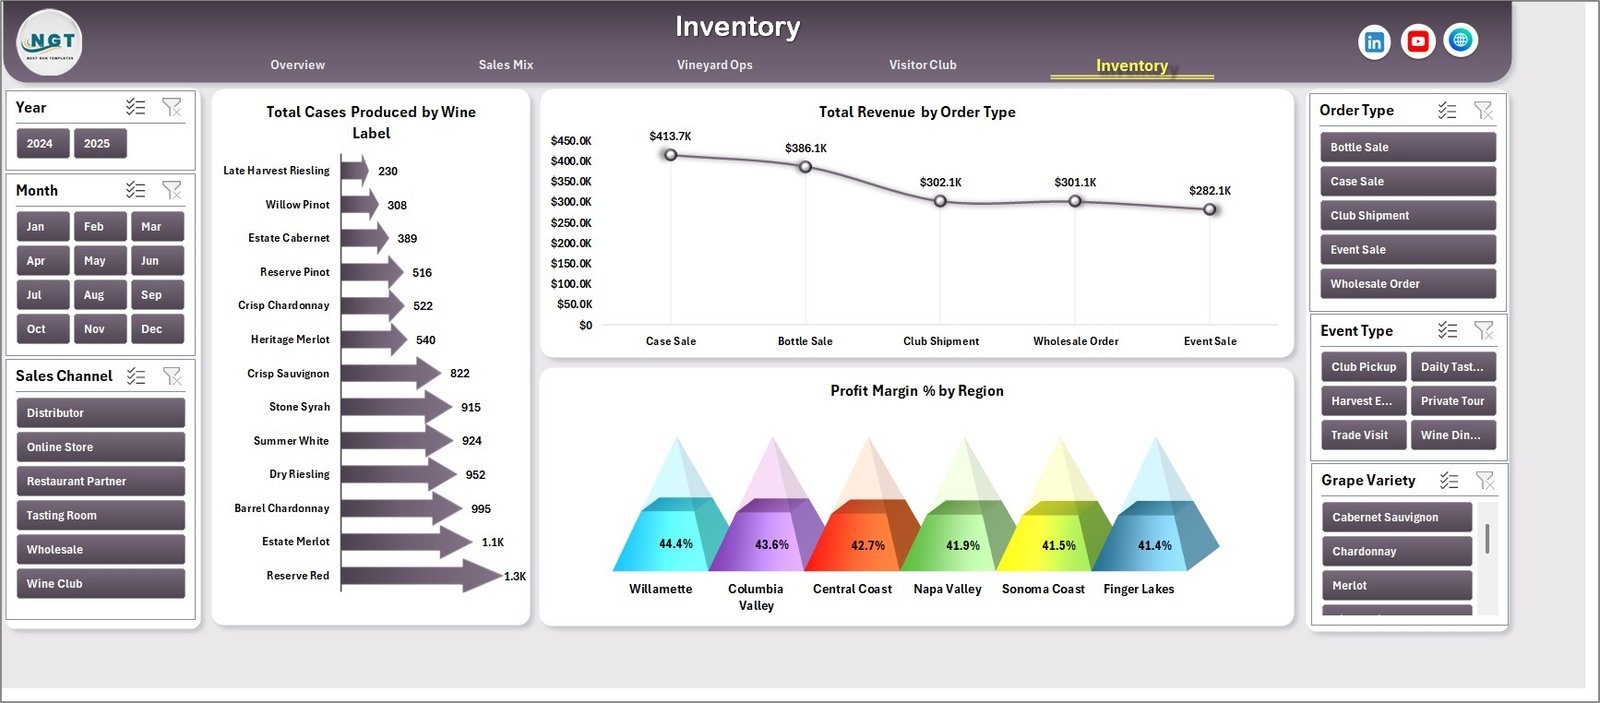
The Inventory page tracks production and revenue by finished wine and order type. It includes Total Cases Produced by Wine Label, Total Revenue by Order Type, and Profit Margin % by Region. Owners can use it to review stock planning, order mix, and regional margin pressure.
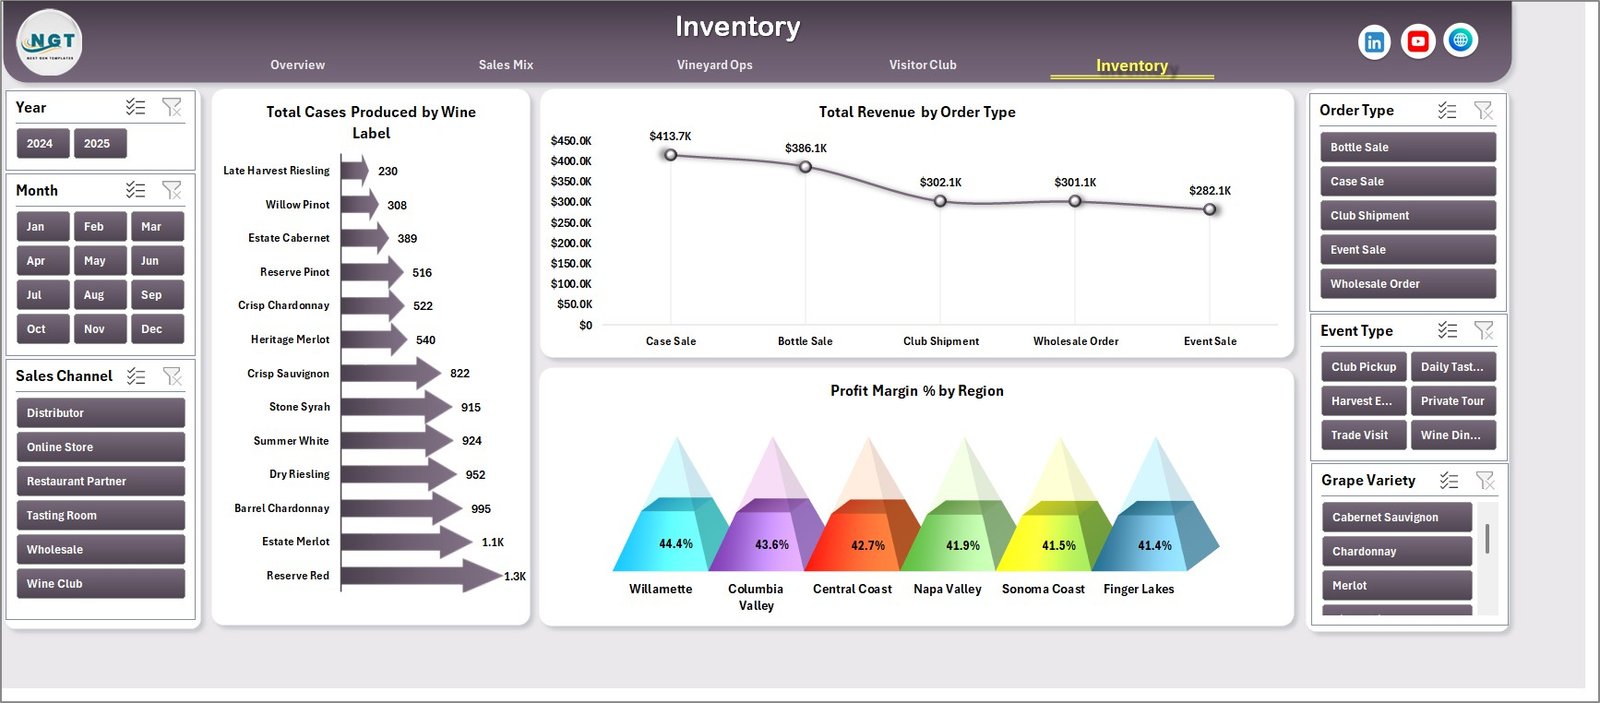
Inventory
The Data sheet is where users replace the sample rows with their own winery, vineyard, visitor, order, and production data while keeping the same column format. The Support sheet contains the pivot tables used by the dashboard and can be kept hidden after setup.

Data Sheet tab

Support sheet tab
Craft Winery and Vineyard Dashboard in Excel vs. Google Sheets vs. Paid Winery SaaS – Where This Fits
| Feature | This Excel dashboard | Google Sheets alternative | Paid winery SaaS |
|---|---|---|---|
| Cost | $17.99 one-time | One-time or subscription | Often $200+ per month |
| Platform | Microsoft Excel | Browser-based spreadsheet | Cloud application |
| Setup time | Under 10 minutes | Under 15 minutes | Days or weeks |
| Offline access | Yes | Limited | No |
| Customizable fields | Fully editable workbook | Editable sheet | Plan dependent |
| Year-1 cost at 5 users | $17.99 total | Usually low | $2,400+ typical |
Who This Template Is For – and Who It’s Not For
This template is for craft winery owners, vineyard managers, tasting room managers, wine club coordinators, operations analysts, and consultants who need a practical Excel reporting layer. It is especially useful for small and mid-size wineries that already collect sales, visitor, event, bottle, case, and production data but need a cleaner way to review it.
It is not a full winery ERP, POS, compliance, or vineyard sensor platform. If you need automated TTB filing, barcode warehouse scanning, IoT tank monitoring, or direct integrations with every sales platform, dedicated winery software may still be required.
How to Use the Craft Winery and Vineyard Dashboard in Excel
- Open the workbook in Microsoft Excel.
- Go to the Data sheet and replace the sample records with your own data in the same format.
- Keep slicer fields consistent, such as month, sales channel, region, grape variety, event type, and customer segment.
- Click Data > Refresh All in the Excel Ribbon.
- Review the Overview page first, then move through Sales Mix, Vineyard Ops, Visitor Club, and Inventory for deeper analysis.
Real-World Use Cases
Maria, a tasting room manager, uses the Visitor Club page to compare monthly club signups against visitor sources and event types before planning next month’s tasting schedule.
James, a vineyard operations lead, reviews cases produced by vineyard block and quality score by vintage before discussing harvest and bottling plans with the owner.
Anika, a wine business consultant, uses the Sales Mix and Inventory pages to help boutique winery clients see which regions, labels, and grape varieties are producing profitable growth.
Frequently Asked Questions
Does this dashboard work with my own winery data?
Yes. Replace the sample records in the Data sheet with your own data while keeping the same column layout, then refresh the workbook.
Do I need macros or VBA?
No. The dashboard uses native Excel charts, slicers, pivot tables, and formulas. It does not require VBA macros.
Can I customize the charts?
Yes. Since this is an editable Excel workbook, you can adjust chart titles, colors, formulas, slicers, and pivot fields to match your winery workflow.
Which Excel version should I use?
Use Microsoft Excel 2016 or later, including Microsoft 365. Slicers and pivot charts are supported in modern Excel versions.
Can I hide the Support sheet?
Yes. The Support sheet contains pivot tables that drive the dashboard. You can keep it hidden after setup and only unhide it for advanced changes.
Is this suitable for vineyards as well as wineries?
Yes. The dashboard includes vineyard block, grape variety, vintage quality, cases produced, visitor, sales, and inventory views, so it works for combined vineyard and winery operations.
About the Author
Built by PK – Microsoft Certified Professional with 15+ years of Excel, Google Sheets, and Power BI experience. Founder of NextGenTemplates, reaching 300K+ subscribers across YouTube channels. Every template is hand-built and tested before release.
Explore Related Templates
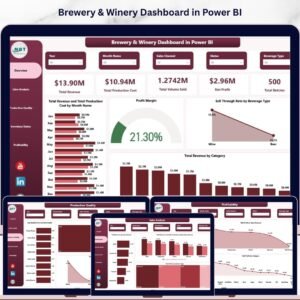
Explore the Winery KPI Dashboard in Excel, Winery KPI Scorecard in Excel, and Brewery & Winery Dashboard in Power BI. You can also browse all Excel Dashboard Templates.
Download the Craft Winery and Vineyard Dashboard in Excel today and turn winery, vineyard, visitor, and inventory records into a refreshable decision dashboard.