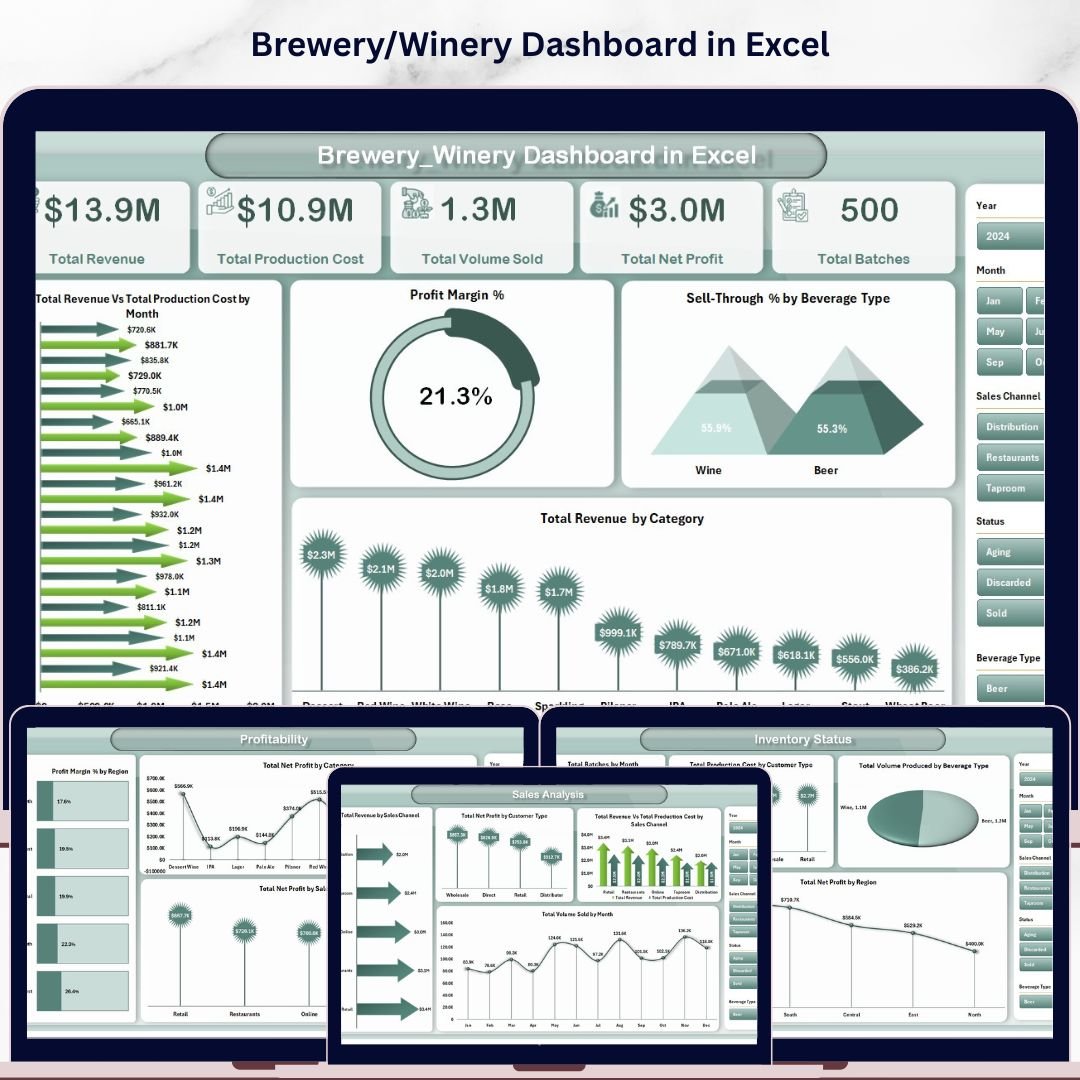
The Brewery & Winery Dashboard in Excel tracks 5 headline KPIs and 17 interactive charts across 5 analysis pages, with multi-slicer filtering, pivot-driven refresh, and a centralized data sheet. Setup takes under 10 minutes — drop your batch, sales, and quality data into the Data tab, click Refresh All, and every chart and card recalculates automatically.
🌍 Join 8,400+ teams in 40+ countries using NextGenTemplates to replace paid SaaS tools with one-time-purchase Excel, Google Sheets, Power BI, and HTML templates.
✅ Instant download · One-time payment · No subscription · No per-user fees · Lifetime access
🔑 Key Features of Brewery & Winery Dashboard in Excel
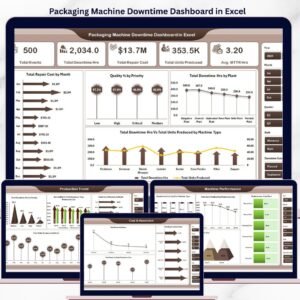
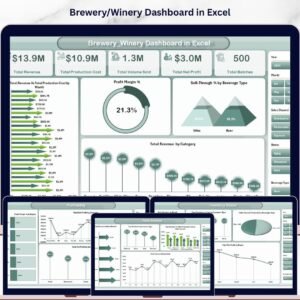
📊 Overview Page (Executive KPI Hub) — The Brewery & Winery Dashboard in Excel opens to a single-screen Overview page displaying 5 headline cards: Total Revenue, Total Production Cost, Total Volume Sold, Total Net Profit, and Total Batches. Four interactive charts sit alongside the cards — Total Revenue Vs Total Production Cost by Month, Profit Margin %, Sell-Through % by Beverage Type, and Total Revenue by Category — each filterable through multi-select slicers for region, channel, customer type, and beverage category.
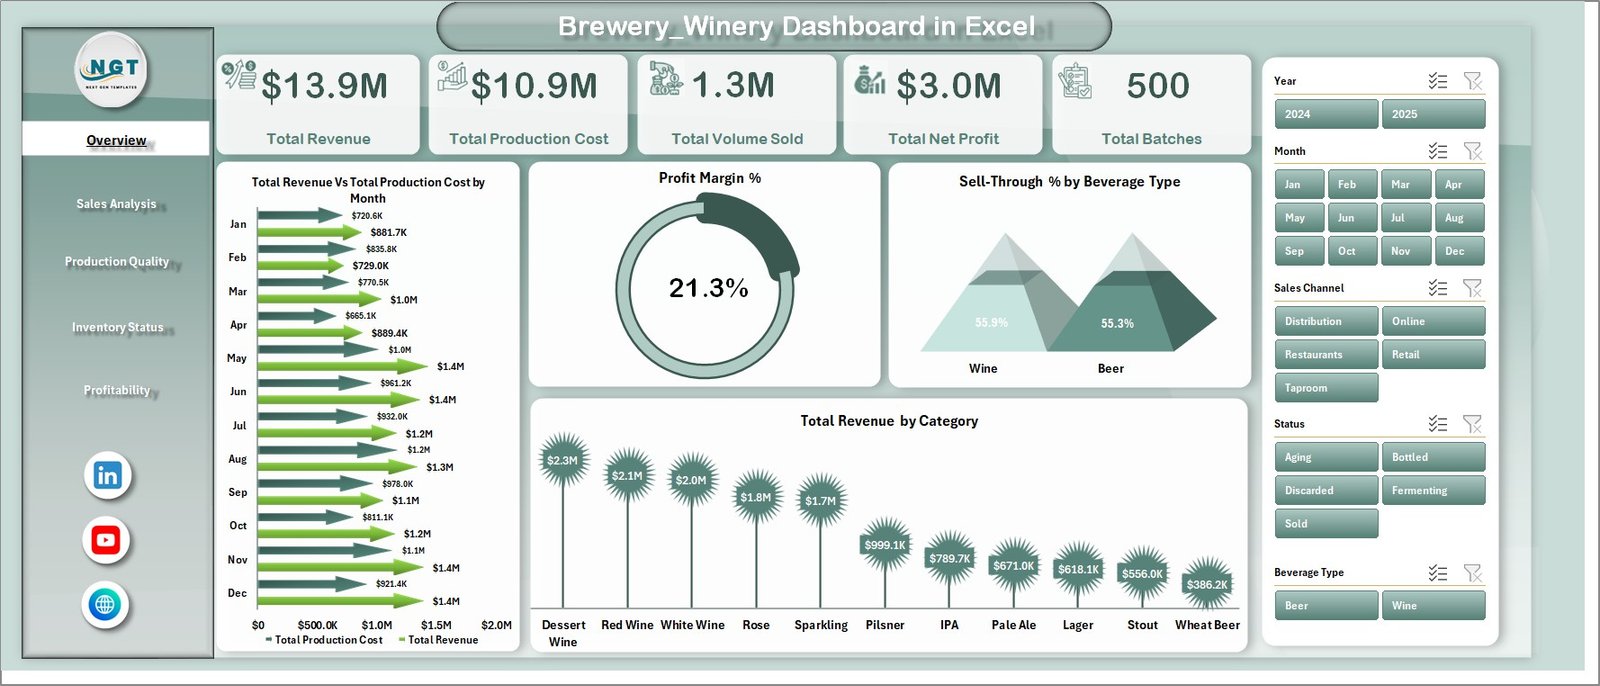
Brewery & Winery Dashboard in Excel
💰 Sales Analysis Page — A dedicated channel-and-customer breakdown sheet showing Total Revenue by Sales Channel, Total Net Profit by Customer Type, Total Revenue Vs Total Production Cost by Sales Channel, and Total Volume Sold by Month. Useful for spotting which distribution paths (taproom, retail, wholesale, e-commerce) carry the strongest profit contribution and which customer segments drive volume.
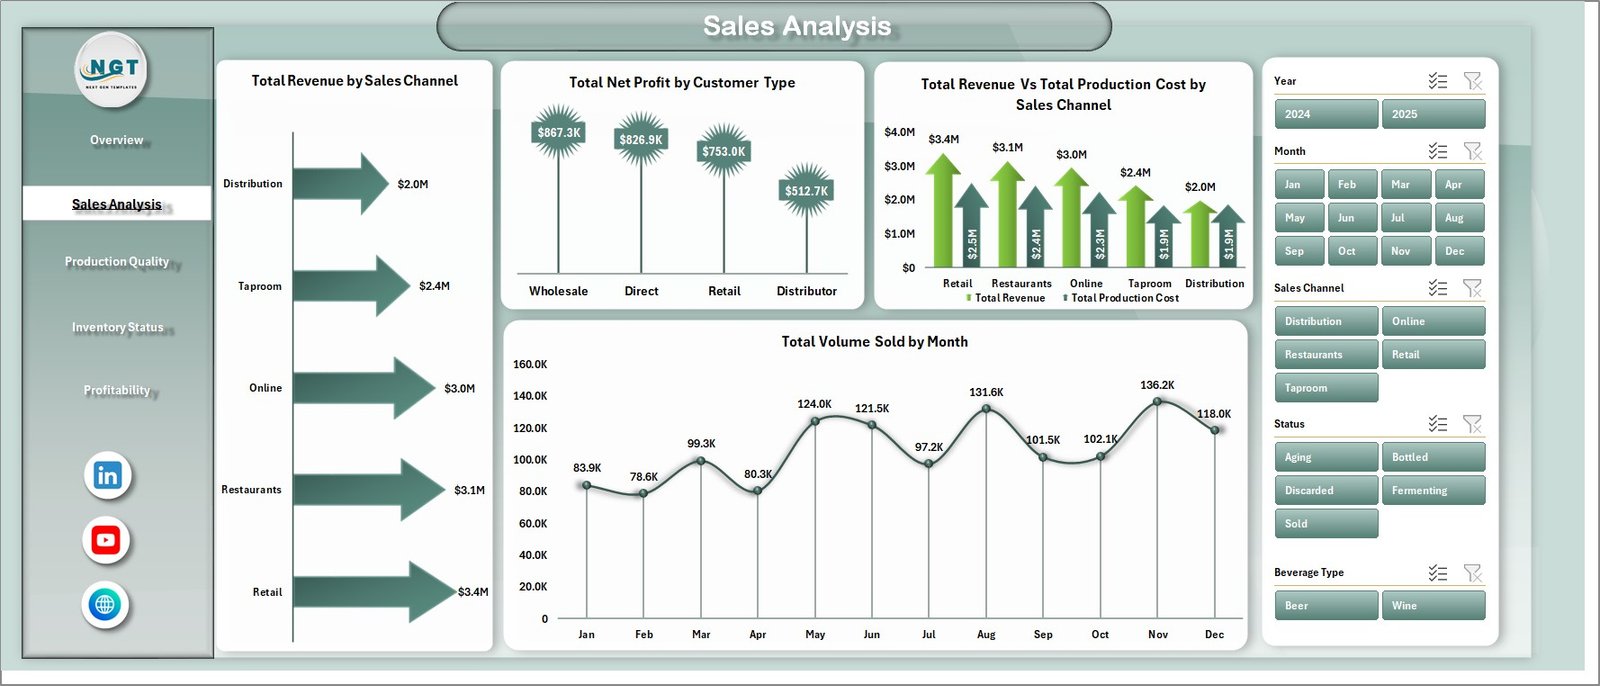
Sales Analysis
🧪 Production Quality Page — Four charts focused on craft consistency: Avg. Quality Score by Brewmaster, Avg. Quality Score Vs Avg. ABV by Beverage Type, Total Bottles Sold by Customer Type, and Total Batches by Status. The brewmaster-level scoring view supports head-to-head accountability across production teams, and the dual-axis ABV vs quality view exposes which beverage profiles consistently hit target spec.
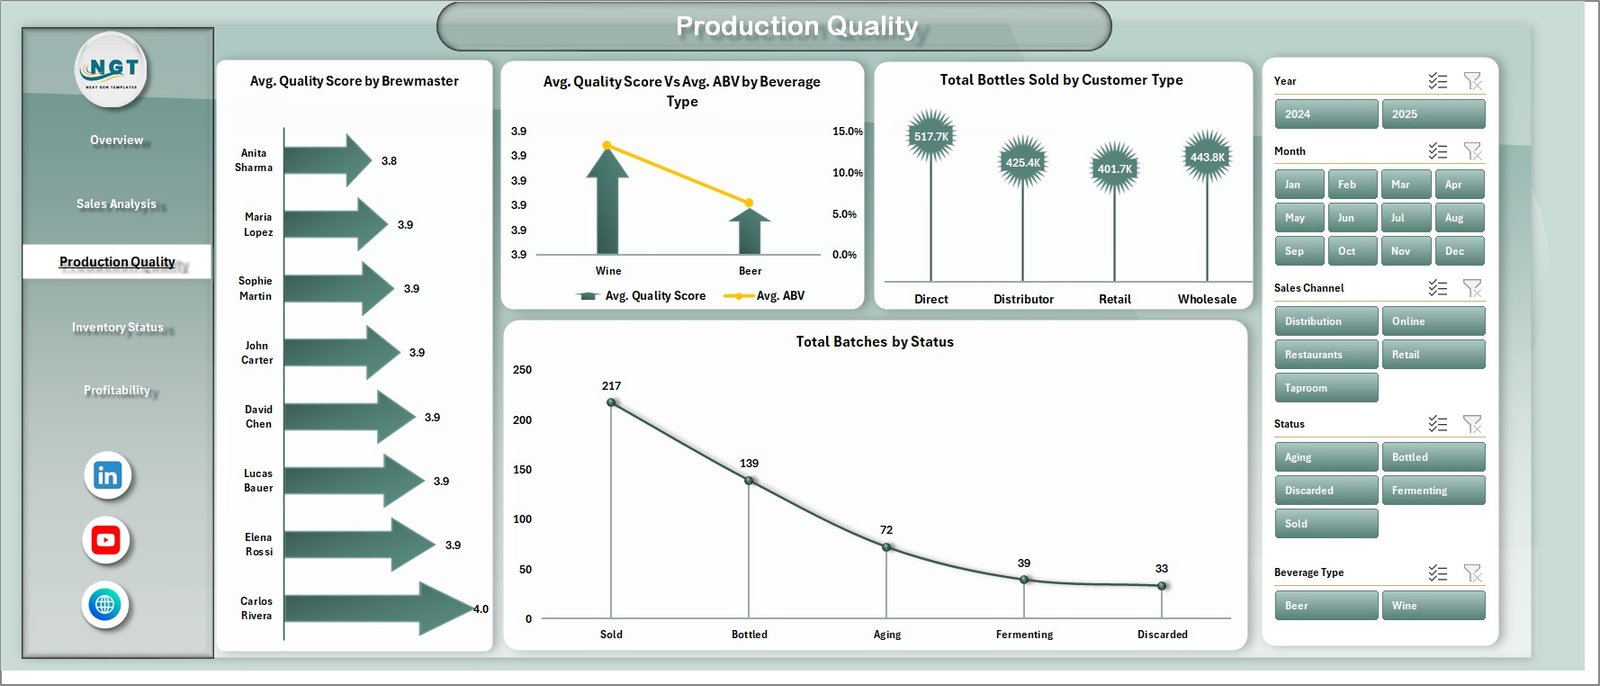
Production Quality
📦 Inventory Status Page — A four-chart inventory and production view: Total Batches by Month, Total Production Cost by Customer Type, Total Volume Produced by Beverage Type, and Total Net Profit by Region. Identifies seasonal batch patterns, beverage-mix imbalances, and regional contribution to bottom-line performance — useful before forecasting next quarter’s hops, grape, and barrel orders.
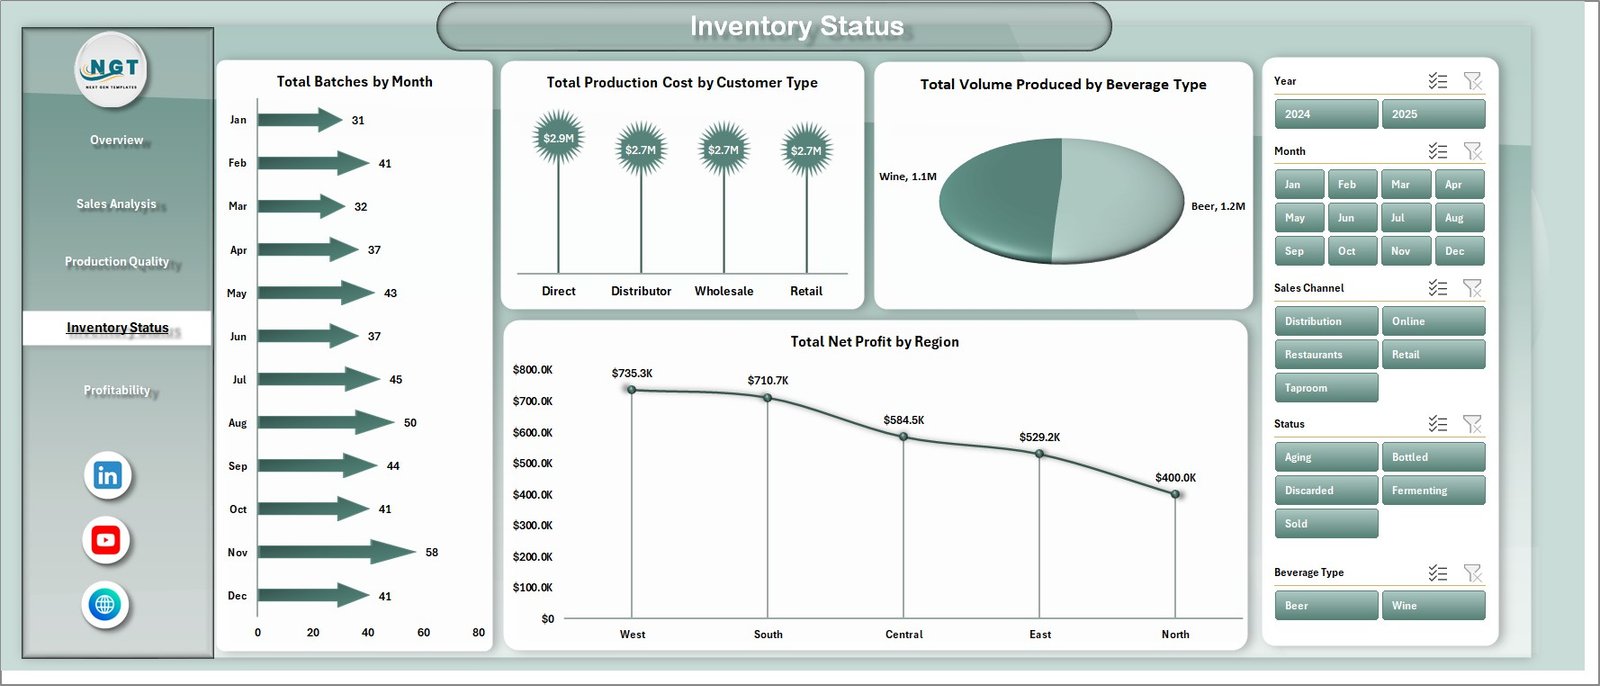
Inventory Status
📈 Profitability Page — Three margin-focused views: Profit Margin % by Region, Total Net Profit by Category, and Total Net Profit by Sales Channel. Strips production volume out of the picture and isolates pure profit contribution per geography, beverage category, and channel. Built for monthly leadership reviews and pricing decisions.
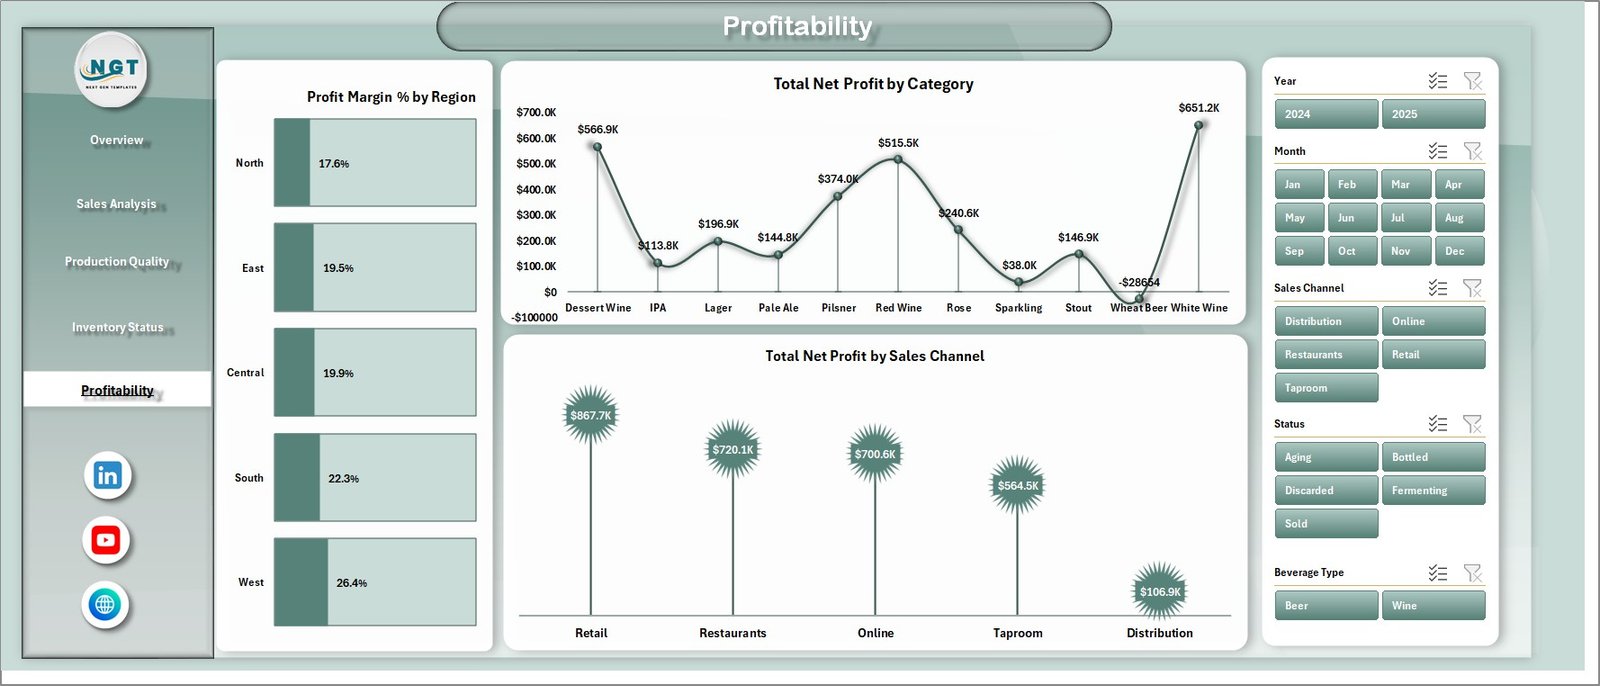
Profitability
🗂️ Data Sheet — A single, structured data tab where you replace the sample dataset with your own batch records. Maintain the same column format (batch ID, brewmaster, beverage type, ABV, quality score, region, channel, customer type, volume, cost, revenue, status) and every chart in the dashboard refreshes through the supporting pivot layer.
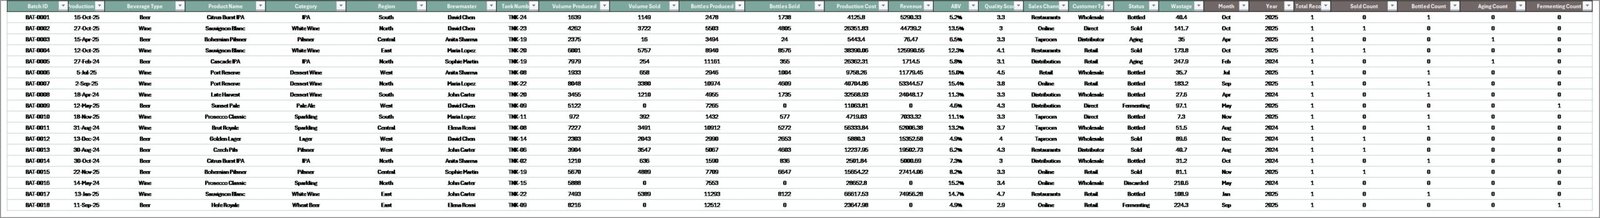
Data Sheet tab
⚙️ Support Sheet (Pivot Layer) — A hidden-by-default sheet containing the multiple pivot tables that drive every chart and slicer. After updating the Data tab, click Data → Refresh All in the Excel Ribbon and every pivot, chart, and KPI card across all 5 pages updates instantly. Power users can unhide this sheet to extend the model with new measures.
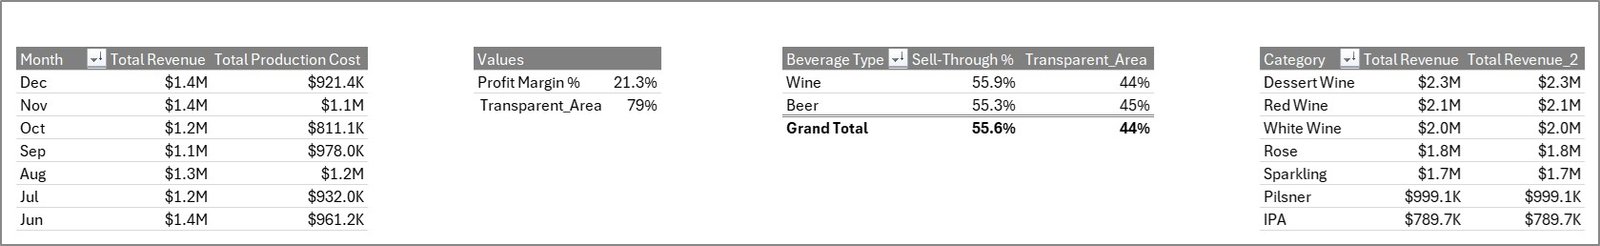
Support sheet tab
📦 What’s Inside the Brewery & Winery Dashboard in Excel
✅ 5 Interactive Pages — Overview, Sales Analysis, Production Quality, Inventory Status, and Profitability, each with its own slicer panel
✅ 5 Headline KPI Cards — Total Revenue, Total Production Cost, Total Volume Sold, Total Net Profit, and Total Batches
✅ 17 Pre-built Charts — All chart ranges expand automatically as new rows are added to the Data sheet
✅ Multi-page Slicers — Filter by Region, Sales Channel, Customer Type, Beverage Type, Category, Status, and Brewmaster
✅ Pivot-driven Architecture — One Refresh All click rebuilds every visual on every page
✅ Data Sheet — Drop-in replacement format for your batch, sales, and quality records
✅ Hidden Support Sheet — Pre-configured pivot tables that power the entire dashboard
✅ Sample Dataset Included — Pre-loaded with realistic brewery and winery batches so you can explore every page immediately
📊 Brewery & Winery Dashboard in Excel vs. Power BI Equivalent vs. Ekos / VinSUITE / Orchestrated — Where This Fits
| Feature | Brewery & Winery Dashboard in Excel | Power BI Equivalent | Ekos / VinSUITE / Orchestrated |
|---|---|---|---|
| Cost | $17.99 one-time ✅ | $11.99 one-time | $200–$1,500/month |
| Platform | Microsoft Excel (desktop) ✅ | Power BI Desktop | Cloud SaaS |
| Setup time | Under 10 minutes ✅ | 15–20 minutes | 2–6 weeks |
| Real-time team collaboration | Via SharePoint / OneDrive | Via Power BI Service | Built-in |
| Mobile access | Excel mobile app | Power BI mobile app | Native iOS / Android |
| Customizable charts & KPIs | Unlimited ✅ | Unlimited | Limited to plan |
| Share with link | Via OneDrive share | Built-in | Built-in |
| Slicer-based filtering on every page | Yes ✅ | Yes | Yes |
| Year-1 cost at 5 users | $17.99 total ✅ | $11.99 total | $2,400–$18,000 |
For breweries and wineries that want a unified production-and-sales dashboard without paying $200+/month for craft-beverage SaaS, the Brewery & Winery Dashboard in Excel sits in the sweet spot.
👥 Who This Template Is For — and Who It’s Not For
✅ This template is built for:
- 🍺 Craft brewery owners and head brewers tracking batch yield, ABV consistency, and brewmaster quality scores
- 🍷 Winery owners and winemakers monitoring fermentation batches, bottle revenue, and regional sales
- ⚙️ Operations managers at small-to-mid-size breweries and wineries (1–100 employees)
- 💰 Finance and revenue teams tracking profit margin by region, channel, and beverage category
- 📊 Beverage industry consultants who need a client-ready batch-and-sales tracker
❌ This template is NOT for:
- Enterprise breweries needing real-time IoT integration with fermentation tank sensors and bottling lines
- Teams requiring TTB excise tax automation, lot genealogy, or full crush-to-bottle compliance reporting
⚙️ How to Use the Brewery & Winery Dashboard in Excel
- Open the Excel file and start on the Overview page to confirm the sample dataset loads correctly
- Go to the Data sheet and replace the sample rows with your own batch, sales, and quality records — keep the same column structure
- Click Data → Refresh All on the Excel Ribbon to push the new data through every pivot table and chart
- Use the slicers on each page to filter by region, channel, customer type, beverage category, status, or brewmaster
- Switch between the 5 pages — Overview, Sales Analysis, Production Quality, Inventory Status, and Profitability — for different lenses on the same data
- Optionally unhide the Support sheet if you want to extend the pivot model with new measures or dimensions
💼 Real-World Use Cases
Daniel runs a craft brewery in Portland with 4 brewmasters and 18 active beverages. He uses the Brewery & Winery Dashboard in Excel to compare avg. quality score by brewmaster across his IPA, lager, and stout batches each month. The Sales Analysis page tells him whether his taproom or wholesale channel is dragging the overall margin down — replacing a $300/month Ekos seat for the parts of the workflow he actually uses.
Camille manages a 12-acre family winery in the Loire Valley. She tracks Total Net Profit by Region across her three distributor markets and uses the Profitability page to decide which beverage categories deserve more cellar space next harvest. The Inventory Status page surfaces which beverage types are over-produced relative to volume sold — invaluable input for next year’s grape contracts.
Anika consults for five small wineries and craft breweries across India. She standardizes the same Data sheet schema across every client, then delivers monthly performance reviews using the dashboard’s 5-page structure. Saves her roughly 6 hours per client compared to building decks from scratch in PowerPoint, and gives clients a file they can keep using between engagements.
❓ Frequently Asked Questions
What KPIs does the Brewery & Winery Dashboard in Excel track?
The Brewery & Winery Dashboard in Excel tracks 5 headline KPIs (Total Revenue, Total Production Cost, Total Volume Sold, Total Net Profit, Total Batches) plus 17 charts covering revenue vs cost trends, profit margin %, sell-through by beverage type, brewmaster quality scores, ABV consistency, and regional profitability — all updating automatically when you refresh the Data sheet.
How long does it take to set up the Brewery & Winery Dashboard?
Setup takes under 10 minutes. Replace the sample data on the Data sheet with your own batch, sales, and quality records, then click Data → Refresh All on the Excel Ribbon. Every chart, KPI card, and slicer across all 5 pages updates instantly. No formulas to rewrite, no chart re-binding required.
Can I use this dashboard for just a brewery or just a winery?
Yes. The Brewery & Winery Dashboard in Excel works equally well for breweries-only, wineries-only, or combined craft beverage operations. Use the Beverage Type slicer to filter to only beer, only wine, or any sub-category. The chart titles and KPI definitions stay neutral so the dashboard fits either business.
How does this compare to Ekos or VinSUITE?
The Brewery & Winery Dashboard costs $17.99 one-time versus $200–$1,500/month for full craft-beverage SaaS like Ekos, VinSUITE, or Orchestrated. It covers the analytics and reporting layer without the production planning, lot tracking, or compliance modules. Ideal for teams that want strong dashboard reporting without the SaaS subscription burden.
Do I need to know advanced Excel to use this template?
No. The Brewery & Winery Dashboard in Excel is fully built on pivot tables and standard charts — no DAX, no VBA, no macros. If you can paste data into a table and click Refresh All, you can run this dashboard. The Support sheet is hidden by default so the dashboard stays clean for end users.
Which version of Excel do I need?
The dashboard works with Microsoft Excel 2016 and later, including Microsoft 365 on Windows and Mac. Slicers and pivot charts are core Excel features available across all modern versions. No add-ins required.
Is there a Power BI version of this dashboard?
Yes — explore the Microbreweries KPI Dashboard in Power BI and the Winemaking KPI Dashboard in Power BI for cloud-collaborative versions of similar craft-beverage analytics.
👤 About the Author
Built by PK — Microsoft Certified Professional with 15+ years of Excel, Google Sheets, and Power BI experience. Founder of NextGenTemplates, reaching 300K+ subscribers across YouTube channels (@PK-AnExcelExpert, @NextGenTemplates, @NeoTechNavigators). Every template is hand-built and tested before release.
🔗 Explore Related Templates
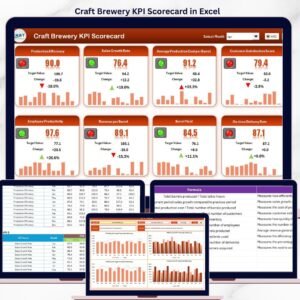
🍺 Craft Brewery KPI Scorecard in Excel — A structured 4-sheet KPI scorecard for breweries with MTD/YTD trend charts, color-coded indicators, and individual KPI drill-down.
🍷 Winery KPI Scorecard in Excel — Track 10+ winery KPIs including grape yield, fermentation efficiency, and revenue per bottle in a clean scorecard format.
🥃 Distillery KPI Scorecard in Excel — Adjacent template designed for craft distilleries tracking spirit yield, cask fill rate, and aging metrics.
📊 Also available as: Microbreweries KPI Dashboard in Power BI and Winemaking KPI Dashboard in Power BI for teams on the Power BI stack.
📂 Browse all Excel Dashboard Templates | Power BI Dashboards
📖 Click here to read the Detailed Blog Post
🎥 Visit our YouTube channel for step-by-step video tutorials
👉 YouTube.com/@NextGenTemplates
📅 Last updated: May 2026
Watch the step-by-step video tutorial:
YouTube


Reviews
There are no reviews yet.