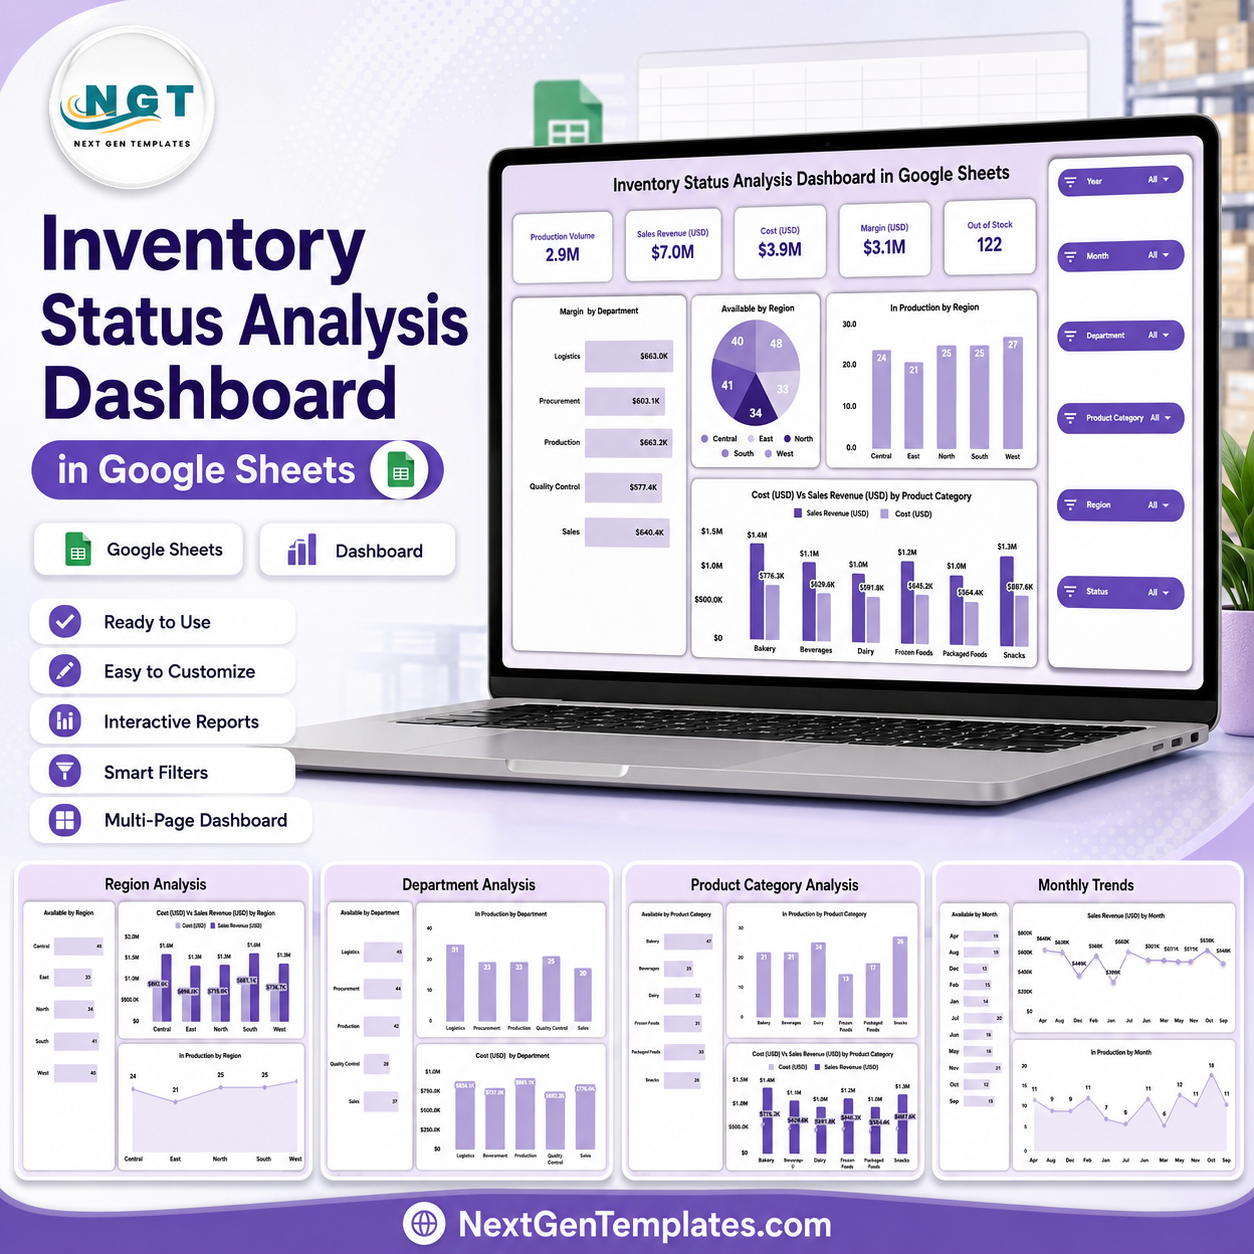

The Inventory Status Analysis Dashboard in Google Sheets turns inventory, production, cost, margin, stock status, region, department, and product category data into one decision-ready reporting file. The overview page in the sample data tracks 2.9M production volume, $7.0M sales revenue, $3.9M cost, $3.1M margin, and 122 out-of-stock items, so buyers can see the exact type of operational story this dashboard is built to answer. Join 8,400+ teams in 40+ countries using NextGenTemplates for one-time-purchase spreadsheet dashboards. Instant download, no subscription, no per-user fees, and lifetime access.
Key Features of Inventory Status Analysis Dashboard in Google Sheets
- Inventory KPI overview: Track production volume, revenue, cost, margin, and out-of-stock count from the top dashboard page.
- Six slicer-style filters: Filter by Year, Month, Department, Product Category, Region, and Status for fast analysis.
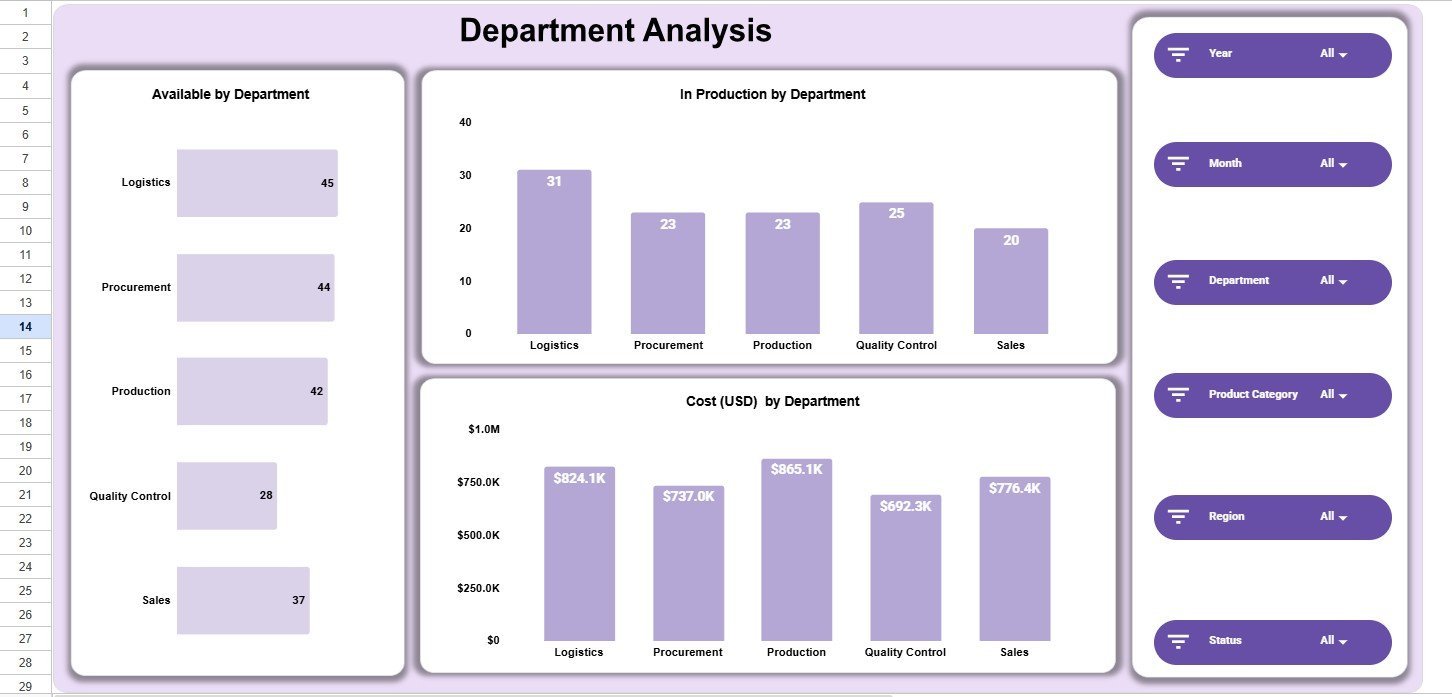
- Department analysis: Compare availability, in-production quantity, and cost across Logistics, Procurement, Production, Quality Control, and Sales.
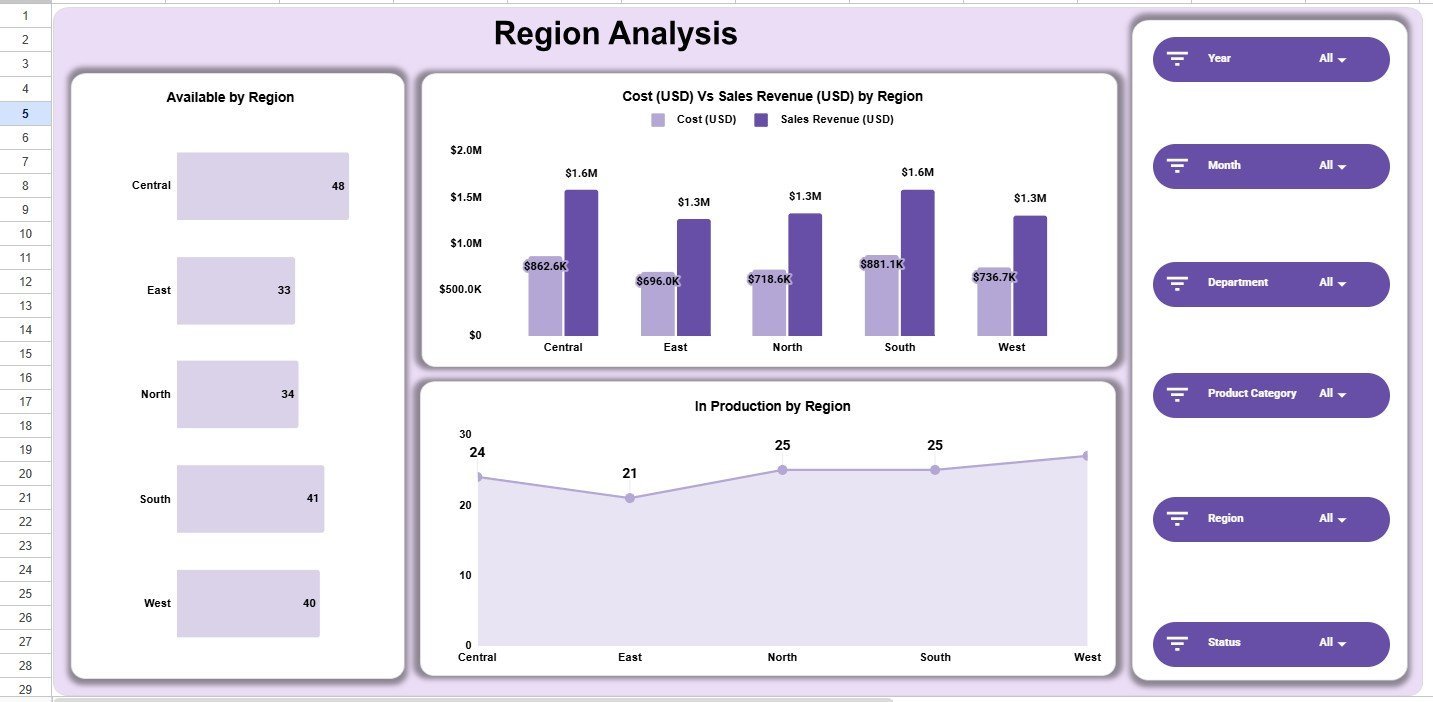
- Region analysis: Review Central, East, North, South, and West performance with availability, cost, sales, and production visuals.
- Product category analysis: Compare Bakery, Beverages, Dairy, Frozen Foods, Packaged Foods, and Snacks by availability, production, cost, and revenue.
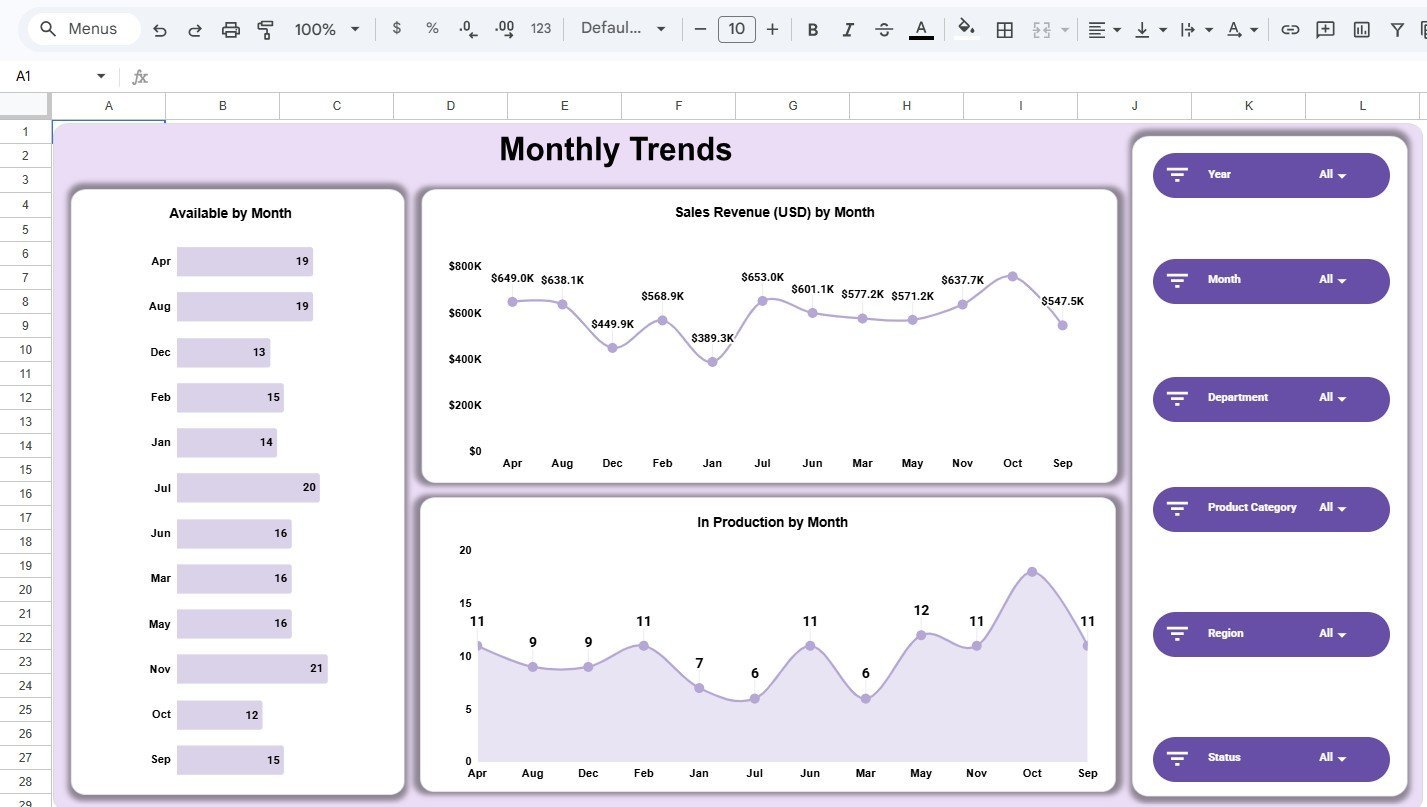
- Monthly trends: Monitor sales revenue and in-production movement by month to catch demand and capacity changes.
- Editable data sheet: Replace the sample rows with your own inventory records using the included structured data table.
What’s Inside the Inventory Status Analysis Dashboard in Google Sheets
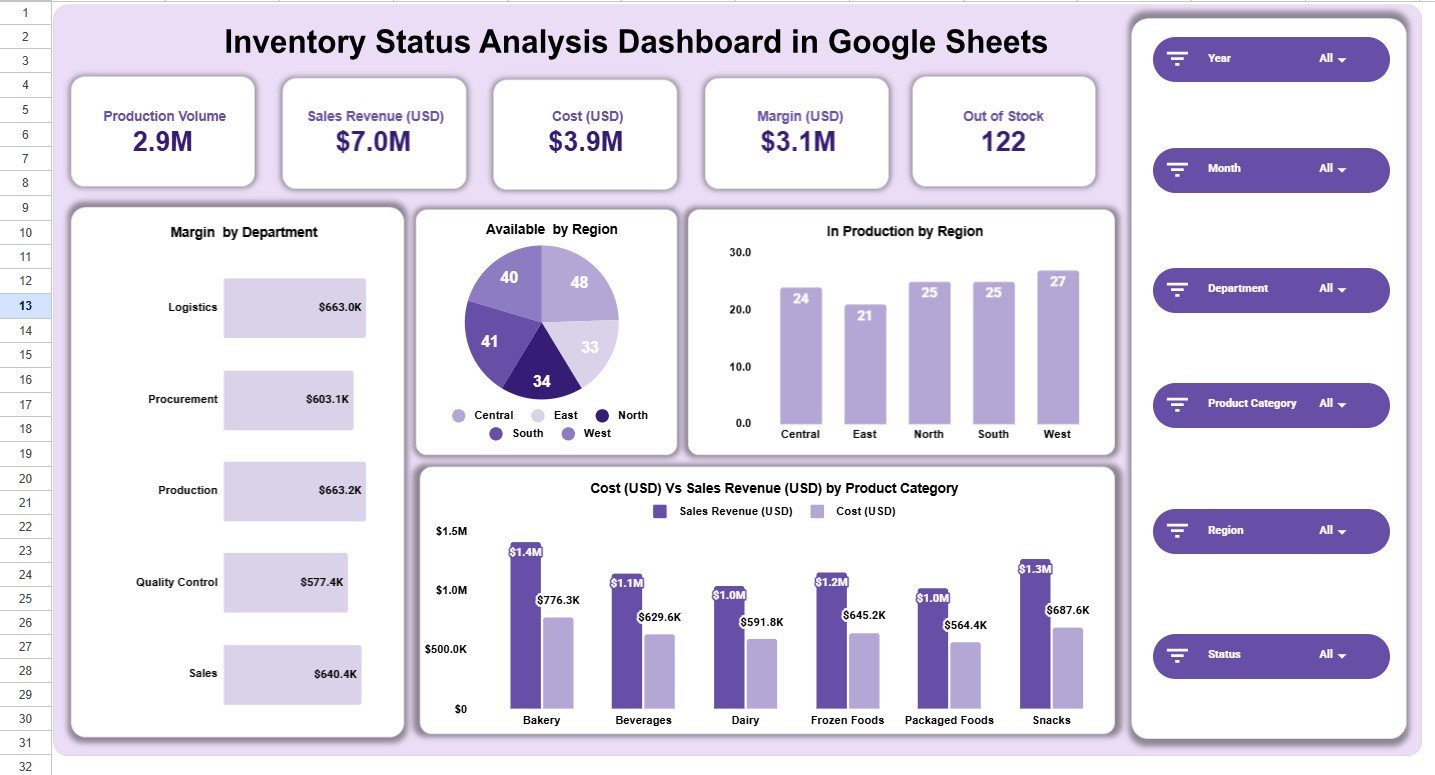
1. Overview Dashboard
The overview page gives managers a full inventory status snapshot. KPI cards summarize production volume, sales revenue, cost, margin, and out-of-stock count. Charts show margin by department, available stock by region, in-production items by region, and cost versus sales revenue by product category.
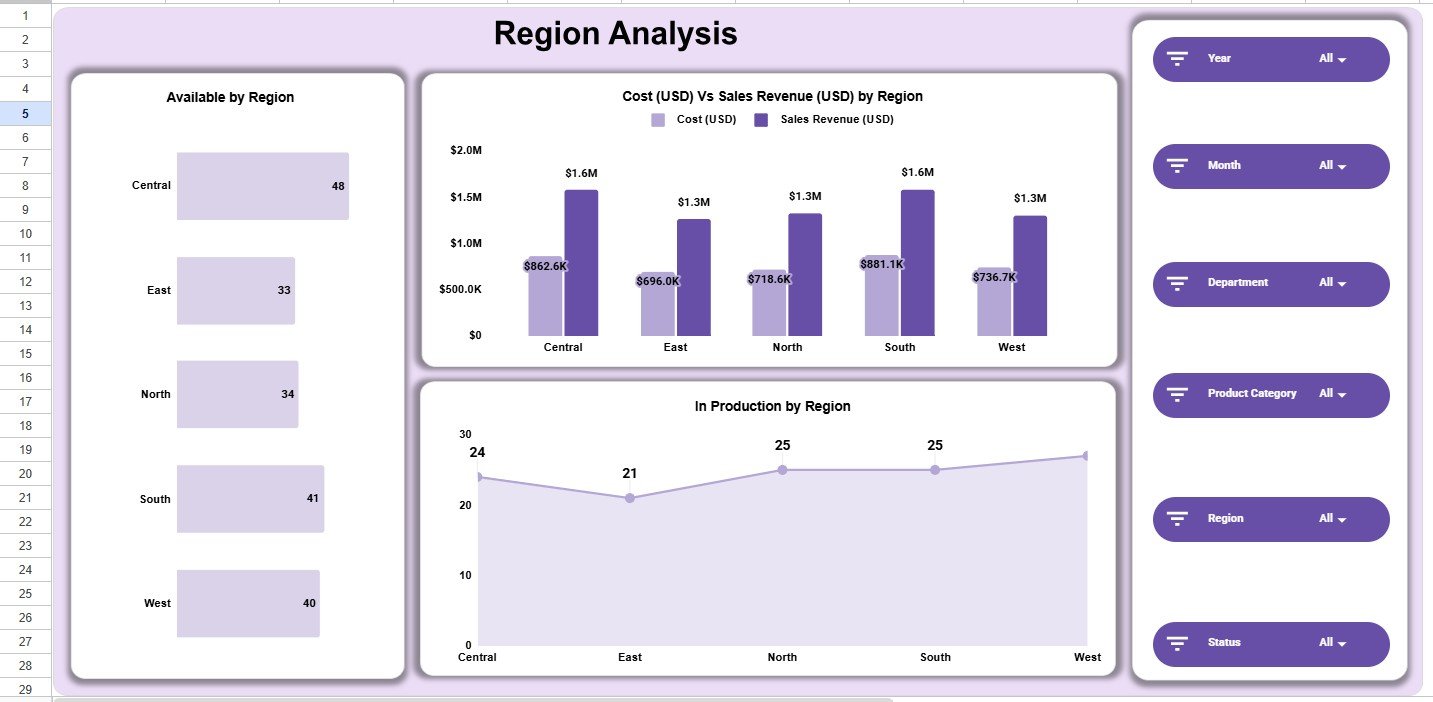
2. Region Analysis
The Region Analysis page compares availability, cost, sales revenue, and production movement across Central, East, North, South, and West. It helps operations teams see which regions hold more available stock and where production is currently active.
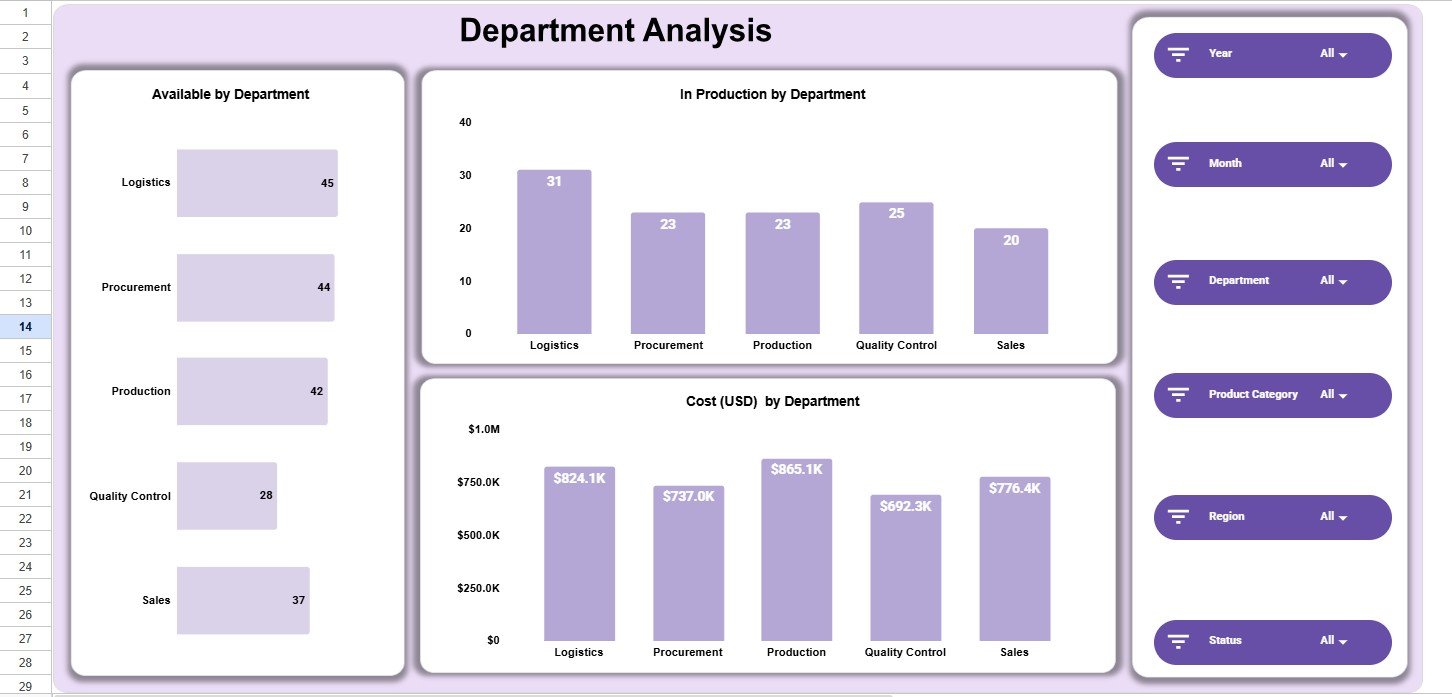
3. Department Analysis
The Department Analysis page tracks available inventory, in-production quantity, and cost by department. This is useful for comparing Logistics, Procurement, Production, Quality Control, and Sales without building separate reports.
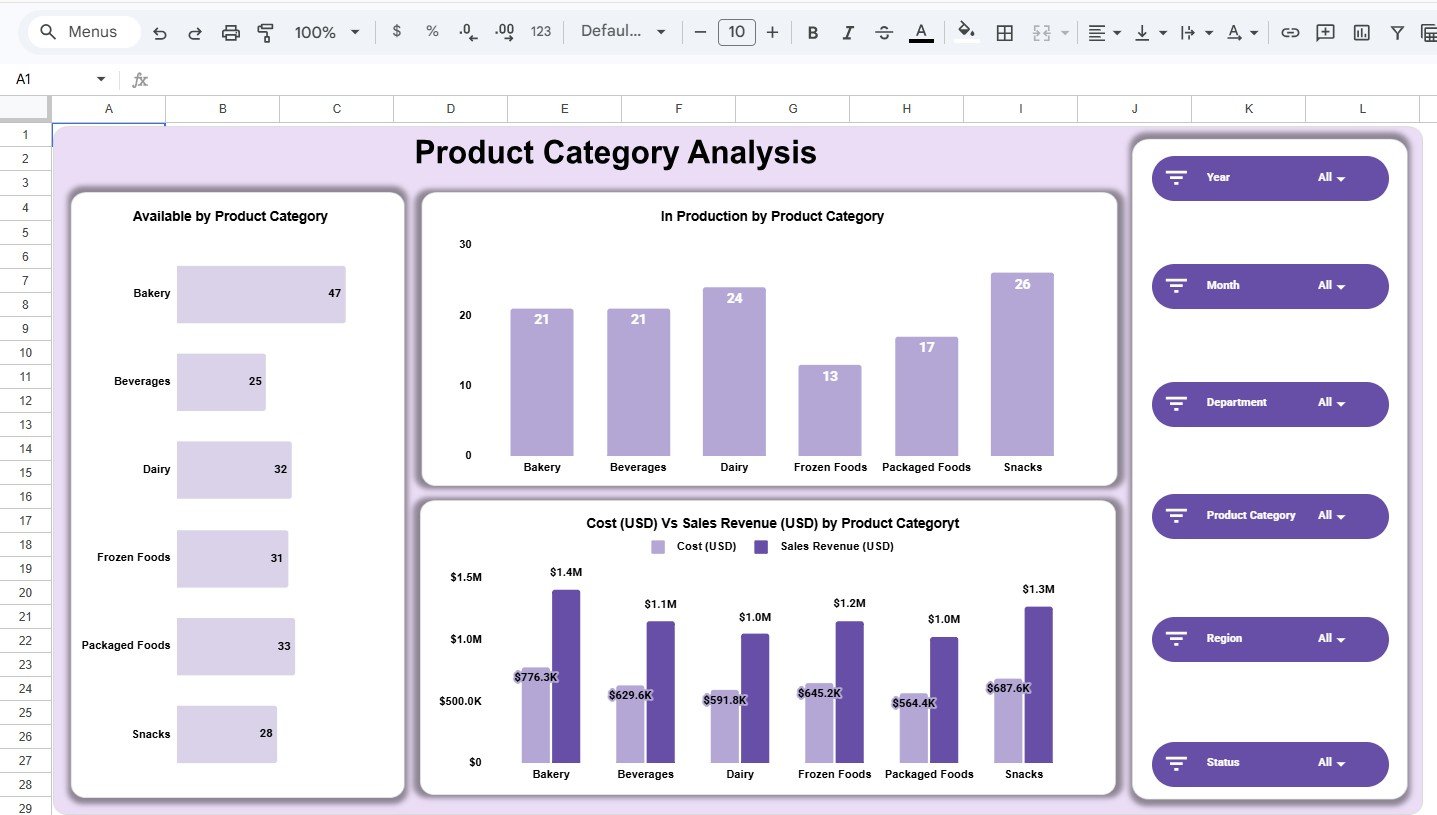
4. Product Category Analysis
The Product Category Analysis page focuses on inventory category performance. It shows available quantity, in-production count, and cost versus sales revenue for Bakery, Beverages, Dairy, Frozen Foods, Packaged Foods, and Snacks.
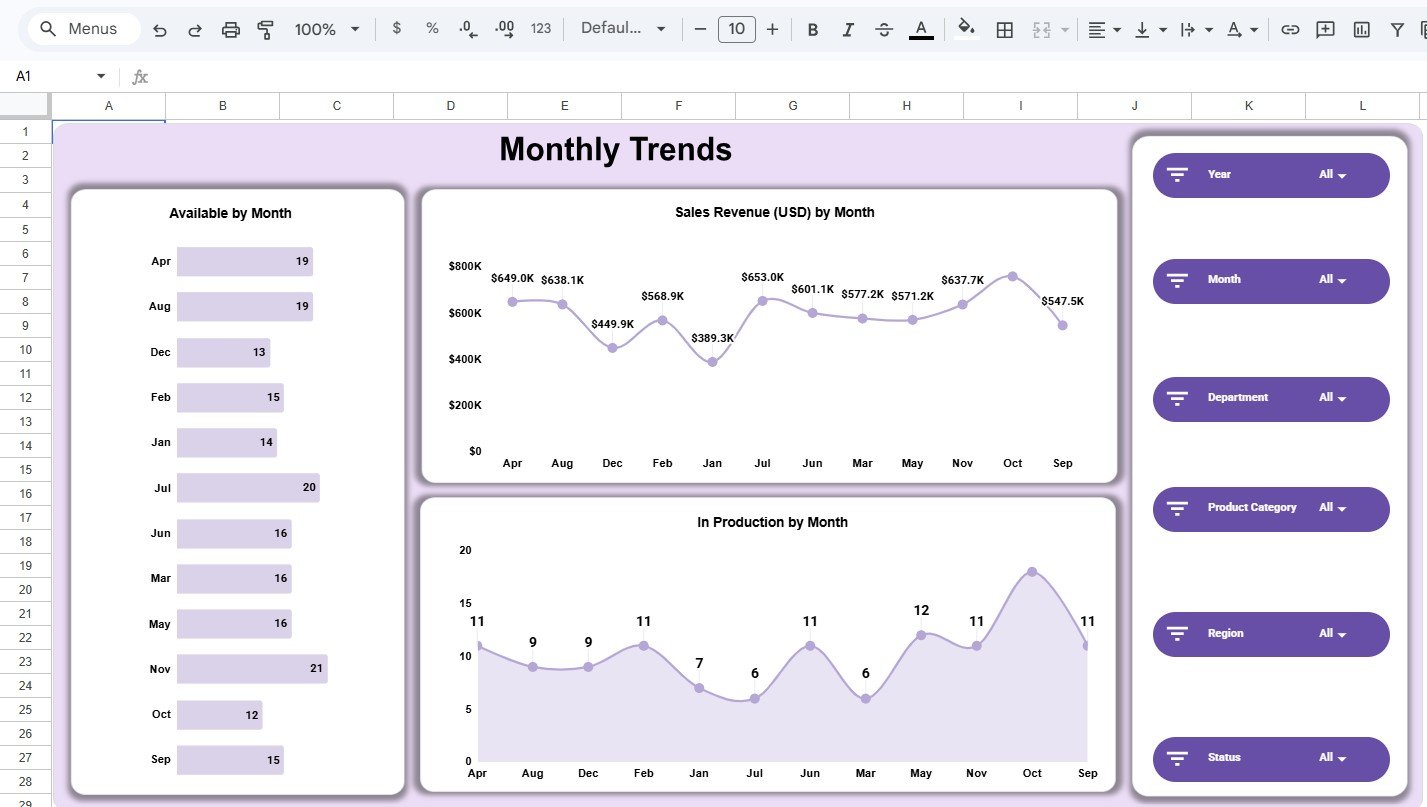
5. Monthly Trends
The Monthly Trends page shows available inventory by month, sales revenue by month, and in-production quantity by month. Use it for monthly review meetings, procurement planning, and spotting seasonal movement.
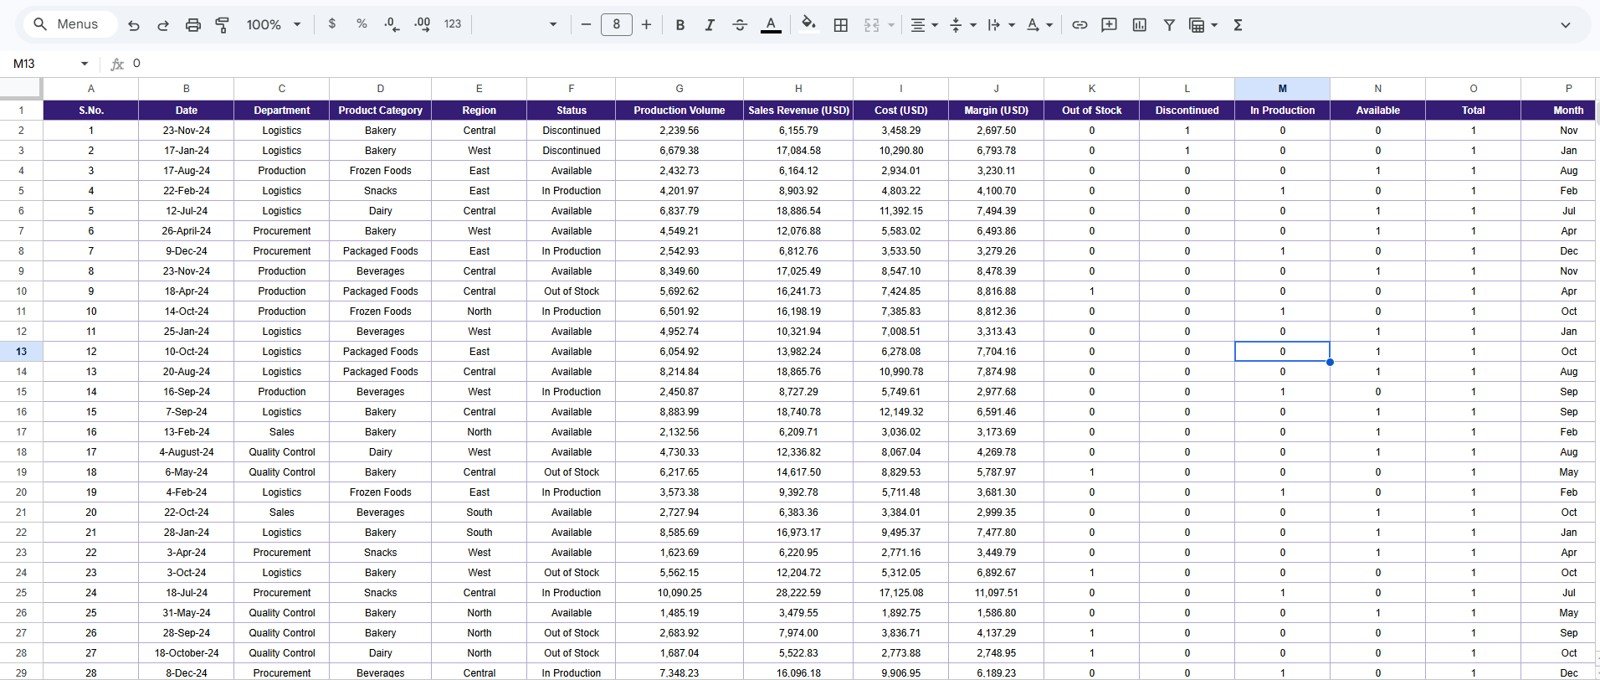
6. Data Sheet
The Data Sheet is where you replace the sample records. It includes Date, Department, Product Category, Region, Status, Production Volume, Sales Revenue, Cost, Margin, Out of Stock, Discontinued, In Production, Available, Total, and Month fields.
Inventory Status Analysis Dashboard in Google Sheets vs. Microsoft Excel vs. Paid Inventory SaaS – Where This Fits
| Feature | This Google Sheets Dashboard | Microsoft Excel Dashboard | Zoho Inventory or NetSuite ERP |
|---|---|---|---|
| Cost | $9.99 one-time | Usually one-time, file based | Monthly subscription |
| Platform | Google Sheets in browser | Desktop Excel or OneDrive | Vendor-hosted SaaS |
| Setup time | Copy the file and replace data | Open workbook and replace data | Implementation and configuration |
| Real-time team collaboration | Native Google Drive sharing | Possible, but less natural for many teams | Built in |
| Mobile access | Google Sheets mobile app | Excel app or browser | Vendor app |
| Custom fields | Editable spreadsheet columns | Editable workbook structure | Limited by plan or configuration |
| Year-1 cost at 5 users | $9.99 total | Template cost plus Microsoft access | Often hundreds to thousands of dollars |
| Best use case | Fast inventory status reporting | Desktop-heavy analysis | Full inventory operations system |
Who This Template Is For – and Who It’s Not For
This template is built for inventory managers, warehouse supervisors, procurement teams, production planners, small manufacturers, food and beverage businesses, and operations analysts who need a clear inventory dashboard without setting up a SaaS system.
It is not a replacement for barcode scanning, automated stock sync, purchase order automation, ERP workflows, or live accounting integration. If you need those features, a full inventory SaaS or a custom Google Apps Script web app may be a better fit.
How to Use the Inventory Status Analysis Dashboard in Google Sheets
- Open the PDF guide included with your purchase.
- Use the Google Sheets copy link to create your editable copy in Google Drive.
- Go to the Data Sheet and replace the sample rows with your own inventory records.
- Keep the same column structure so charts and formulas continue working.
- Use the Year, Month, Department, Product Category, Region, and Status filters to review different inventory views.
- Review the overview first, then move into Region, Department, Product Category, and Monthly Trends pages.
Real-World Use Cases
Maria, a warehouse manager, reviews out-of-stock count and available inventory by region every Monday so replenishment work starts before shortage pressure increases.
Daniel, a production planner, uses the Department and Product Category pages to compare in-production items against sales revenue and cost before weekly planning meetings.
Aisha, a procurement analyst, uses Monthly Trends to identify which months carry higher production activity and where category-level costs need supplier review.
Frequently Asked Questions
Is this dashboard built in Google Sheets?
Yes. The file is designed for Google Sheets. After purchase, use the copy link from the guide to create your own editable version in Google Drive.
Can I replace the sample inventory data?
Yes. Replace the sample rows in the Data Sheet with your own records while keeping the same columns so the dashboard pages continue updating correctly.
What KPIs are included?
The overview page includes Production Volume, Sales Revenue, Cost, Margin, and Out of Stock. Analysis pages also show availability, in-production status, and category or regional comparisons.
Does it support filters?
Yes. The dashboard includes slicer-style filters for Year, Month, Department, Product Category, Region, and Status.
Do I need advanced spreadsheet skills?
No. The dashboard is already built. You mainly update the Data Sheet, use the filters, and review the charts.
Can this replace inventory software?
It can replace manual reporting for many small teams, but it does not include barcode scanning, purchase order workflows, or automatic stock sync.
About the Author
Built by PK – Microsoft Certified Professional with 15+ years of Excel, Google Sheets, and Power BI experience. Founder of NextGenTemplates, reaching 300K+ subscribers across YouTube channels. Every template is hand-built and tested before release.
Explore Related Templates
For broader stock tracking, explore the , the Web-based Advanced Inventory Management System, and the Multi-Location Inventory Management in Google Sheets. You can also browse all Google Sheets Dashboard templates and Inventory Management templates.
Download the Inventory Status Analysis Dashboard in Google Sheets today and turn inventory status, cost, revenue, production, and stock availability into a clear operating view.
Watch the step-by-step video Demo:
Last updated: June 13, 2026.


Reviews
There are no reviews yet.