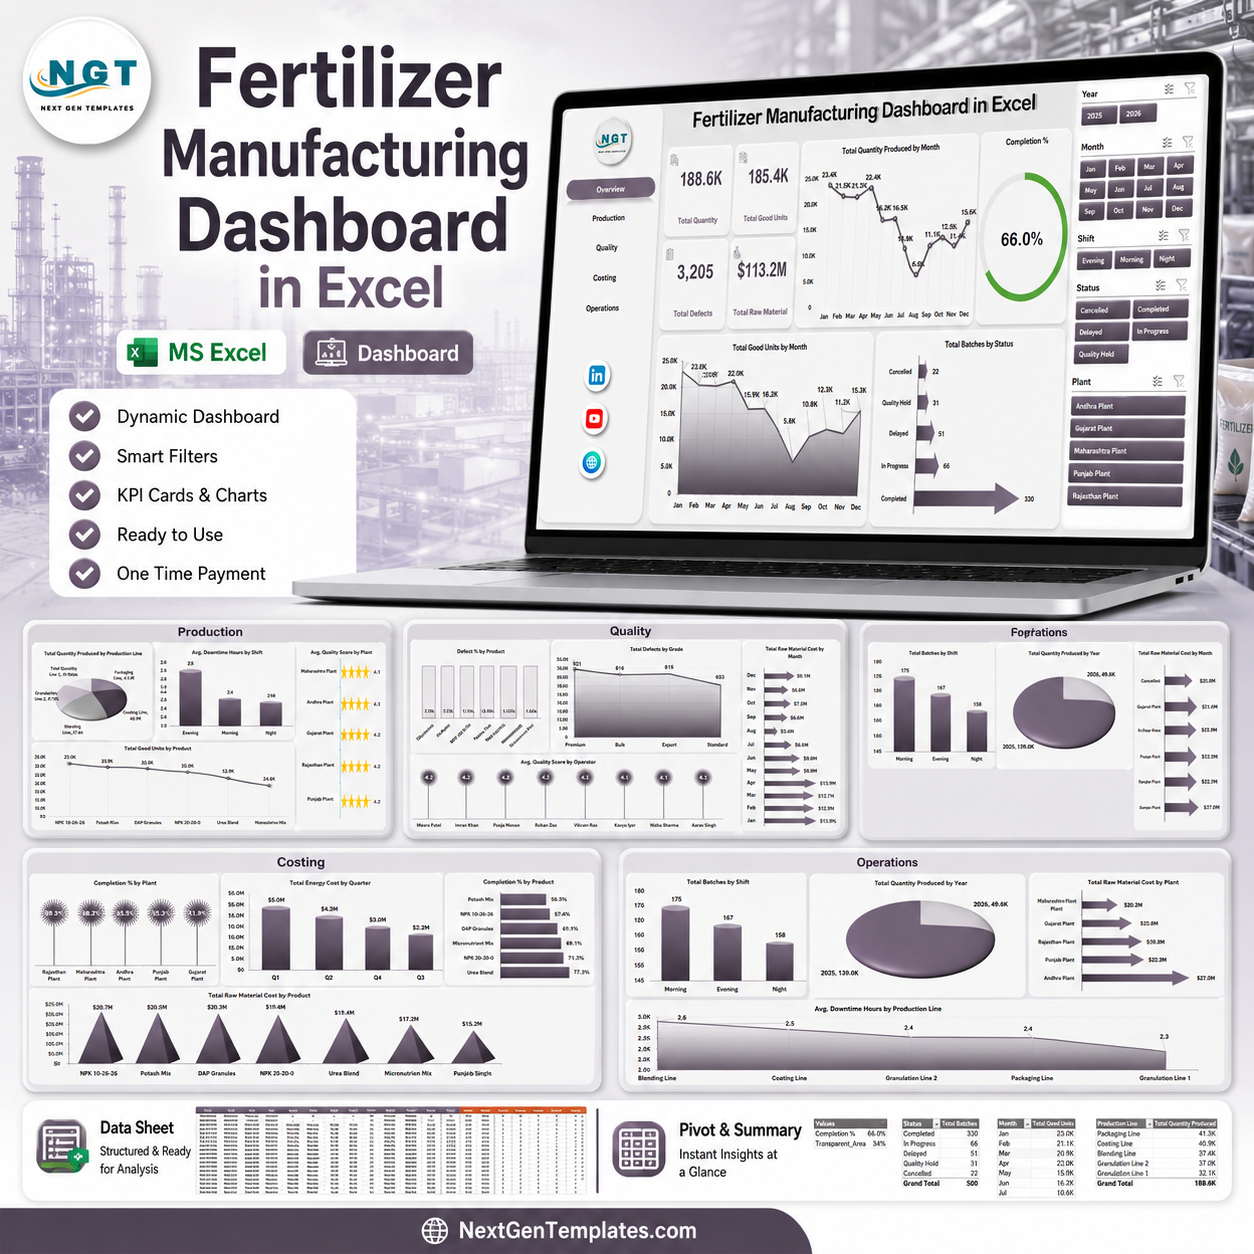


The Fertilizer Manufacturing Dashboard in Excel gives plant, production, quality, costing, and operations teams a 7-sheet reporting system with 4 headline KPI cards, 16 analysis charts, slicer-based filtering, a data input sheet, and pivot-backed support tables. Setup is simple: replace the sample production records, refresh all pivots from the Excel Data tab, and the dashboard pages update automatically.
Join 8,400+ teams in 40+ countries using NextGenTemplates to replace recurring SaaS reporting costs with one-time purchase Excel, Google Sheets, Power BI, and HTML templates.
Instant access | One-time payment | No subscription | Lifetime access
Key Features of Fertilizer Manufacturing Dashboard in Excel
- 7 worksheet tabs covering Overview, Production, Quality, Costing, Operations, Data, and Support.
- 4 KPI cards for Total Quantity, Total Good Units, Total Defects, and Total Raw Material.
- 16 analysis charts for production, quality, costing, and operations review.
- Slicer-based filtering for quick filtered dashboard views.
- Pivot-backed dashboard engine that refreshes after data updates.
- Editable Excel format for customizing products, plants, lines, shifts, operators, and periods.
What’s Inside the Fertilizer Manufacturing Dashboard in Excel
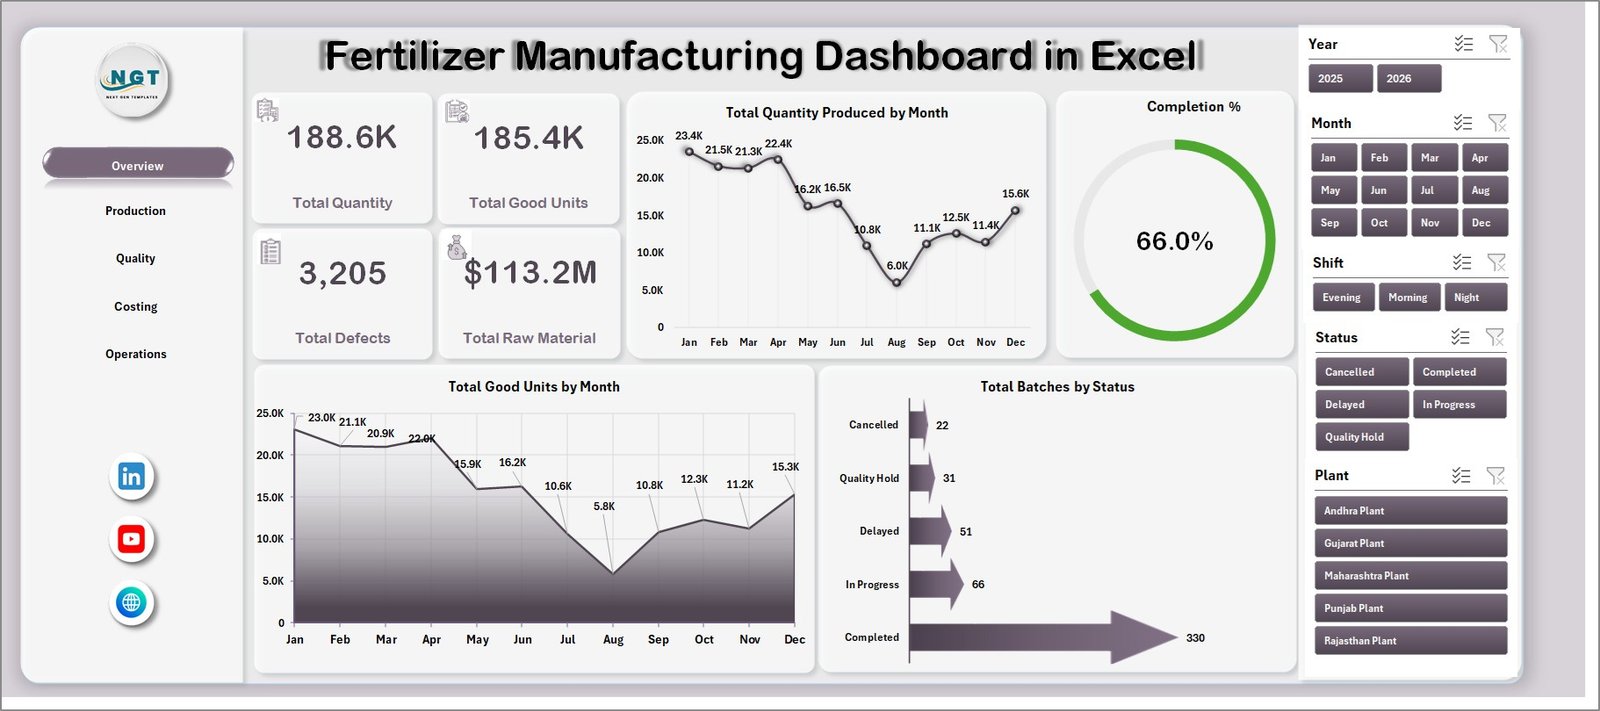
Overview Page
The Overview page gives senior managers a high-level view with cards for Total Quantity, Total Good Units, Total Defects, and Total Raw Material. It also includes charts for Total Quantity Produced by Month, Completion %, Total Good Units by Month, and Total Batches by Status.
Total Quantity Produced by Month: Shows monthly production volume so users can identify seasonality, capacity changes, and output trends. It helps plant teams see whether production is increasing, declining, or staying flat.
Completion %: Summarizes batch or production completion performance. It helps managers see whether planned work is completed on time and where execution gaps may exist.
Total Good Units by Month: Focuses on usable output rather than total output. Comparing it with total quantity helps quality and production teams spot scrap, rework, or yield issues.
Total Batches by Status: Breaks batches into their current status categories. It gives managers a fast view of completed, pending, delayed, or in-process work.
Fertilizer Manufacturing Dashboard in Excel
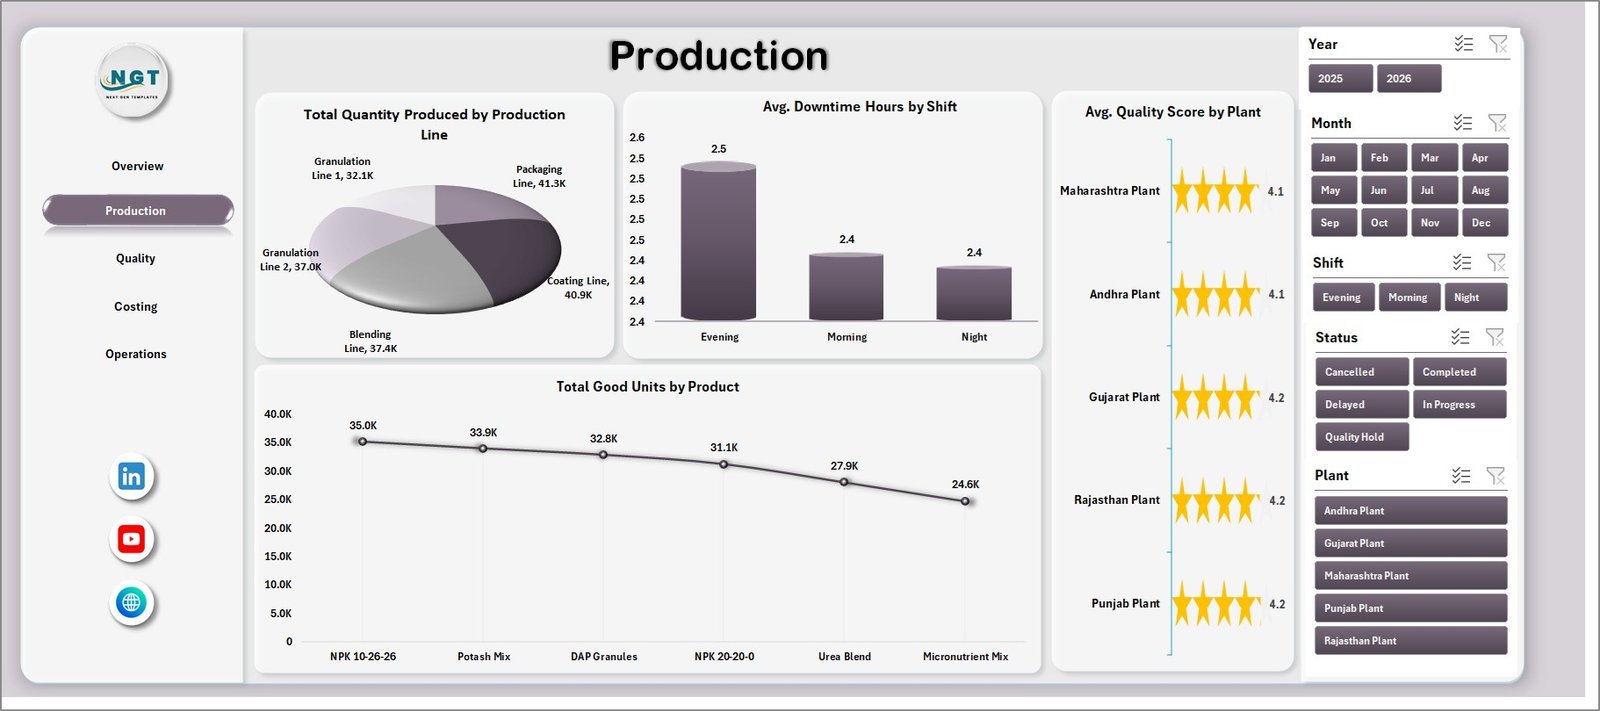
Production Page
The Production page compares output and operational efficiency by production line, shift, plant, and product. It includes Total Quantity Produced by Production Line, Avg. Downtime Hours by Shift, Avg. Quality Score by Plant, and Total Good Units by Product.

Production Page
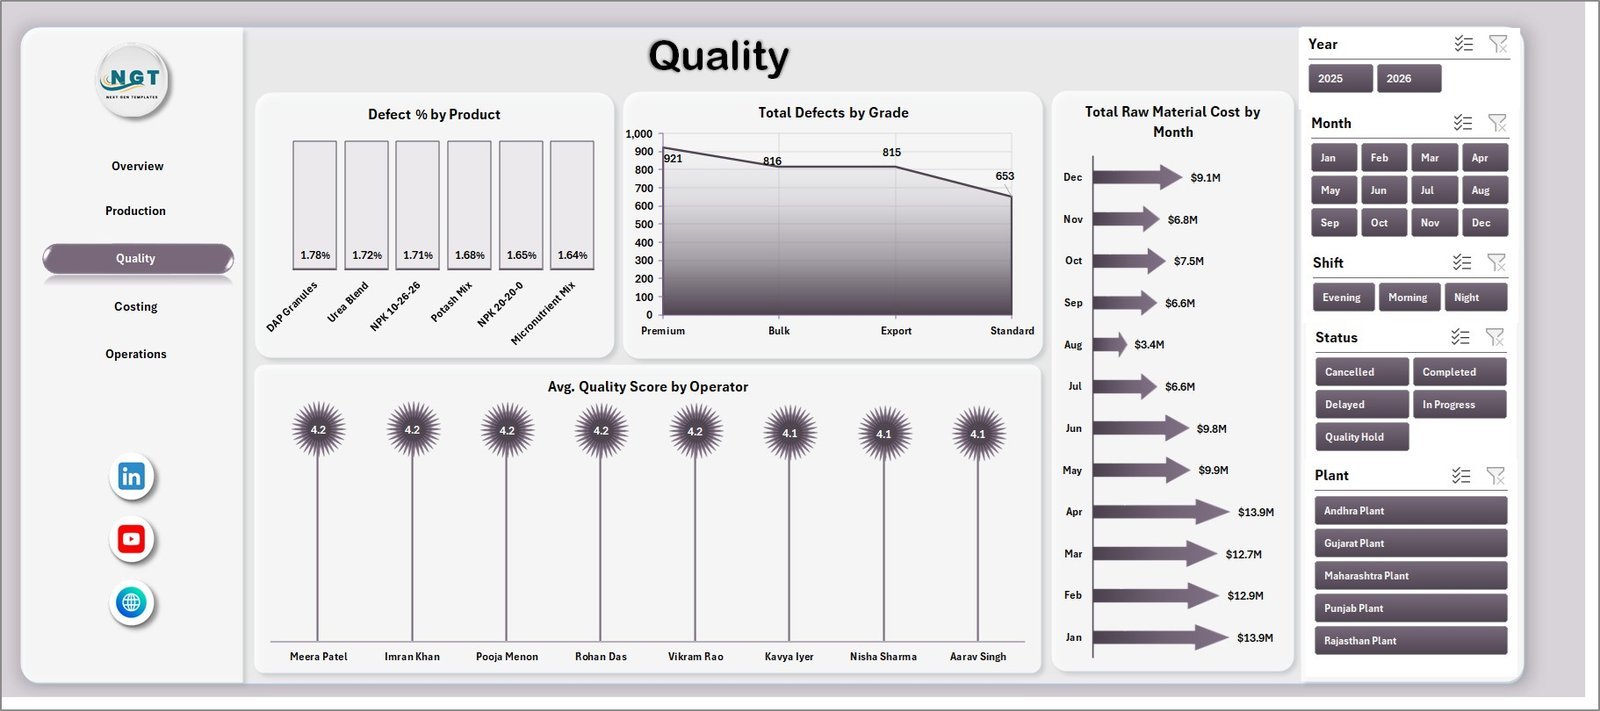
Quality Page
The Quality page monitors defect rate, grade-level issues, raw material cost trend, and operator-level quality performance. It includes Defect % by Product, Total Defects by Grade, Total Raw Material Cost by Month, and Avg. Quality Score by Operator.

Quality Page
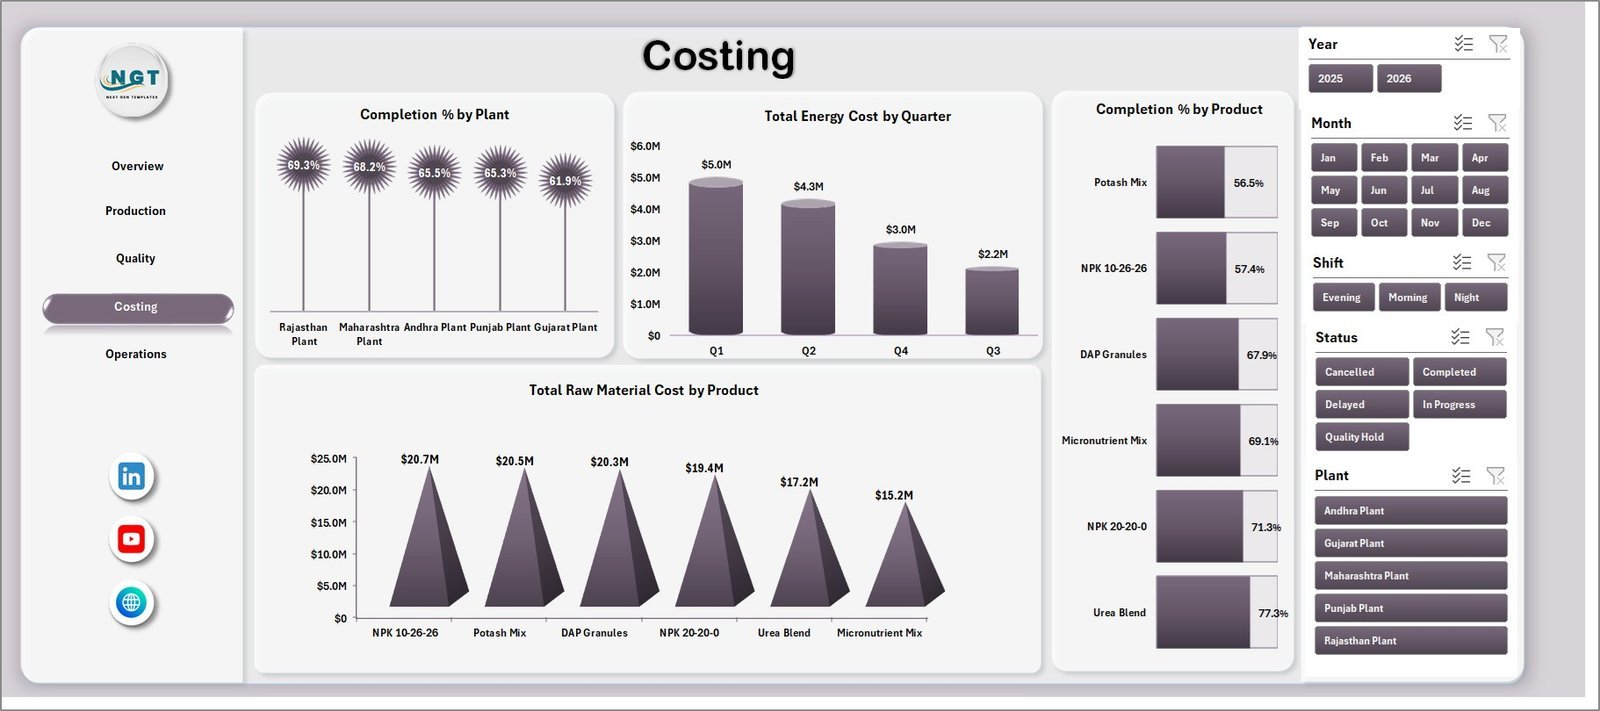
Costing Page
The Costing page combines completion, energy, product, and raw material cost views. It includes Completion % by Plant, Total Energy Cost by Quarter, Completion % by Product, and Total Raw Material Cost by Product.
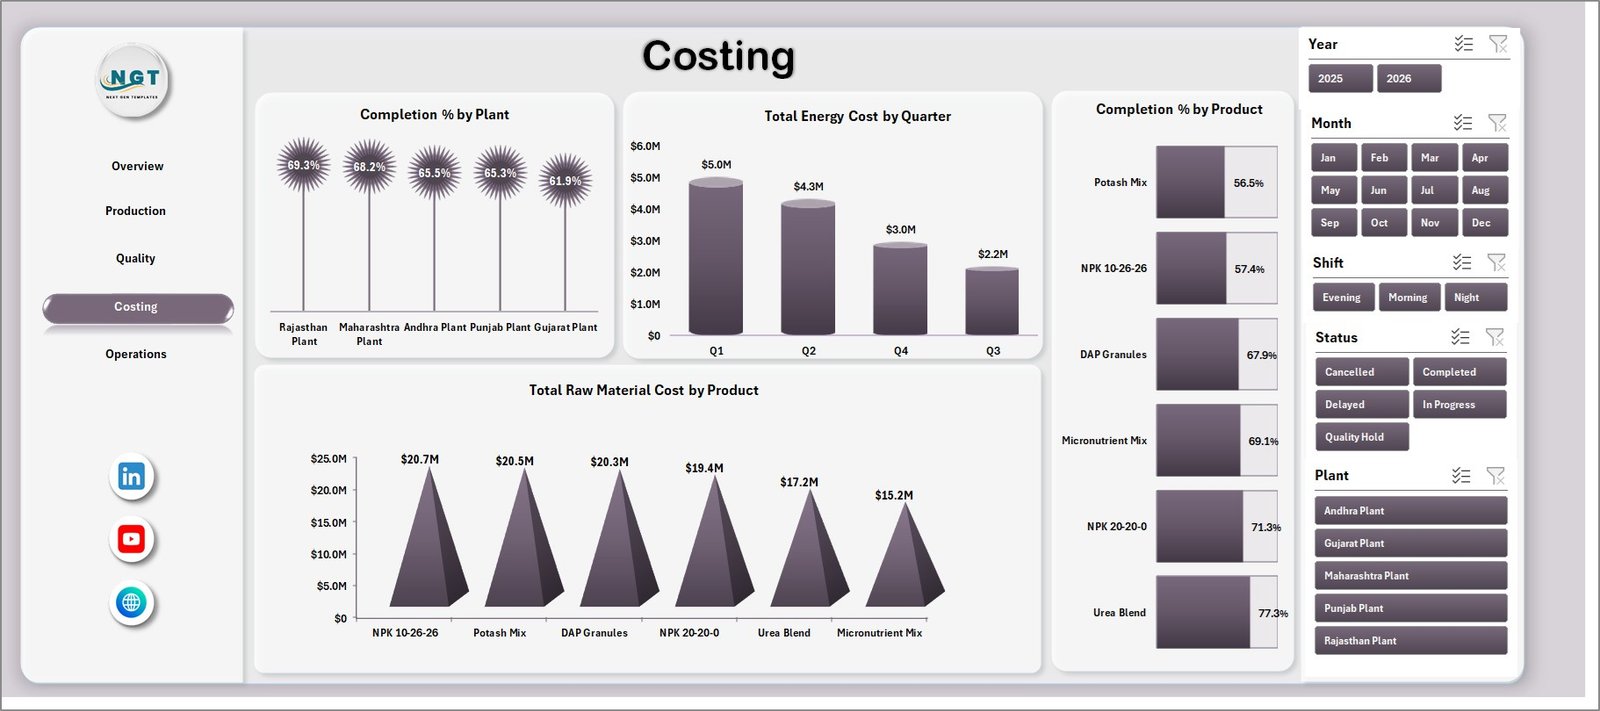
Costing Page
Operations Page
The Operations page supports daily and monthly review meetings with charts for Total Batches by Shift, Total Quantity Produced by Year, Total Raw Material Cost by Plant, and Avg. Downtime Hours by Production Line.

Operations Page
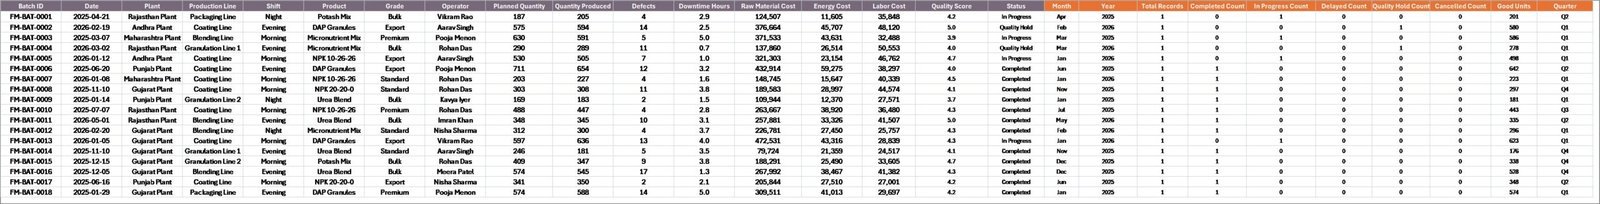
Data Sheet Tab
The Data sheet is where users add or paste fertilizer manufacturing records in the same column format. After updating this sheet, go to the Excel Ribbon, open the Data tab, and click Refresh All to update pivots, cards, and charts.

Data Sheet tab
Support Sheet Tab
The Support sheet contains the pivot tables used to power the dashboard dynamically. Users can keep this sheet hidden after setup, then refresh all pivots whenever new data is added.
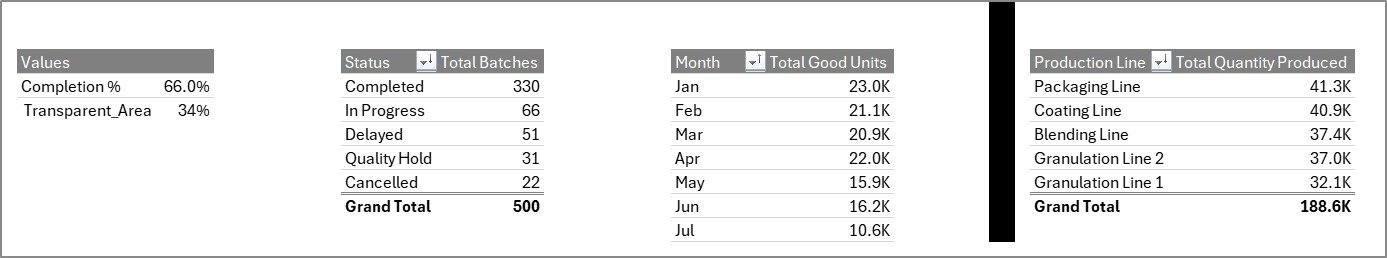
Support sheet tab
Fertilizer Manufacturing Dashboard in Excel vs. Google Sheets vs. Paid Manufacturing SaaS – Where This Fits
| Feature | This Excel Dashboard | Google Sheets Alternative | Paid MRP/SaaS |
|---|---|---|---|
| Cost | $17.99 one-time | Low one-time cost | $49-$199+ per user/month |
| Platform | Microsoft Excel | Browser-based Sheets | Cloud SaaS |
| Setup time | Under 10 minutes | Under 10 minutes | Days to weeks |
| Customizable fields | High | High | Usually limited by plan |
| Year-1 cost at 5 users | $17.99 total | Low one-time cost | $3,000-$12,000+ |
Who This Template Is For – and Who It’s Not For
This template is for fertilizer plant managers, production supervisors, quality teams, operations analysts, and finance teams that need an Excel-based reporting file for recurring manufacturing reviews.
It is not for plants needing live machine feeds, automated MRP scheduling, inventory netting, BOM explosion, or role-based ERP workflows. For those needs, a dedicated manufacturing system is a better fit.
How to Use the Fertilizer Manufacturing Dashboard in Excel
- Download and unzip the Excel dashboard file.
- Open the workbook in Microsoft Excel.
- Go to the Data sheet and replace the sample records with your own manufacturing data.
- Keep the same column structure so pivots and charts continue to work correctly.
- Use the Excel Ribbon Data tab and click Refresh All.
- Review the Overview, Production, Quality, Costing, and Operations pages with slicers.
- Hide the Support sheet if you want a cleaner user-facing workbook.
Real-World Use Cases
Anita, Plant Manager: reviews Total Quantity, Good Units, Defects, and Completion % every morning before the production meeting.
Rahul, Quality Lead: uses the Quality page to compare defects by product and grade, then discusses root causes with operators.
Meera, Cost Analyst: tracks raw material cost by product and energy cost by quarter to support monthly cost-control reviews.
Frequently Asked Questions
Does this dashboard work in Microsoft Excel?
Yes. The template is designed for Microsoft Excel and uses worksheets, charts, slicers, and pivot tables.
Can I replace the sample data?
Yes. Add your own records in the Data sheet using the same format, then refresh all pivots from the Data tab.
Can I hide the Support sheet?
Yes. The Support sheet contains pivot tables and can be hidden after setup if you do not want end users to edit it.
What pages are included?
The workbook includes Overview, Production, Quality, Costing, Operations, Data, and Support sheets.
Is this a full ERP or MRP system?
No. It is a reporting dashboard for analysis and review. It does not replace full scheduling, procurement, or inventory planning software.
Can I customize the dashboard?
Yes. Since it is an Excel file, experienced users can edit charts, fields, colors, and formulas as needed.
About the Author
Built by PK – Microsoft Certified Professional with 15+ years of Excel, Google Sheets, and Power BI experience. Founder of NextGenTemplates, reaching 300K+ subscribers across YouTube channels. Every template is hand-built and tested before release.
Explore Related Templates
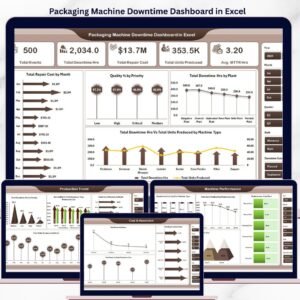
For a KPI-focused version, see the Fertilizer Manufacturing KPI Dashboard in Excel. You may also like the Packaging Machine Downtime Dashboard in Excel, Contract Manufacturing Dashboard in Google Sheets, and the Excel Dashboard templates category. Browse more Manufacturing templates for production and operations reporting.
Download the Fertilizer Manufacturing Dashboard in Excel today and turn your production records into clear manufacturing insights.
Last updated: June 11, 2026.


Reviews
There are no reviews yet.