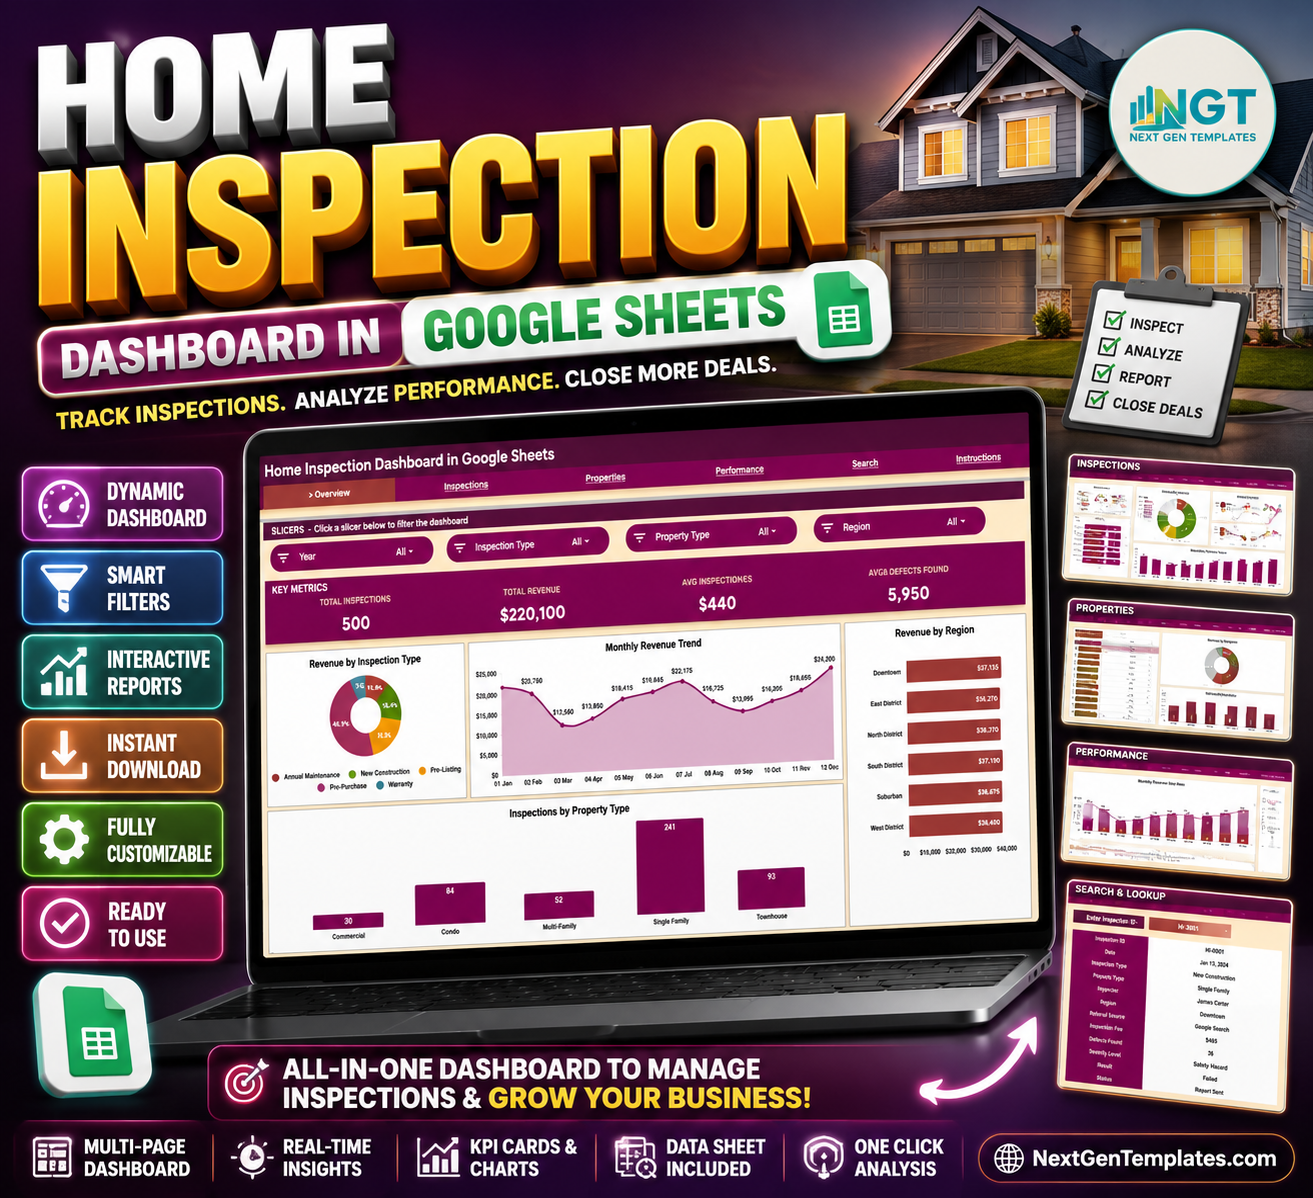


The Home Inspection Dashboard in Google Sheets tracks 4 headline KPIs and 15 interactive charts across 4 analysis pages, plus a dropdown-driven Search tab and a structured Data tab. Setup takes under 10 minutes — replace the sample inspection records with your own and every chart, slicer, and KPI updates automatically.
🌍 Join 8,400+ teams in 40+ countries using NextGenTemplates to replace paid SaaS tools with one-time-purchase Excel, Google Sheets, Power BI, and HTML templates.
✅ Instant download · One-time payment · No subscription · No per-user fees · Lifetime access
🔑 Key Features of the Home Inspection Dashboard in Google Sheets
This Google Sheets dashboard is built specifically for home inspectors, inspection firms, and property service teams who want to see revenue, inspection volume, and defect trends in one place without juggling spreadsheets.
- 🔹 4 headline KPI cards – Total Inspections, Total Revenue, Average Inspection Fee, and Total Defects Found sit at the top of the Overview page for instant high-level reporting.
- 🔹 15 pre-built charts – Revenue and inspection analysis split across Overview, Inspections, Properties, and Performance pages, covering inspection type, property type, region, inspector, referral source, and result.
- 🔹 Slicer-based filtering – Click slicers at the top of the Overview page to filter the entire dashboard by inspection type, region, or property type in one click.
- 🔹 Searchable inspection lookup – Pick any Inspection ID from a dropdown on the Search tab and pull the complete record: date, inspector, fee, defects, severity, and result.
- 🔹 Single structured Data tab – Add new inspections row by row in the same format and the whole dashboard refreshes — no formula rebuilding.
📦 What’s Inside the Home Inspection Dashboard in Google Sheets
The template is organized into six working tabs: four analysis pages, a Search tab, and a Data tab. Each page is described below.
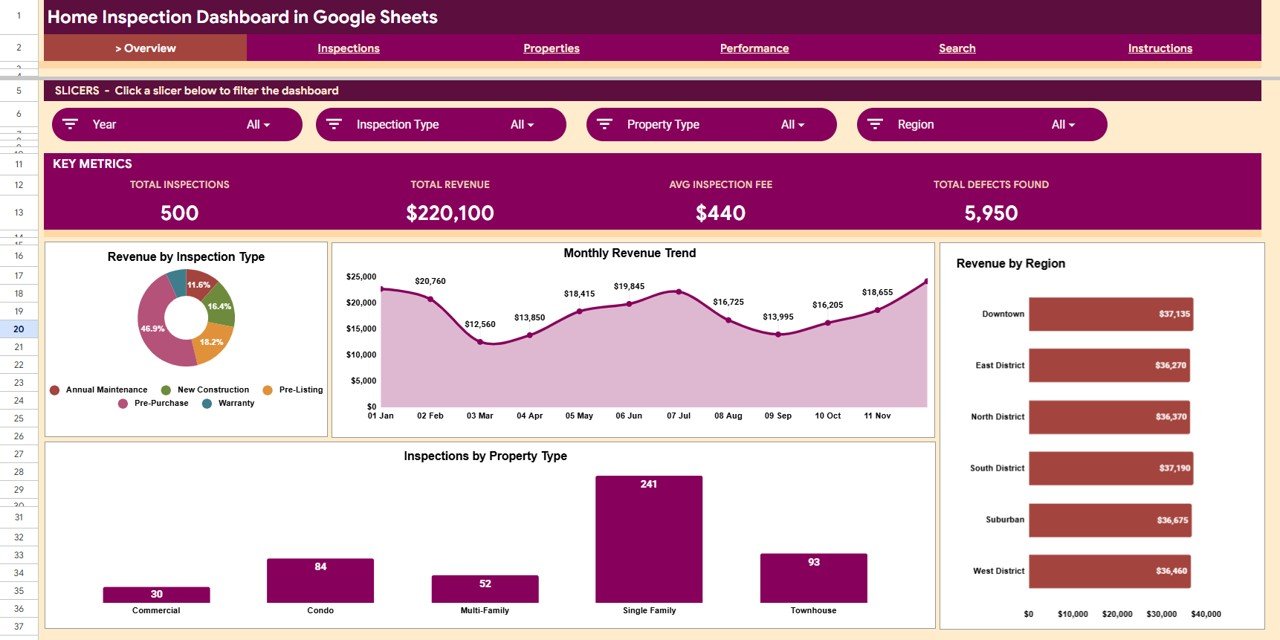
Overview Page
The Overview page opens with four KPI cards — Total Inspections, Total Revenue, Average Inspection Fee, and Total Defects Found — followed by charts for Revenue by Inspection Type, Revenue by Month, Revenue by Region, and Inspections by Property Type. Slicers at the top filter the whole page in one click.
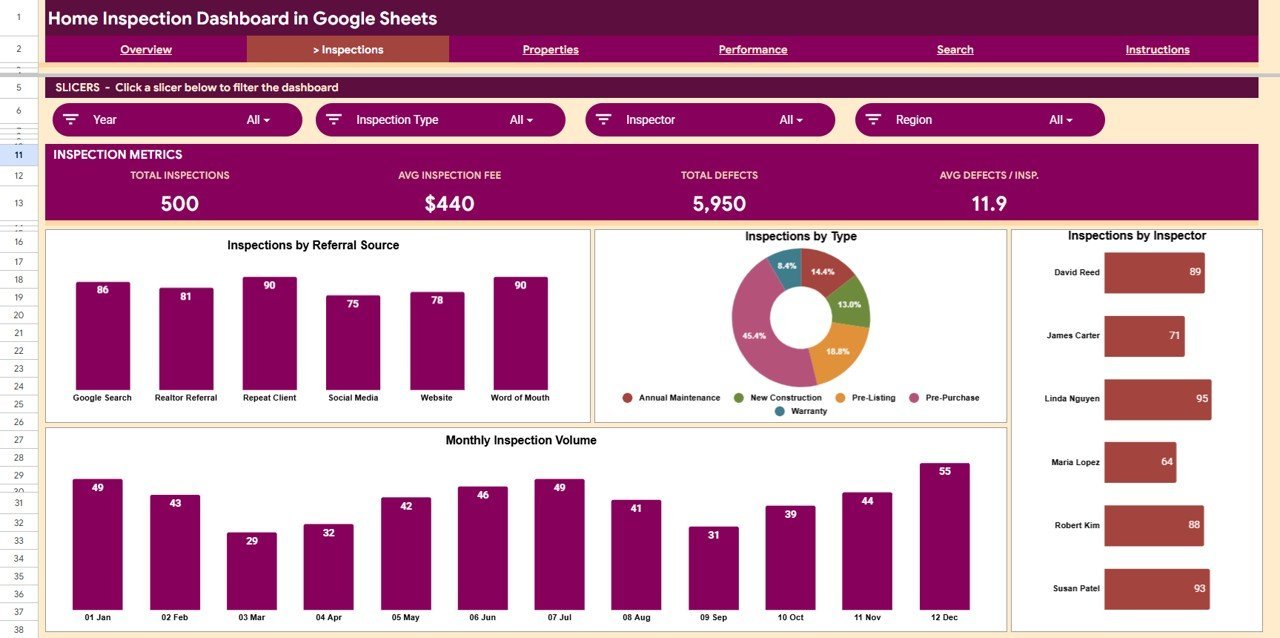
Inspections Page
This page breaks down inspection activity by source and resource. Charts include Inspections by Referral Source, Inspections by Inspection Type, Inspections by Inspector, and Inspection Volume by Month — useful for spotting which lead channels and inspectors carry the workload.

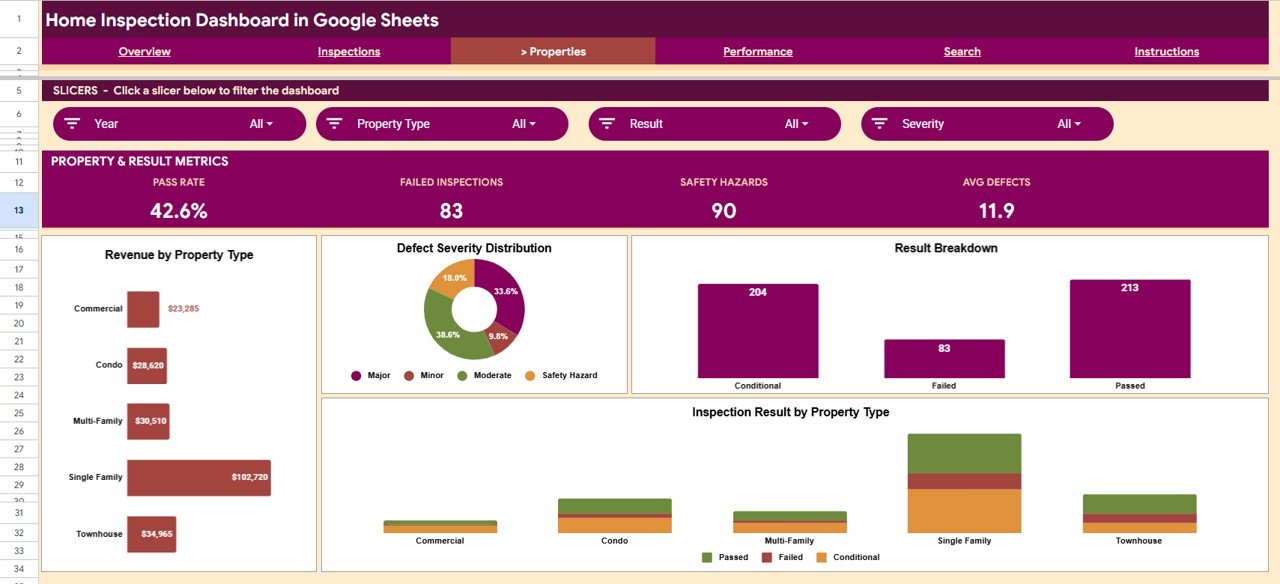
Properties Page
The Properties page focuses on property mix and inspection outcomes. Charts include Revenue by Property Type, Defects by Severity Level, Inspections by Result, and Inspection Result by Property Type, so you can see where defects and pass/fail rates concentrate.
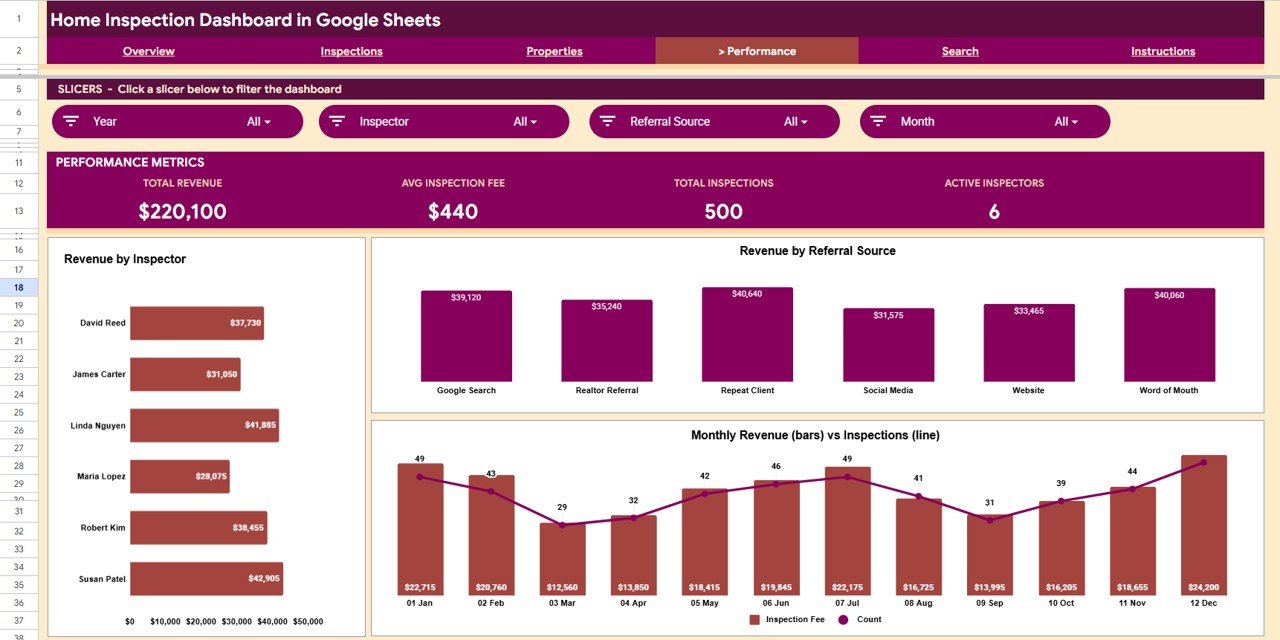
Performance Page
This page measures revenue performance across inspectors, referral sources, and time. Charts include Revenue by Inspector, Revenue by Referral Source, and a combined Revenue and Inspections by Month view to track output against earnings.
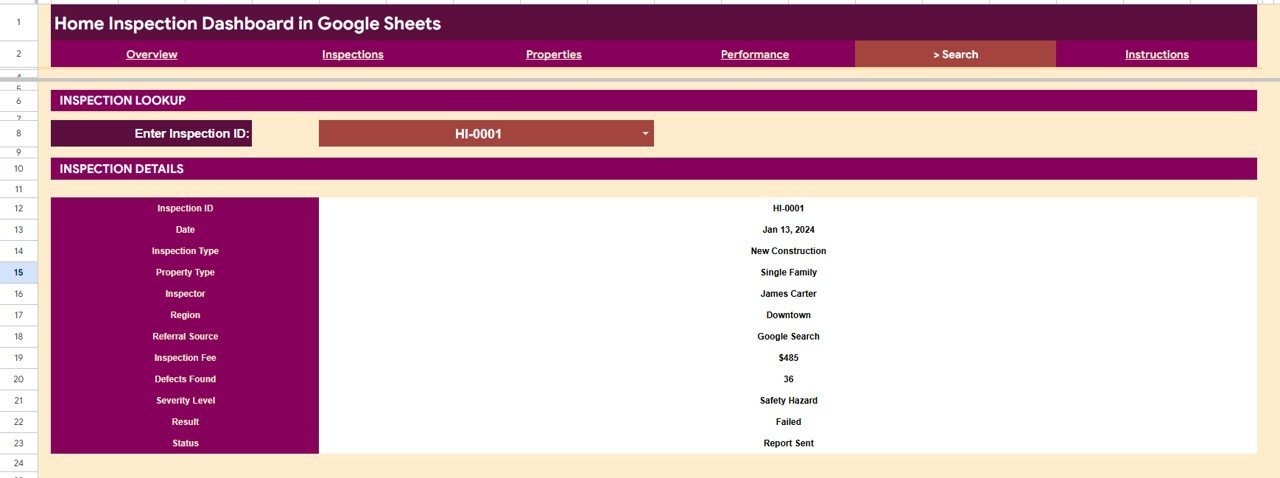
Search Sheet
Select any Inspection ID from the dropdown and the Search tab returns the full record: Date, Inspection Type, Property Type, Inspector, Region, Referral Source, Inspection Fee, Defects Found, Severity Level, Result, and Status — a single-screen lookup for any past inspection.

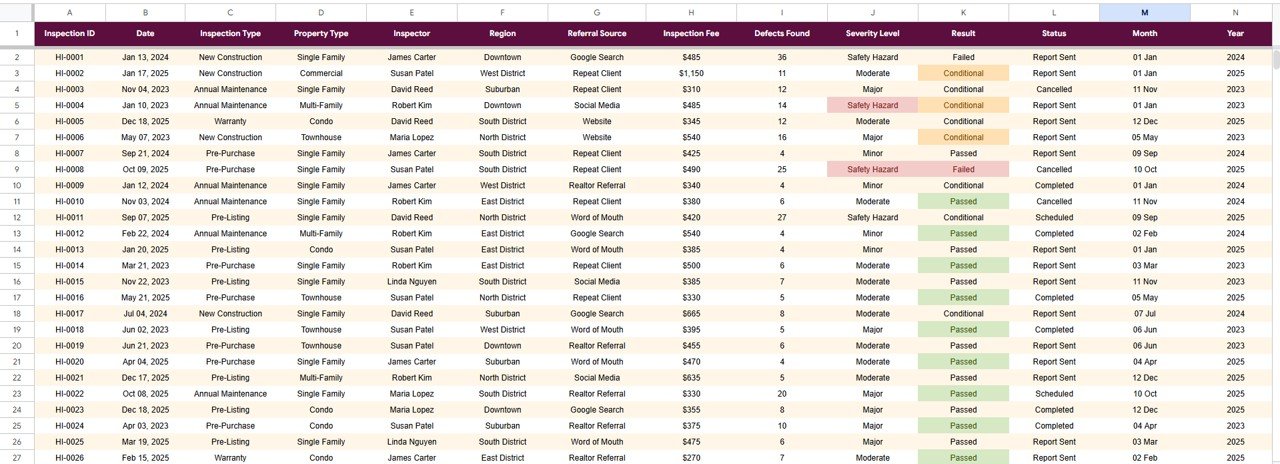
Data Sheet
The Data tab is where every inspection record lives. Add new rows in the same column format and the Overview, Inspections, Properties, and Performance pages all update automatically — no need to touch any formulas or chart ranges.
📊 Home Inspection Dashboard in Google Sheets vs. Excel vs. Paid Inspection Software — Where This Fits
| Feature | Home Inspection Dashboard (Google Sheets) | Microsoft Excel Dashboard | Spectora / HomeGauge / ISN |
|---|---|---|---|
| Cost | $9.99 one-time | $17.99 one-time | $49–$99 / month |
| Platform | ✅ Browser, any device, Google Drive | Desktop Excel | Cloud SaaS |
| Setup time | ✅ Under 10 minutes | Under 10 minutes | Hours of onboarding |
| Real-time team collaboration | ✅ Built-in (Google Sheets sharing) | Limited | ✅ Yes |
| Mobile access | ✅ Google Sheets app | Limited | ✅ Yes |
| Customizable fields & charts | ✅ Fully editable | ✅ Fully editable | ❌ Vendor-locked |
| Share with a link | ✅ Yes | File send only | ✅ Yes |
| Year-1 cost at 5 users | ✅ $9.99 total | $17.99 total | $2,940–$5,940 |
For inspectors who want clear revenue and defect analytics without paying monthly per-seat fees, the Home Inspection Dashboard in Google Sheets sits in the sweet spot.
👥 Who This Template Is For — and Who It’s Not For
✅ This template is built for:
- Independent home inspectors tracking inspections, fees, and defects across multiple regions
- Small inspection firms (2–15 inspectors) that want shared, real-time reporting in Google Drive
- Property service businesses that bill per inspection and need to see revenue by type, inspector, and referral source
❌ This template is NOT for:
- Inspectors who need on-site report generation with photos and signature capture — that’s a dedicated inspection-software job
- Large franchises needing role-based permissions, audit logs, and automated client portals
⚙️ How to Use the Home Inspection Dashboard in Google Sheets
- Open the PDF in your download and click the Google Sheets copy link to create your own editable copy in Google Drive.
- Go to the Data tab and replace the sample inspection records with your own, keeping the same column format.
- Open the Overview page — KPI cards and charts refresh automatically from your data.
- Use the slicers to filter by inspection type, region, or property type.
- Use the Search tab dropdown to pull the full record for any Inspection ID.
💼 Real-World Use Cases
Dave runs a solo home inspection business across three counties. He uses the Home Inspection Dashboard in Google Sheets to track monthly revenue by region and see which property types generate the most defects — replacing a $79/month inspection platform he barely used for reporting.
Maria manages four inspectors at a regional firm. She shares the dashboard via a Google Drive link so the whole team sees Revenue by Inspector and Inspections by Referral Source, helping her decide where to spend on lead generation.
❓ Frequently Asked Questions
What KPIs does the Home Inspection Dashboard in Google Sheets track?
The Home Inspection Dashboard in Google Sheets tracks four headline KPIs — Total Inspections, Total Revenue, Average Inspection Fee, and Total Defects Found — plus 15 charts covering inspection type, property type, region, inspector, referral source, and severity level.
How long does setup take?
Setup takes under 10 minutes. Make a copy of the Home Inspection Dashboard in Google Sheets, paste your inspection records into the Data tab in the existing format, and every KPI card, chart, and slicer updates automatically.
How does this compare to Spectora or HomeGauge?
Spectora and HomeGauge are full inspection-software platforms billed monthly per user. The Home Inspection Dashboard in Google Sheets is a one-time $9.99 reporting layer — it won’t generate on-site reports, but it gives you revenue and defect analytics without subscriptions.
Can multiple inspectors use it at once?
Yes. Because it runs in Google Sheets, you can share the Home Inspection Dashboard with your team via a Drive link and everyone sees the same live data, charts, and KPIs on any device.
Do I need to rebuild formulas when I add new inspections?
No. Add new rows to the Data tab in the same format and the charts and KPIs expand automatically. You never need to edit formulas or chart ranges in the Home Inspection Dashboard in Google Sheets.
👤 About the Author
Built by PK — Microsoft Certified Professional with 15+ years of Excel, Google Sheets, and Power BI experience. Founder of NextGenTemplates, reaching 300K+ subscribers across YouTube channels (@PK-AnExcelExpert, @NextGenTemplates, @NeoTechNavigators). Every template is hand-built and tested before release.
🔗 Explore Related Templates
Also available on other platforms — pick the tool your team already uses:
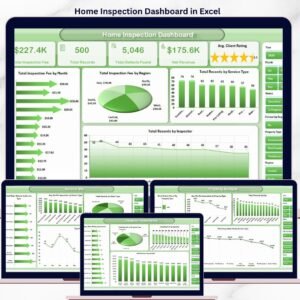
- Home Inspection Dashboard in Excel — the same analysis in Microsoft Excel.
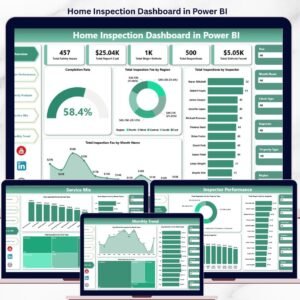
- Home Inspection Dashboard in Power BI — interactive Power BI version.
Related Google Sheets dashboards for property and service businesses:
- Property Management Dashboard in Google Sheets
- Real Estate Property Tracker in Google Sheets
- HVAC Service Dashboard in Google Sheets
📖 Click here to read the Detailed Blog Post<
Watch the step-by-step video tutorial:
/h3>
🎥 Visit our YouTube channel for step-by-step video tutorials
👉 YouTube.com/@NextGenTemplates


Reviews
There are no reviews yet.