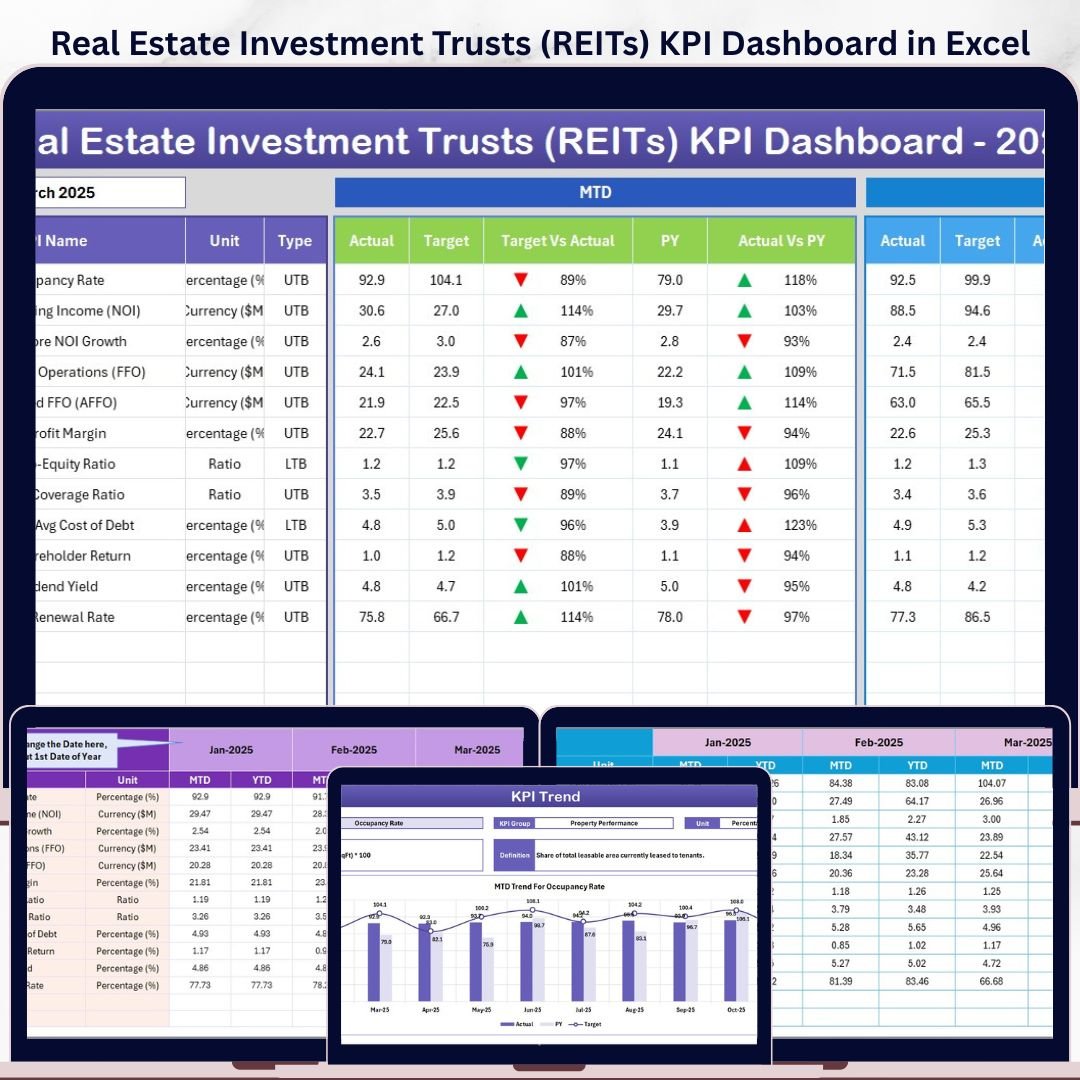


The Real Estate Investment Trusts (REITs) KPI Dashboard in Excel gives REIT analysts, fund managers, and real estate finance teams a 7-sheet KPI system for tracking MTD and YTD performance against targets and previous-year results. In one workbook, you can review actuals, targets, prior-year benchmarks, variance arrows, KPI definitions, and trend charts without building formulas from scratch. Setup takes under 10 minutes: replace the sample numbers, select a month from the dashboard, and the reporting view updates instantly.
Join 8,400+ teams in 40+ countries using NextGenTemplates to replace recurring dashboard software with one-time-purchase Excel, Google Sheets, Power BI, and HTML templates.
Instant download. One-time payment. No subscription. Lifetime access.
Key Features of Real Estate Investment Trusts (REITs) KPI Dashboard in Excel
- 7 connected Excel worksheets for Home, Dashboard, KPI Trend, Actual Numbers, Target Numbers, Previous Year Numbers, and KPI Definition.
- MTD and YTD performance tracking so you can monitor short-term monthly movement and year-to-date portfolio performance in the same view.
- Actual vs Target and Previous Year comparisons with visual up/down indicators that help decision-makers spot performance gaps quickly.
- Month selector on the Dashboard sheet to refresh the entire KPI view for the selected reporting month.
- KPI Trend sheet with dropdown selection for a single KPI, including group, unit, formula, definition, and trend charts.
- Dedicated input sheets for Actual, Target, and Previous Year values, keeping raw entry separate from presentation tabs.
- Editable KPI dictionary where you define KPI names, groups, formulas, units, and whether each metric is Lower the Better or Upper the Better.
What Is Inside the Real Estate Investment Trusts (REITs) KPI Dashboard in Excel
1. Home Sheet
The Home sheet is the workbook index. It includes six navigation buttons so users can jump directly to the Dashboard, KPI Trend, input, and definition sheets without searching through workbook tabs.
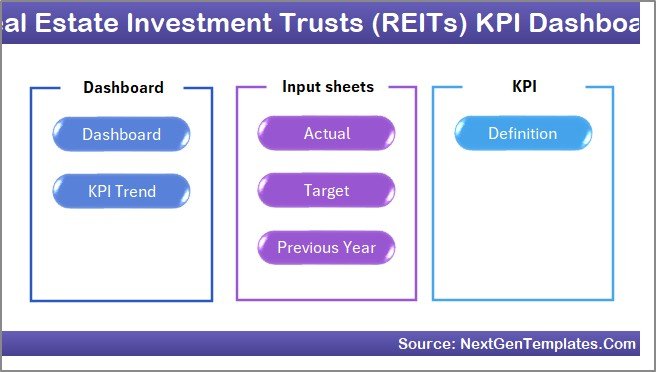
Home Page
2. Dashboard Sheet
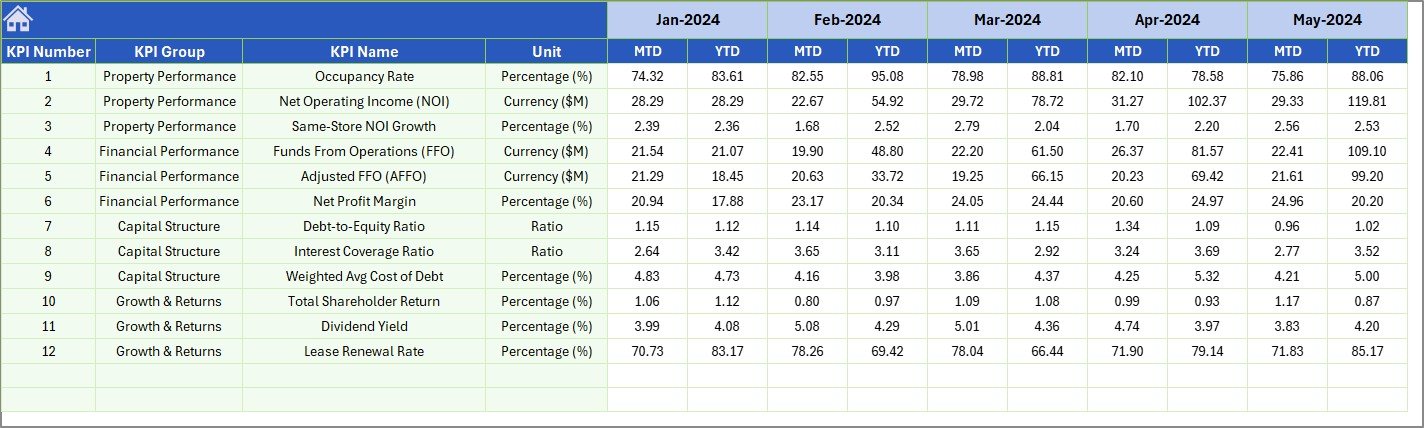
The Dashboard sheet is the main reporting page. Select the month in cell D3 and the full dashboard updates for that reporting period. It displays MTD Actual, Target, and Previous Year values, plus Target vs Actual and PY vs Actual comparisons with conditional-formatting arrows. The same structure is repeated for YTD numbers, giving one place to review short-term and cumulative REIT performance.
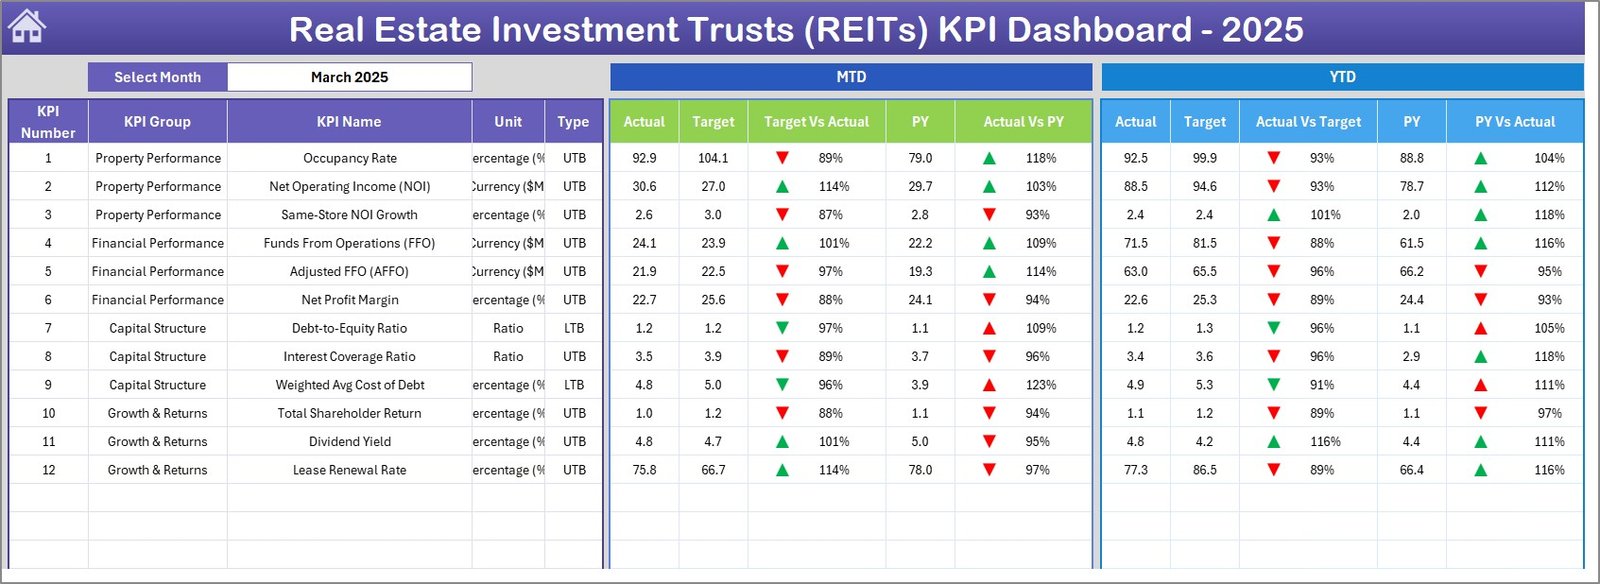
Real Estate Investment Trusts (REITs) KPI Dashboard
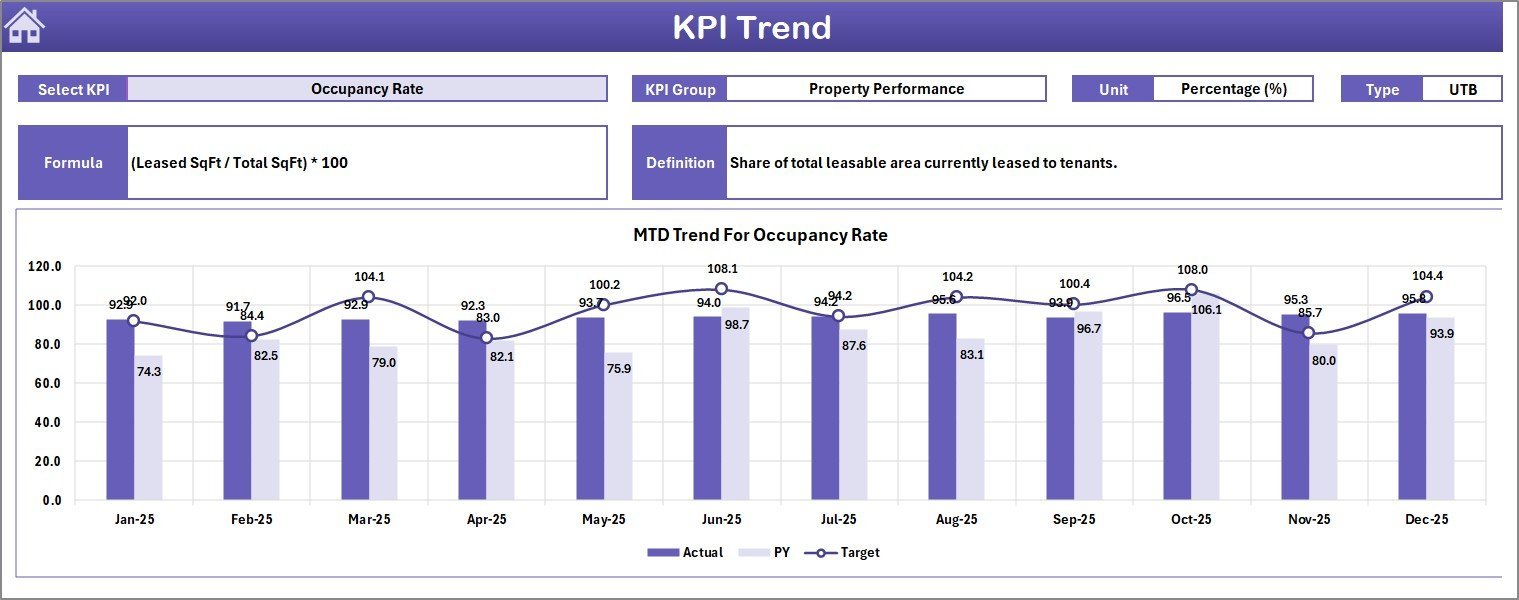
3. KPI Trend Sheet
The KPI Trend sheet helps you drill into one KPI at a time. Select the KPI name from the dropdown in cell C3 and the sheet displays the KPI group, unit, type, formula, and definition, along with MTD and YTD trend charts for Actual, Target, and Previous Year values.
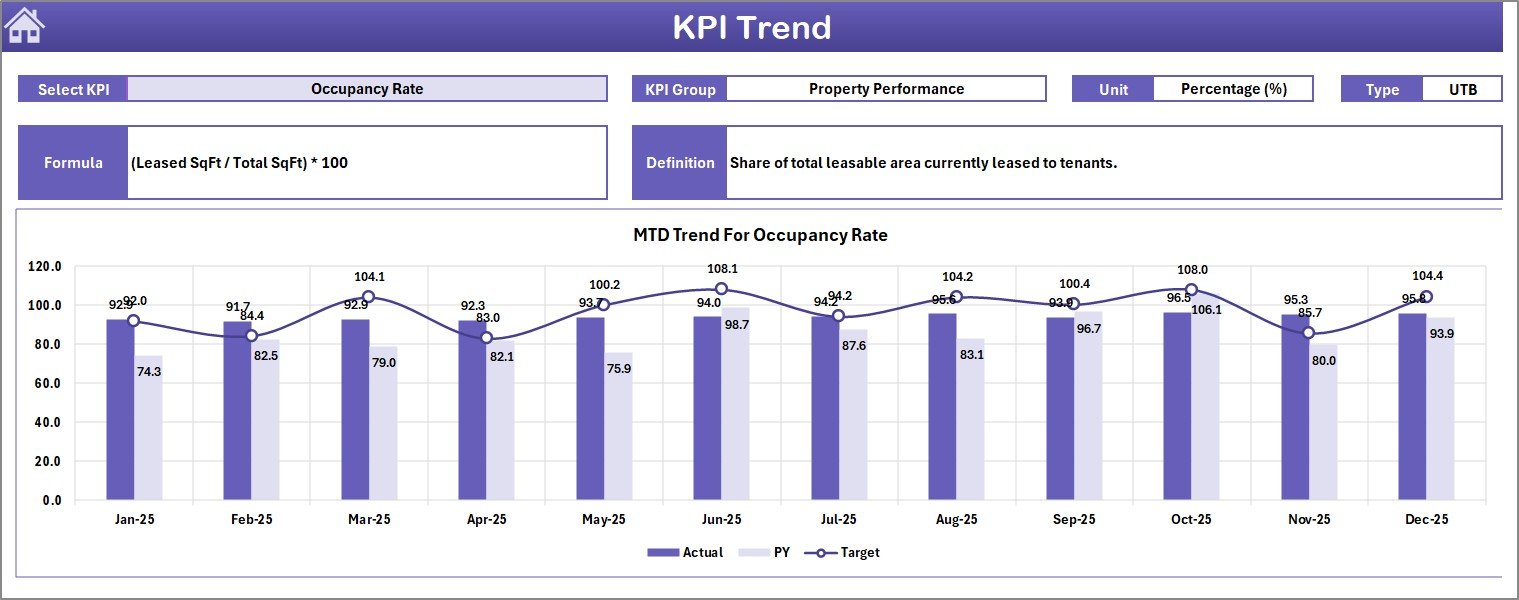
KPI Trend Sheet
4. Actual Numbers Input Sheet
Use the Actual Numbers Input sheet to enter MTD and YTD actual values for each KPI by month. Change the starting month in cell E1 and the monthly structure follows the selected reporting year.
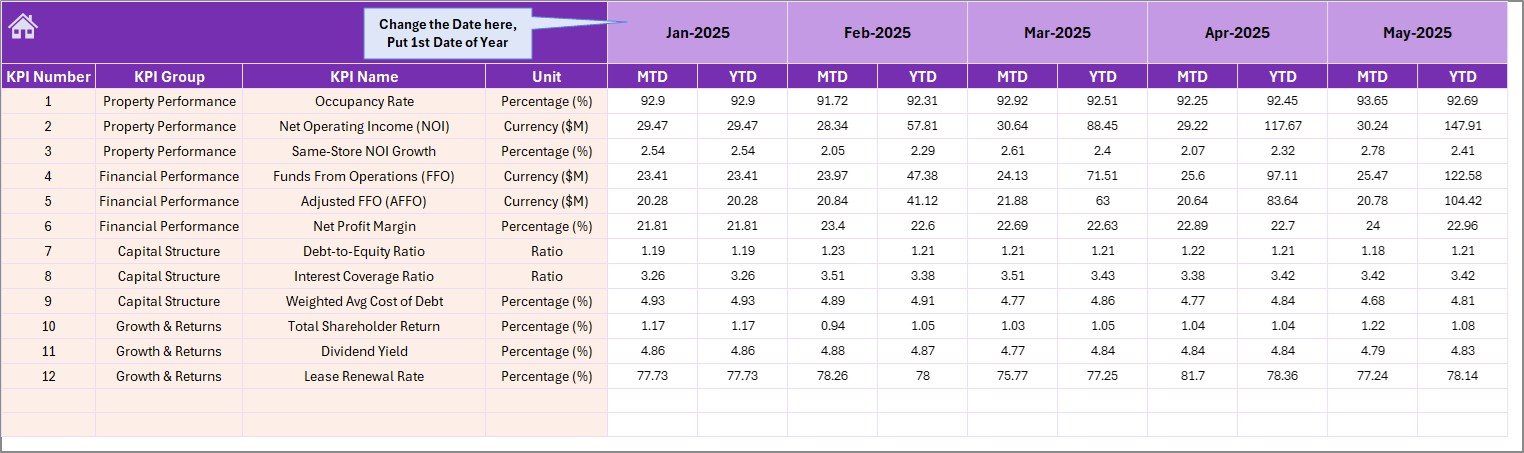
Actual Numbers Input sheet
5. Target Number Input Sheet
The Target Number Input sheet stores MTD and YTD target values for every REIT KPI. This makes the Dashboard sheet useful for board reporting, portfolio reviews, and monthly target tracking.
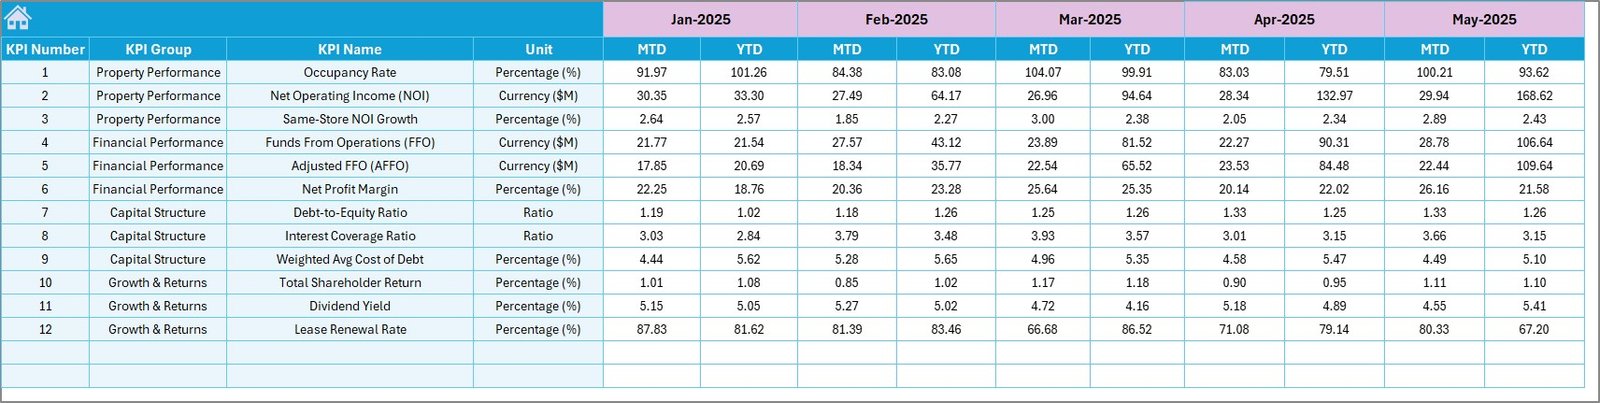
Target Number Input sheet
6. Previous Year Number Input Sheet
Enter previous-year MTD and YTD results in this sheet. The dashboard uses these figures for year-over-year comparison, helping analysts separate seasonal movement from true operating improvement.
Previous Year Number Input sheet
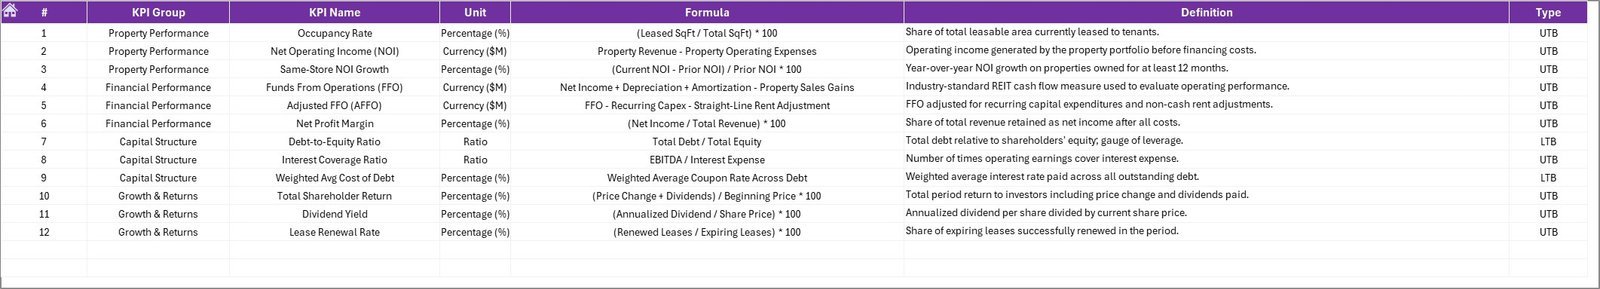
7. KPI Definition Sheet
The KPI Definition sheet is the reference library. Add each KPI name, group, unit, formula, and definition. In the final column, mark the KPI as LTB for Lower the Better or UTB for Upper the Better so performance logic stays consistent.
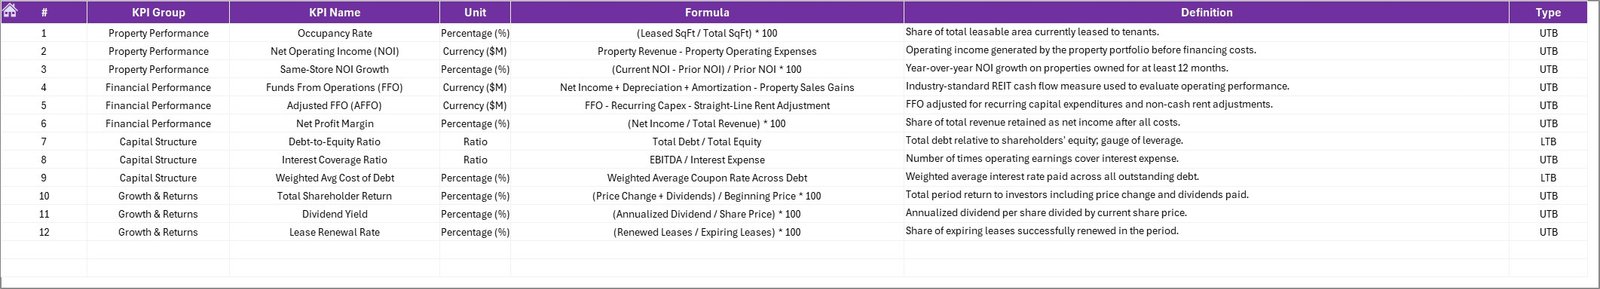
KPI Definition sheet
Real Estate Investment Trusts (REITs) KPI Dashboard in Excel vs. Google Sheets vs. Paid Real Estate SaaS – Where This Fits
| Feature | REITs KPI Dashboard in Excel | Google Sheets alternative | Paid real estate SaaS |
|---|---|---|---|
| Cost | $14.99 one-time | DIY build or paid template | Subscription or quote-based pricing |
| Platform | Microsoft Excel | Browser-based Google Sheets | Cloud platform |
| Setup time | Under 10 minutes | 30 minutes to several hours | Days to weeks |
| Offline access | Yes | Limited | No |
| MTD and YTD KPI reporting | Built in | Manual formulas required | Usually available after setup |
| Custom KPI definitions | Fully editable | Fully editable | Often admin-controlled |
| Year-1 cost at 5 users | $14.99 total | Build time plus template cost | Often hundreds or thousands per year |
Who This Template Is For – and Who It Is Not For
This template is built for:
- REIT analysts tracking monthly actuals, targets, and previous-year benchmarks.
- Fund managers preparing portfolio KPI reviews for internal leadership.
- Real estate finance teams monitoring NOI, FFO, occupancy, distribution, leverage, or custom REIT metrics.
- Consultants who need a repeatable KPI workbook for REIT and real estate investment clients.
This template is not for:
- Teams needing live API feeds from property management systems.
- Organizations requiring multi-entity consolidation with database-level permissions.
- Users looking for a CRM, investor portal, or accounting system.
How to Use the Real Estate Investment Trusts (REITs) KPI Dashboard in Excel
- Open the workbook in Microsoft Excel 2016 or later.
- Go to the KPI Definition sheet and confirm the KPI names, groups, formulas, and LTB/UTB settings.
- Enter your Actual, Target, and Previous Year values in their dedicated input sheets.
- Select the reporting month from the Dashboard sheet dropdown.
- Review MTD and YTD variance arrows, then use the KPI Trend sheet for single-KPI analysis.
Real-World Use Cases
Maria, REIT portfolio analyst: Maria uses the dashboard before monthly investment committee meetings to compare FFO, NOI margin, occupancy, and distribution coverage against targets and previous-year results.
Dev, real estate fund manager: Dev tracks YTD trend movement across income, debt, and occupancy KPIs so leadership can see whether underperformance is temporary or structural.
Priya, consulting finance lead: Priya adapts the KPI Definition sheet for each REIT client, then uses the same dashboard structure to deliver standardized monthly performance packs.
Frequently Asked Questions
What does this REITs KPI Dashboard track?
It tracks any REIT KPI you define, including MTD Actual, Target, Previous Year, Target vs Actual, PY vs Actual, and the same comparisons for YTD reporting.
Can I add my own REIT KPIs?
Yes. Add KPI names, groups, units, formulas, and definitions in the KPI Definition sheet, then enter monthly values in the input sheets.
Does this workbook use VBA or macros?
No special macro workflow is required. The dashboard is designed for normal Excel users who want a structured KPI reporting workbook.
Which Excel versions are supported?
The workbook is best used in Microsoft Excel 2016, 2019, 2021, Microsoft 365, or later on Windows or Mac.
Can this be used for non-REIT real estate portfolios?
Yes. Because KPI names and formulas are editable, the workbook can be adapted for property funds, asset managers, and real estate investment portfolios.
Is this a one-time purchase?
Yes. The template is sold as a one-time download with no subscription or per-user fee.
About the Author
Built by PK – Microsoft Certified Professional with 15+ years of Excel, Google Sheets, and Power BI experience. Founder of NextGenTemplates, reaching 300K+ subscribers across YouTube channels. Every template is hand-built and tested before release.
Explore Related Templates
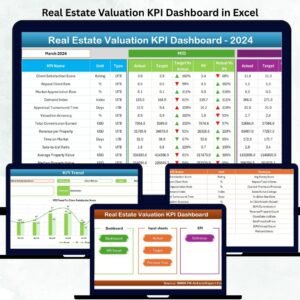
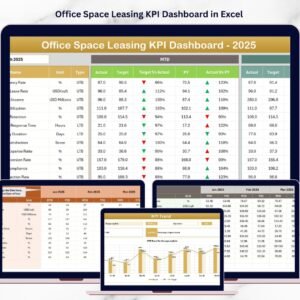
For broader REIT portfolio analysis, see the Real Estate Investment Trusts (REITs) Dashboard in Excel. For property valuation metrics, use the Real Estate Valuation KPI Dashboard in Excel. For commercial leasing analytics, explore the Office Space Leasing KPI Dashboard in Excel. For rental portfolio reporting, pair it with the Rental Property Investment Dashboard in Excel.
Browse more Excel KPI Dashboard Templates and Microsoft Excel Templates on NextGenTemplates.
Get the Real Estate Investment Trusts (REITs) KPI Dashboard in Excel today and start tracking REIT performance with a structured monthly KPI system.
Last updated: May 18, 2026


Reviews
There are no reviews yet.