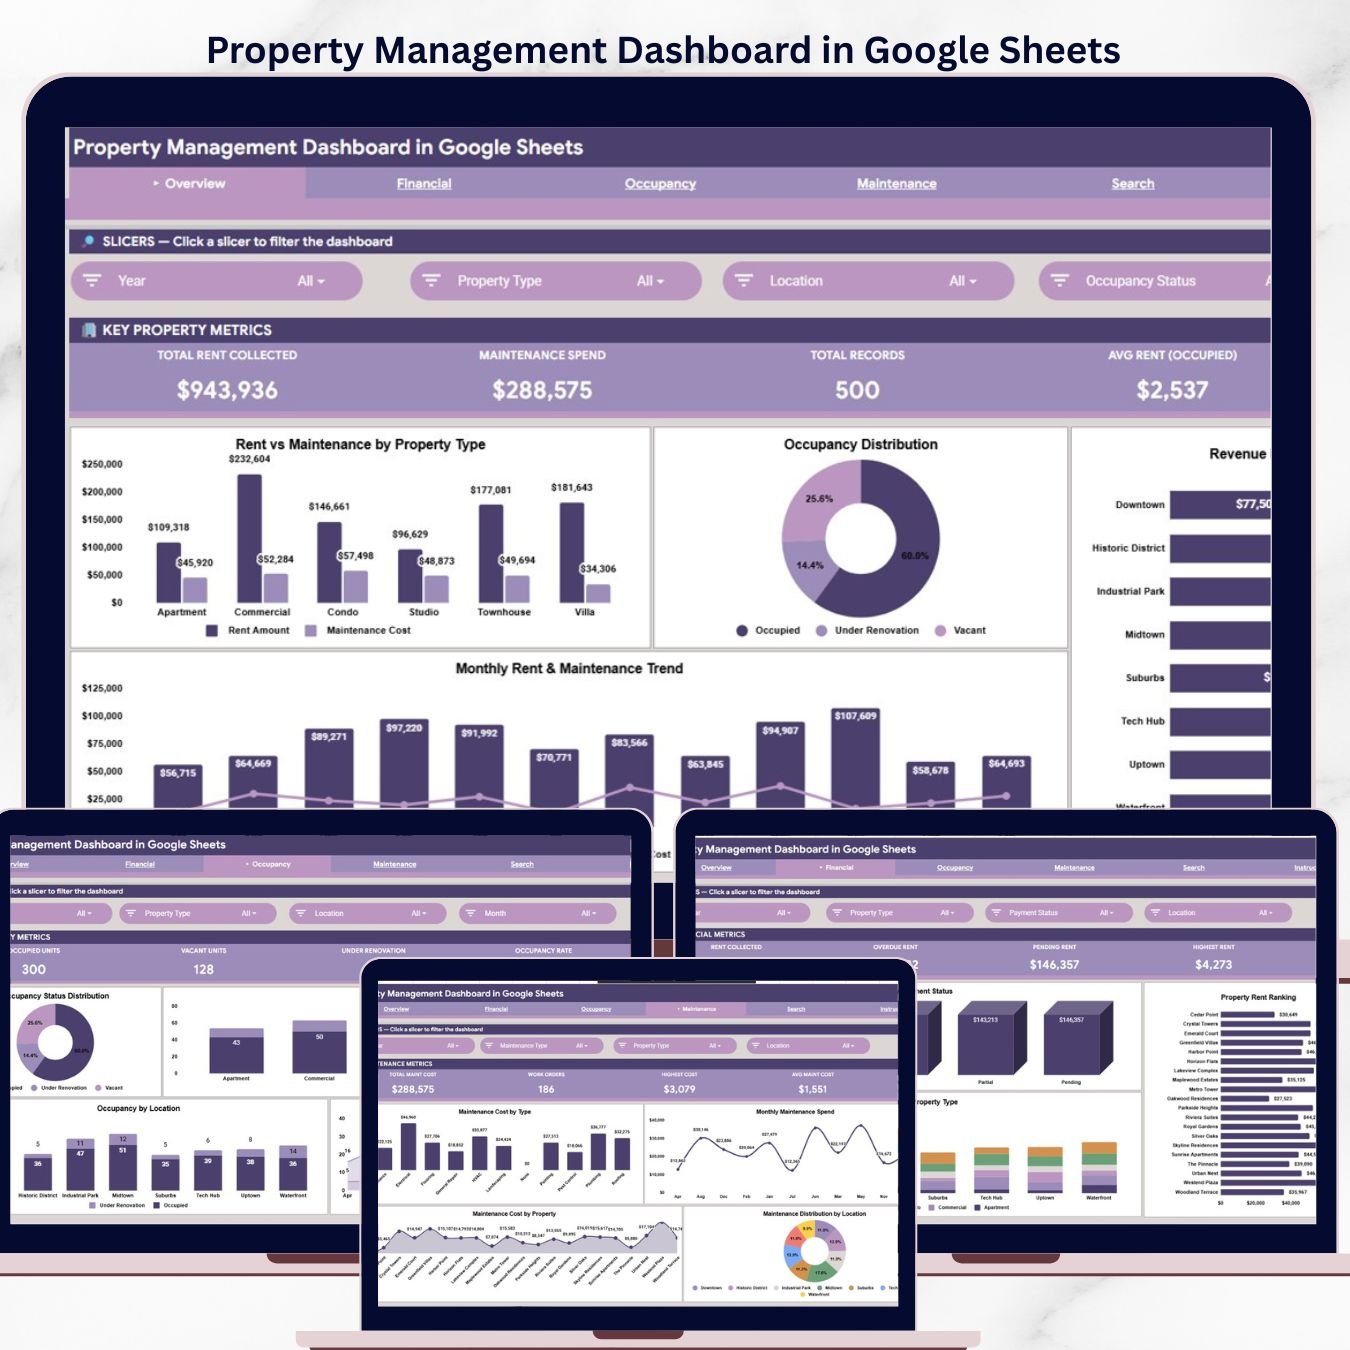
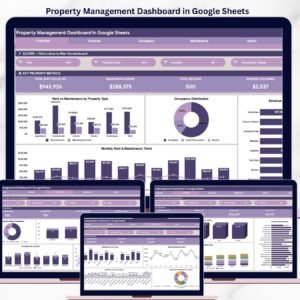
The Property Management Dashboard in Google Sheets tracks 4 KPIs across 6 interactive pages, with multiple pre-built charts covering rent collection, occupancy analysis, maintenance tracking, and financial breakdowns, plus a record lookup Search Sheet. Setup takes under 10 minutes — open the PDF guide, click the Google Sheets copy link, paste your property data into the Data Sheet, and every card, chart, and slicer updates automatically.
🌍 Join 8,400+ teams in 40+ countries using NextGenTemplates to replace paid SaaS tools with one-time-purchase Excel, Google Sheets, Power BI, and HTML templates.
✅ Instant download · One-time payment · No subscription · No per-user fees · Lifetime access
🔑 Key Features of Property Management Dashboard in Google Sheets
🏠 4 KPI Cards on the Overview Page — Total Rent Collected, Maintenance Spend, Total Records, and Avg Rent (Occupied) give property managers instant visibility into portfolio health. These four metrics are the same headline indicators used in monthly landlord reporting and property performance reviews across residential and commercial portfolios.
📊 Multiple Charts Across 6 Analysis Pages covering Overview, Financial Analysis, Occupancy Analysis, Maintenance Analysis, Search Sheet, and Data Sheet. Each chart is formula-driven and updates the moment you add or modify records in the Data Sheet — no manual chart editing required.
🔍 Multiple Slicers for Fast Filtered Views let you drill from a portfolio-wide view down to a single property type, location, or occupancy status in two clicks. Built for landlords, property managers, and operations teams who need different slices of the same property dataset without rebuilding a report.
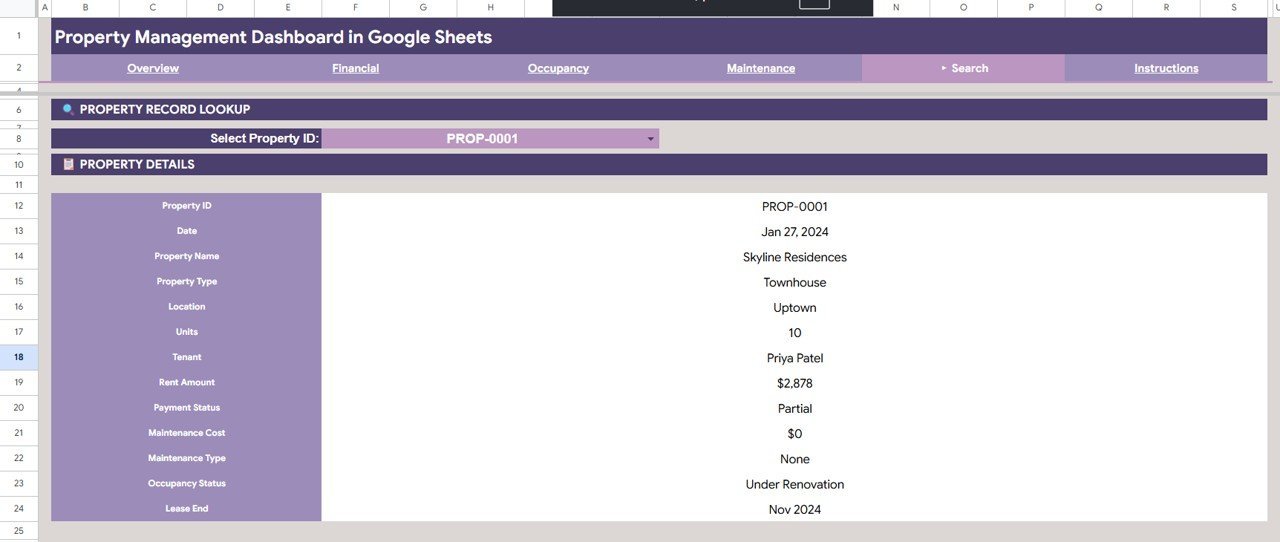
📋 Record Lookup (Search Sheet) — select any Property ID from the dropdown and instantly pull every detail for that property, including Property Name, Property Type, Location, Units, Tenant, Rent Amount, Payment Status, Maintenance Cost, Maintenance Type, Occupancy Status, and Lease End date. Eliminates the need to scroll through hundreds of rows manually.
🖼️ Built Entirely in Google Sheets — no add-ons, no macros, no monthly fees. Opens in any browser with a Google account, shareable via link, and editable by multiple team members simultaneously. If you manage rental properties and need organized data alongside lease-tracking, check out the Rental Property Investment Dashboard in Google Sheets for a complementary investment-focused view of your portfolio.
📦 What’s Inside the Property Management Dashboard in Google Sheets
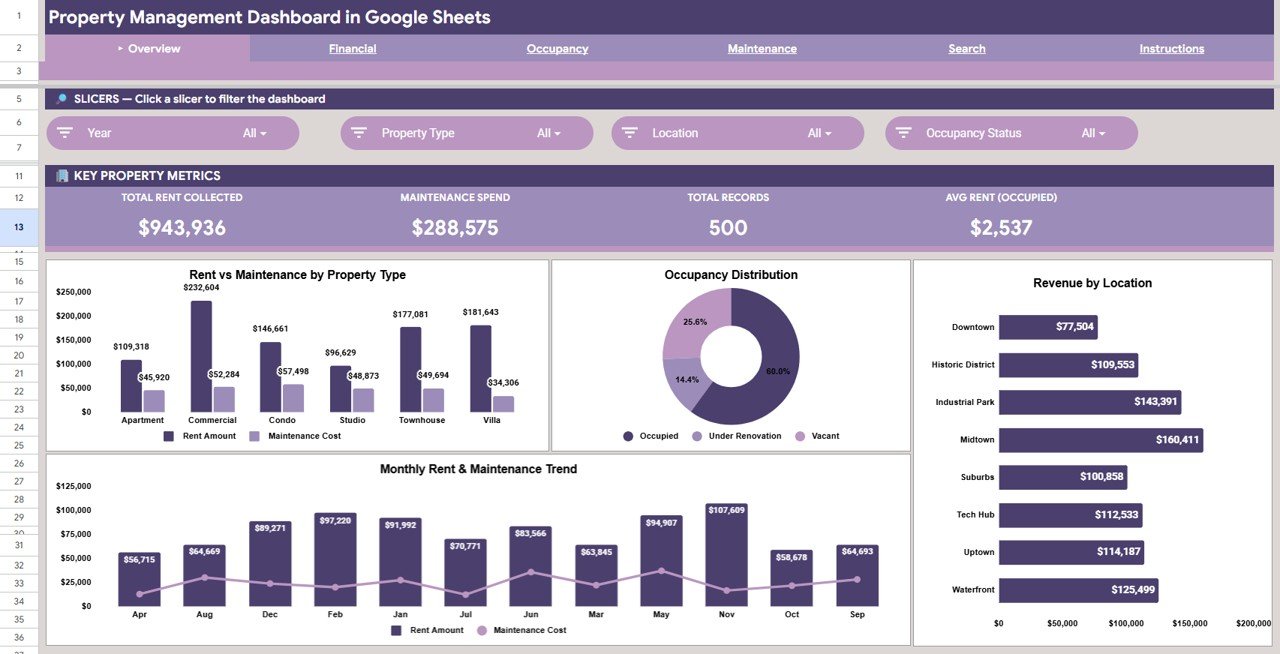
📈 1 — Overview Page. 4 KPI cards (Total Rent Collected, Maintenance Spend, Total Records, Avg Rent Occupied) paired with charts showing Rent and Maintenance by Property Type, Occupancy Distribution, Revenue by Location, and Monthly Rent and Maintenance by Month. Multiple slicers let you filter the entire dashboard instantly.
 Property Management Dashboard in Google Sheets
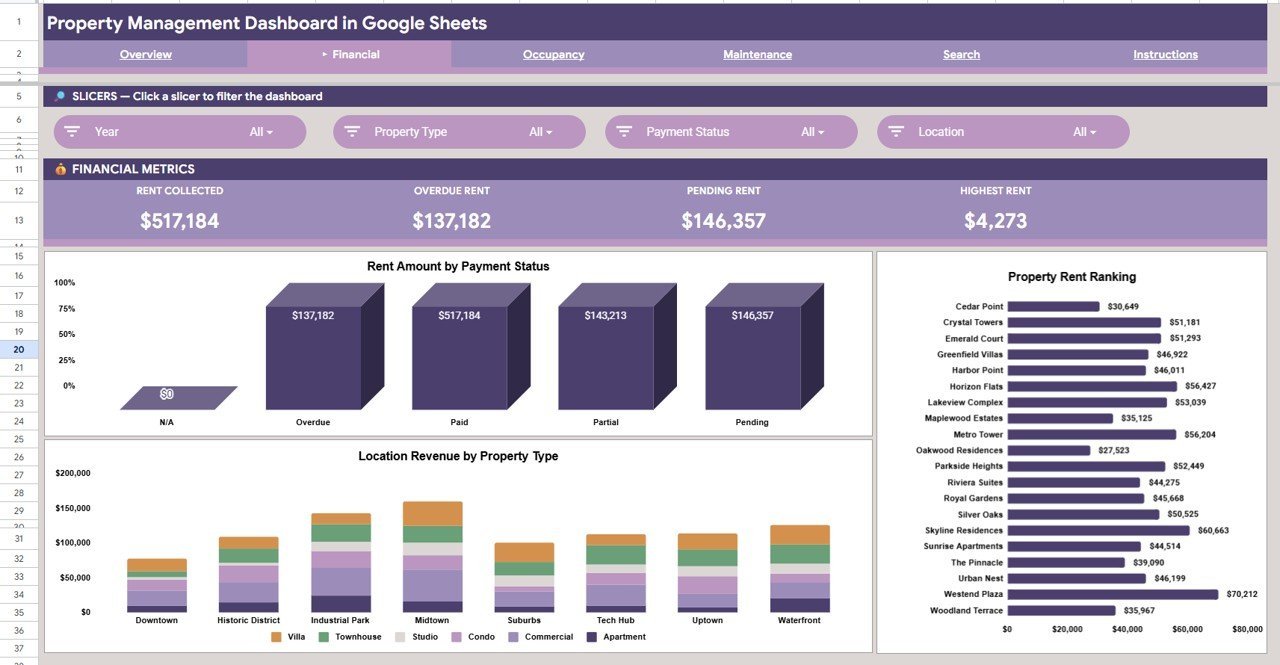
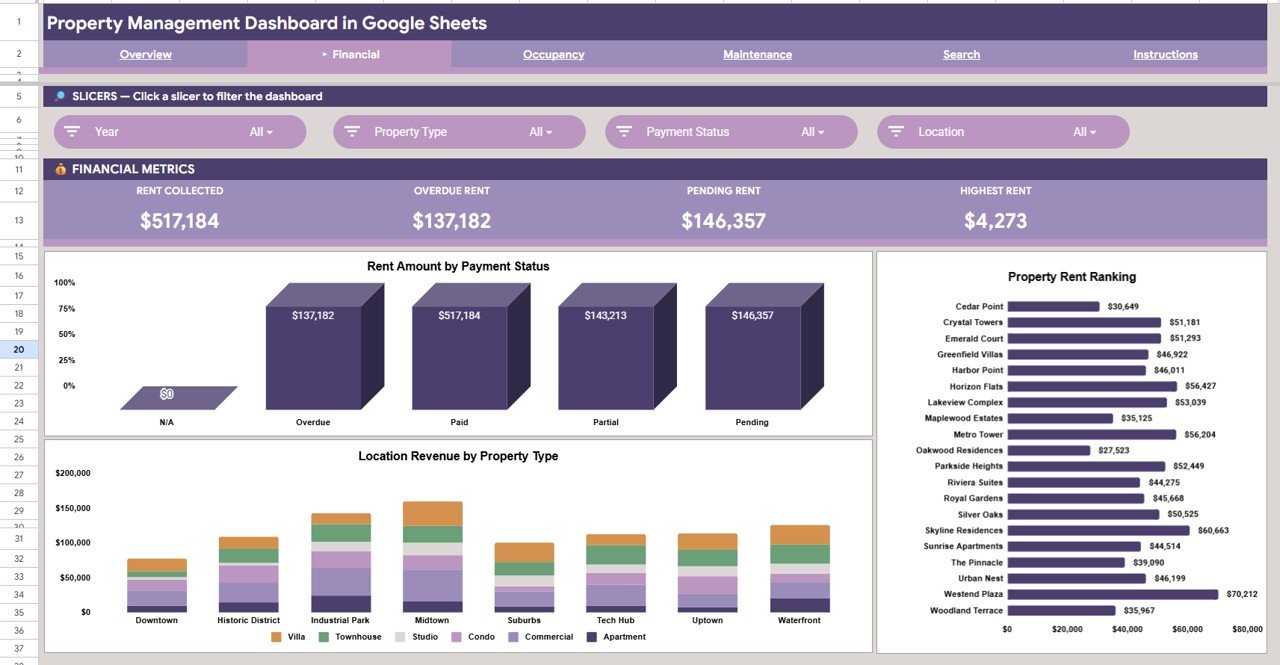
💰 2 — Financial Analysis. Breaks down financial data with metrics for Rent Amount by Payment Status, Property Rent Ranking by Property Name, and Location Revenue by Property Type — helping you identify which properties are generating the most income and which tenants have outstanding payments.
 Financial Analysis
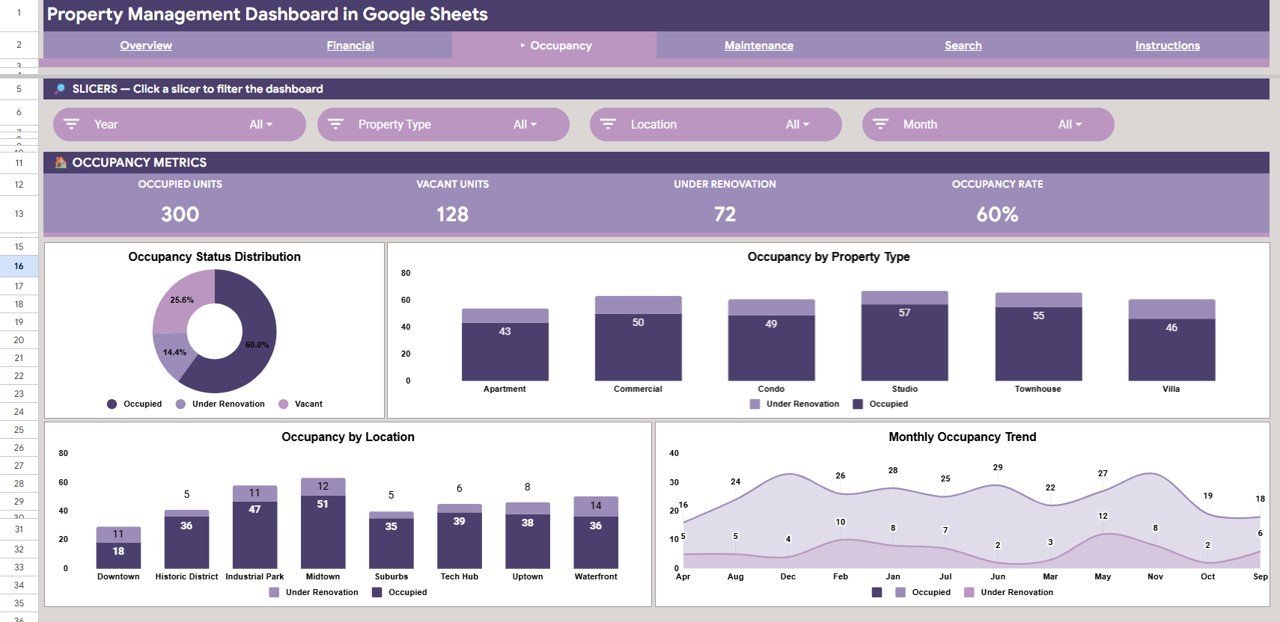
🏢 3 — Occupancy Analysis. Tracks occupancy patterns with Occupancy Status Distribution, Occupancy by Property Type, Occupancy by Location, and Monthly Occupancy by Month — so you can pinpoint vacancy trends and plan tenant acquisition strategies across your portfolio.
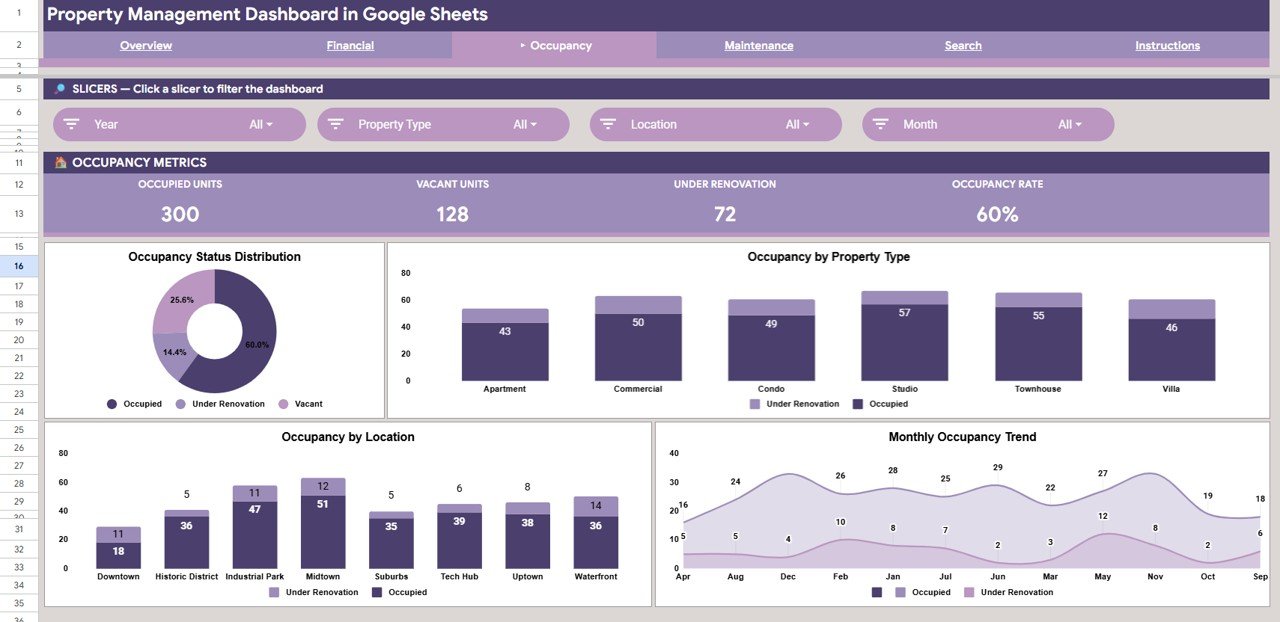 Occupancy Analysis
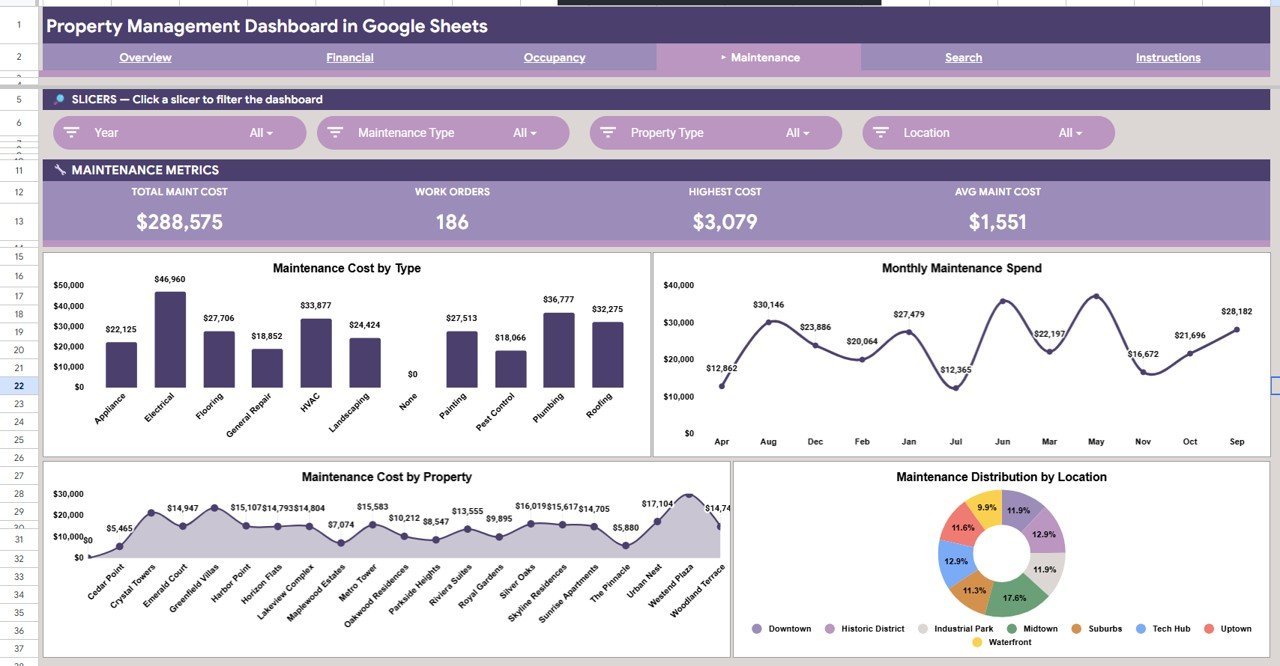
🔧 4 — Maintenance Analysis. Tracks Maintenance Cost by Type, Monthly Maintenance Spend by Month, Maintenance Cost by Property, and Maintenance Distribution by Location — giving you full visibility into where your maintenance budget is going and which properties consume the most repair spend.
 Maintenance Analysis
🔎 5 — Search Sheet. A Property Record Lookup feature where you select a Property ID from the dropdown and the dashboard instantly pulls every detail: Property Name, Property Type, Location, Units, Tenant, Rent Amount, Payment Status, Maintenance Cost, Maintenance Type, Occupancy Status, and Lease End date.
 Search Sheet
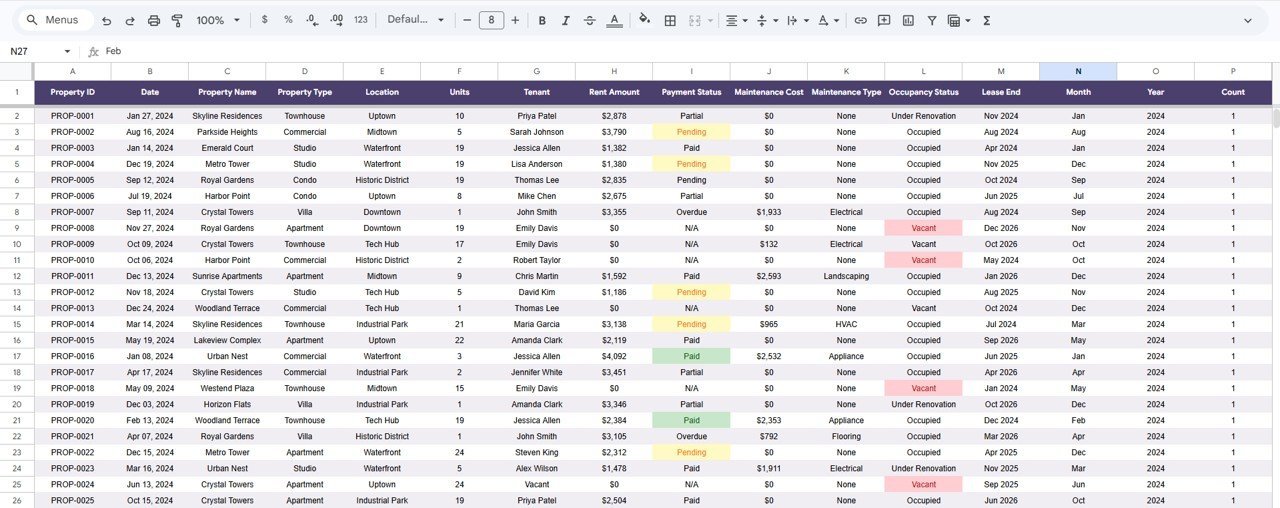
📋 6 — Data Sheet. The single input sheet for the entire dashboard. Add your property records in the same column format and every chart, card, and analysis page updates automatically.
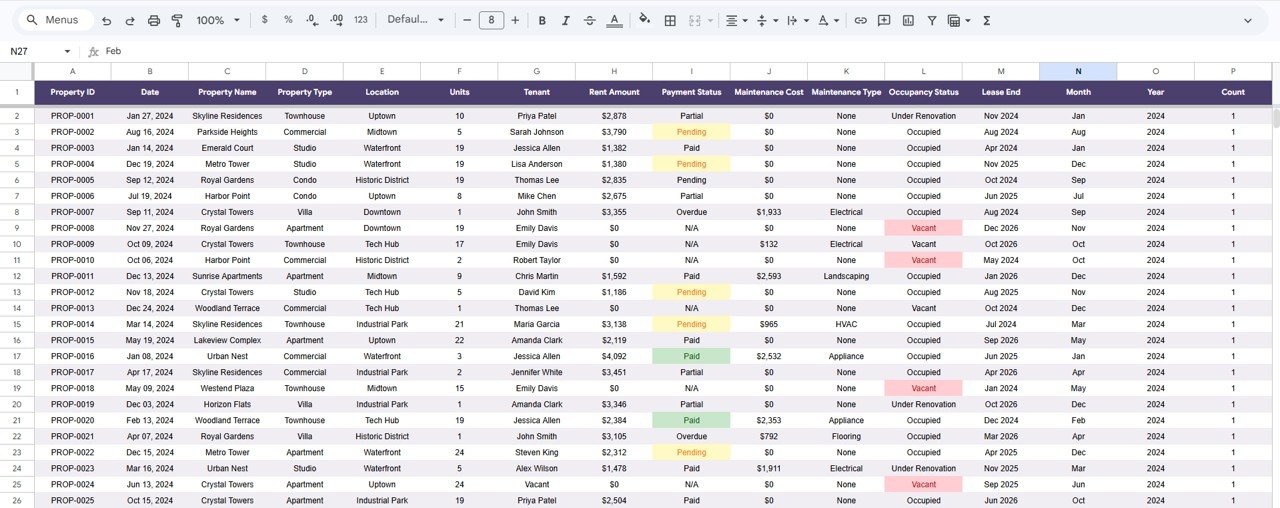 Data Sheet
📊 Property Management Dashboard in Google Sheets vs. Microsoft Excel vs. Paid Property Management SaaS — Where This Fits
| Feature | Property Management Dashboard in Google Sheets | Microsoft Excel Dashboard | Paid SaaS (Buildium / AppFolio / Rentec Direct) |
|---|---|---|---|
| Cost | $9.99 one-time | $17.99 one-time | $50–$300 / month |
| Platform | Google Sheets (any browser) | Microsoft Excel (desktop + web) | Cloud SaaS only |
| Setup time | Under 10 minutes | Under 10 minutes | 2–6 weeks onboarding |
| Real-time team collaboration | ✅ Built-in (Google Drive) | ⚠️ OneDrive only | ✅ Paid seat per viewer |
| Mobile access | ✅ Google Sheets app | ⚠️ Limited on mobile | ✅ |
| Customizable fields | ✅ Fully editable | ✅ Fully editable | ⚠️ Vendor-controlled |
| Share with link | ✅ One-click share | ⚠️ File attachment | ✅ Paid seat per viewer |
| Occupancy + financial + maintenance analysis | ✅ Out of the box | ✅ | ⚠️ Higher tier only |
| Year-1 cost at 5 users | $9.99 | $17.99 | $600–$3,600 |
For landlords and property managers who want occupancy, financial, and maintenance visibility without paying $600–$3,600 a year for an enterprise SaaS tool, the Property Management Dashboard in Google Sheets sits in the sweet spot.
👥 Who This Template Is For — and Who It’s Not For
✅ This template is built for:
- Landlords managing 5–100 residential or commercial rental units who track rent collection, occupancy, and maintenance in spreadsheets
- Property managers preparing monthly or quarterly portfolio reports for building owners or investors
- Real estate investors comparing occupancy rates, rent yields, and maintenance spend across properties
- Small property management firms building client-ready reports without paying for Buildium or AppFolio
- Facility managers tracking lease end dates and maintenance schedules across multiple buildings
❌ This template is NOT for:
- Large-scale property management companies needing real-time tenant portals, automated rent collection, and payment processing
- Enterprise teams requiring SOC 2 compliance, audit trails, and role-based permissions beyond Google Workspace
- Organizations needing automated lease-document generation, e-signatures, and tenant screening integration
⚙️ How to Use the Property Management Dashboard in Google Sheets
1️⃣ Open the PDF guide included in your download and click the Google Sheets copy link to create your own editable copy in Google Drive.
2️⃣ Navigate to the Data Sheet tab and replace the sample property records with your own data — keep the same column order.
3️⃣ Head to the Overview Page to see all 4 KPI cards and charts update automatically. Use the slicers to filter by property type, location, or occupancy status.
4️⃣ Explore the Financial Analysis, Occupancy Analysis, and Maintenance Analysis pages for detailed breakdowns of rent collection, vacancy patterns, and repair costs.
5️⃣ Use the Search Sheet to look up individual property records by selecting a Property ID from the dropdown.
6️⃣ Share the Google Sheets file with your team or building owners via link for real-time collaborative access.
💼 Real-World Use Cases
Rahul manages a 40-unit residential portfolio in Bangalore. He uses the Property Management Dashboard in Google Sheets to track monthly rent collection across 4 property types, spot which tenants have pending payments using the Financial Analysis page, and present occupancy reports to his investors via a single Google Sheets link — replacing a ₹25,000/month Buildium subscription.
Emily runs property operations for a 15-building commercial portfolio in Ohio. She tracks maintenance costs by building and by type using the Maintenance Analysis page. Each month she updates 200+ records in the Data Sheet, and the Overview cards show total rent collected, maintenance spend, and average occupied rent without her touching a single formula.
Carlos manages 8 rental properties across two cities for private investors. He duplicates the Google Sheet for each client, drops in their property data, and walks owners through occupancy trends and maintenance spend during quarterly reviews — replacing a $150/month property management SaaS with a one-time $9.99 purchase.
❓ Frequently Asked Questions
What KPIs does the Property Management Dashboard in Google Sheets track?
The Property Management Dashboard in Google Sheets tracks 4 headline KPIs — Total Rent Collected, Maintenance Spend, Total Records, and Avg Rent (Occupied) — plus financial, occupancy, and maintenance breakdowns across 6 interactive pages with slicer-based filtering.
How long does setup take?
Setup takes under 10 minutes. Open the PDF guide, click the Google Sheets copy link, paste your property records into the Data Sheet, and every KPI card, chart, and slicer updates automatically. No formulas to write.
How does this compare to Buildium or AppFolio?
Buildium and AppFolio typically cost $50–$300 per month with multi-week onboarding. The Property Management Dashboard in Google Sheets is $9.99 one-time, sets up in under 10 minutes, and covers the reporting layer most landlords actually need — without per-unit fees or long-term contracts.
Can I customize the property types, locations, and maintenance categories?
Yes. Every field in the Data Sheet is fully editable. Add new property types, rename locations, or introduce additional maintenance categories — the dashboard charts and KPI cards pick up the changes automatically when you update the data.
Does this dashboard work on mobile devices?
Yes. Google Sheets works on the Google Sheets mobile app for iOS and Android. The dashboard is accessible and functional on tablets and smartphones, though the full desktop browser experience provides the most complete view.
Can I track occupancy trends over time?
Yes. The Occupancy Analysis page includes Monthly Occupancy by Month to track vacancy patterns over time, plus Occupancy by Property Type and Occupancy by Location for cross-sectional analysis. All views respond to slicer filters for instant drill-down.
Is this a one-time payment?
Yes. The Property Management Dashboard in Google Sheets is a one-time $9.99 purchase with lifetime access — no subscription, no per-user fees, and no recurring charges. You also get free updates whenever the template is revised.
👤 About the Author
Built by PK — Microsoft Certified Professional with 15+ years of Excel, Google Sheets, and Power BI experience. Founder of NextGenTemplates, reaching 300K+ subscribers across YouTube channels (@PK-AnExcelExpert, @NextGenTemplates, @NeoTechNavigators). Every template is hand-built and tested before release.
🔗 Explore Related Templates
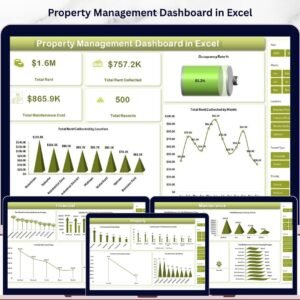
🏠 Property Management Dashboard in Excel — the Excel version with pivot tables and slicers for teams on the Microsoft stack.
📊 Property Management Dashboard in Power BI — the Power BI version for organizations using Power BI Service.
🏡 Rental Property Investment Dashboard in Google Sheets — companion template for investment-focused property tracking.
🏢 Real Estate Agent Dashboard in Google Sheets — for real estate agents tracking listings, sales, and commissions.
📈 Property Management KPI Dashboard in Google Sheets — MTD/YTD scorecard version with target vs actual tracking.
Browse the full Google Sheets Dashboard Templates library for 200+ industry-specific dashboards.
📖 Click here to read the Detailed Blog Post
Watch the step-by-step video tutorial:
🎥 Visit our YouTube channel for step-by-step video tutorials
👉 YouTube.com/@NextGenTemplates


Reviews
There are no reviews yet.