


Moving Company Dashboard in Google Sheets helps moving businesses track 4 headline KPIs, 6 connected sheet tabs, 20+ operational and revenue views, and a Move ID search page in one collaborative workbook. Specialized moving software can cost $99-$399 per user per month; this template is a $9.99 one-time purchase built for quick reporting, shared Google Drive access, and editable source data. Join 8,400+ teams in 40+ countries using NextGenTemplates for practical spreadsheet, Power BI, and HTML templates. Instant access, no subscription, no per-user fees, and lifetime use.
Key Features of Moving Company Dashboard in Google Sheets
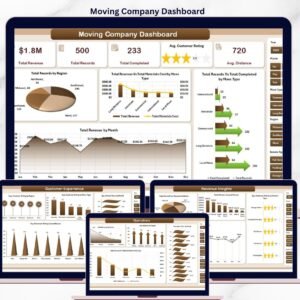
- 4 executive KPI cards: Total Revenue, Total Moves, Avg Revenue, and Avg Rating summarize business health at the top of the Overview page.
- 6 connected Google Sheets tabs: Overview, Operations, Revenue, Customers, Search, and Data.
- Interactive slicers: Filter the dashboard quickly by key moving-company dimensions so managers can review focused subsets of the business.
- Revenue analytics: Review revenue by move type, service type, move size, and month.
- Operations analytics: Track move status, truck size, move volume, and monthly move trends.
- Customer experience views: Analyze ratings by distribution, origin city, move type, distance, and revenue.
- Move ID lookup: Search one move record and view date, type, service, cities, distance, revenue, crew, truck, status, rating, and month.
- Editable Data sheet: Replace sample records with your own moving job data while keeping the same column format.
What’s Inside the Moving Company Dashboard in Google Sheets
The workbook is organized into 6 practical tabs that match how a small or mid-sized moving company reviews performance: executive summary, operations, revenue, customers, search, and raw data.
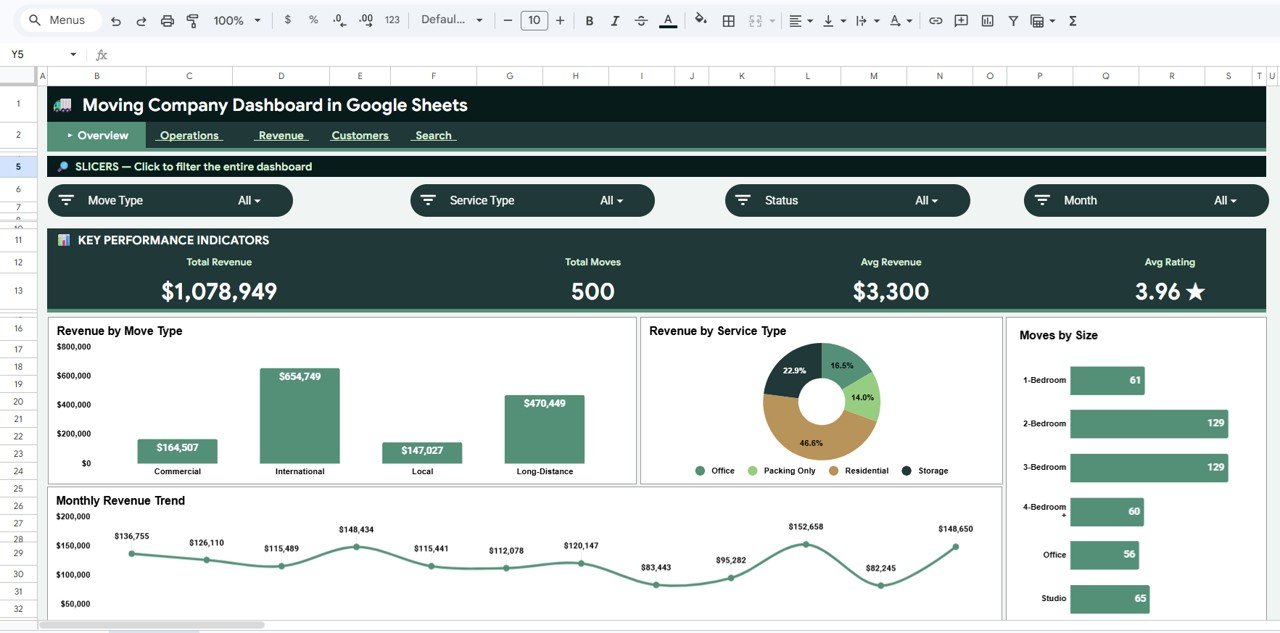
1. Overview Page
The Overview page shows high-level cards for Total Revenue, Total Moves, Avg Revenue, and Avg Rating. These cards help owners see sales volume, job count, average job value, and customer satisfaction without scrolling through the raw table.
Revenue by Move Type: This chart compares revenue across local, long-distance, residential, commercial, or other move categories. It helps identify which move types are producing the strongest sales.
Revenue by Service Type: This view shows whether packing, loading, full-service, storage, or transport services are driving more revenue. It supports pricing and service-mix decisions.
Moves by Size: This chart breaks move count by small, medium, large, or similar size groups. It helps plan crew allocation and truck availability.
Monthly Revenue by Month: This chart tracks monthly revenue movement so teams can spot seasonal peaks, slow periods, and growth trends.
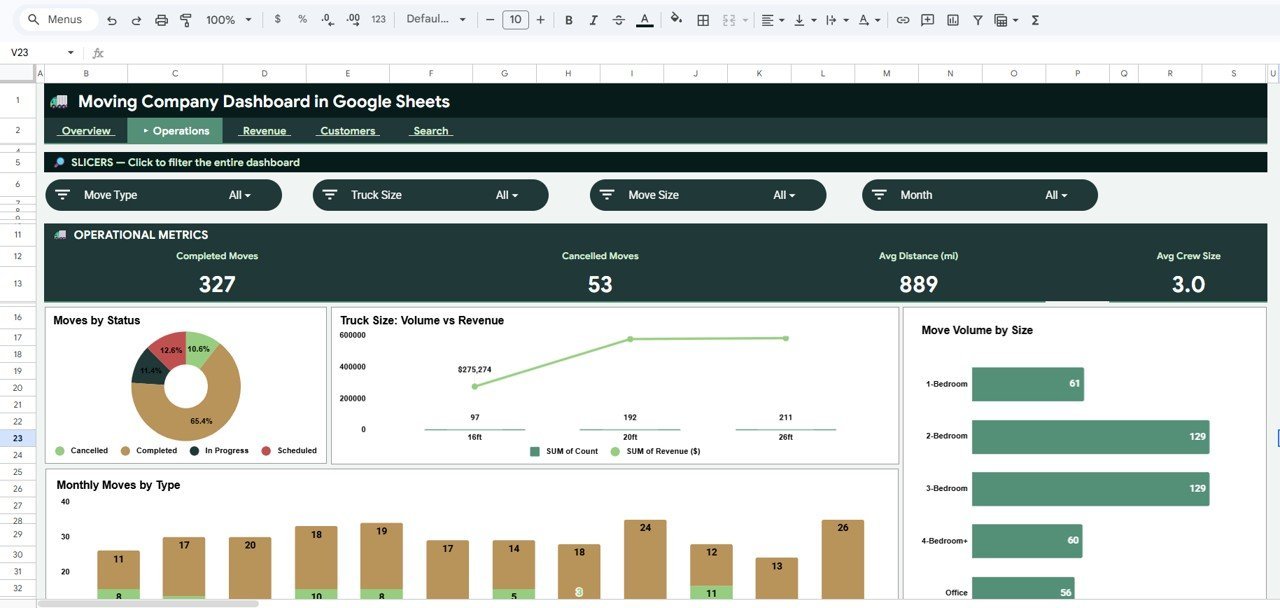
2. Operations Page
The Operations tab focuses on job flow and capacity. Moves by Status highlights booked, completed, cancelled, or pending work so dispatchers can see backlog and completion patterns. Move Volume and Revenue by Truck Size compares truck classes against sales output, helping teams match vehicle availability to revenue demand.
Move Volume by Move Size shows how many jobs fall into each move-size band, which is useful for crew planning. Monthly Moves by Move Type reveals how job mix changes across the year, supporting staffing and marketing decisions.

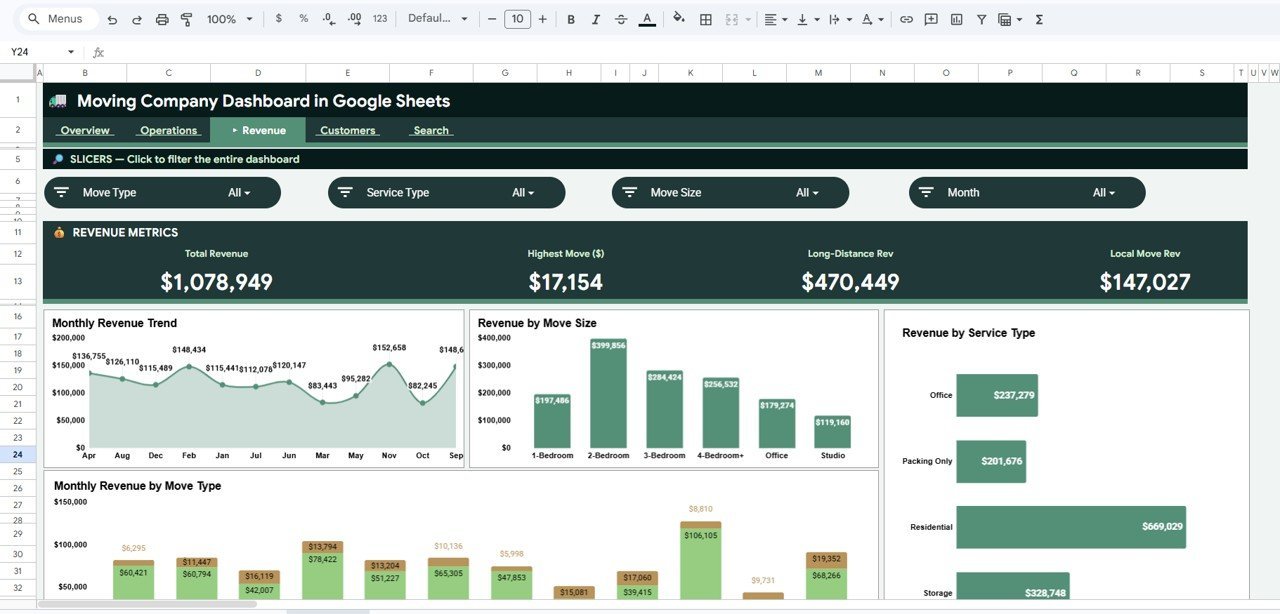
3. Revenue Page
The Revenue tab gives finance and ownership a focused view of income patterns. Revenue by Month tracks period-to-period performance, while Revenue by Move Size shows whether small, medium, or large moves are contributing the most sales.
Revenue by Service Type helps compare service categories and identify higher-value offerings. Monthly Revenue by Move Type adds a time-based layer so managers can see which move types are growing or declining.

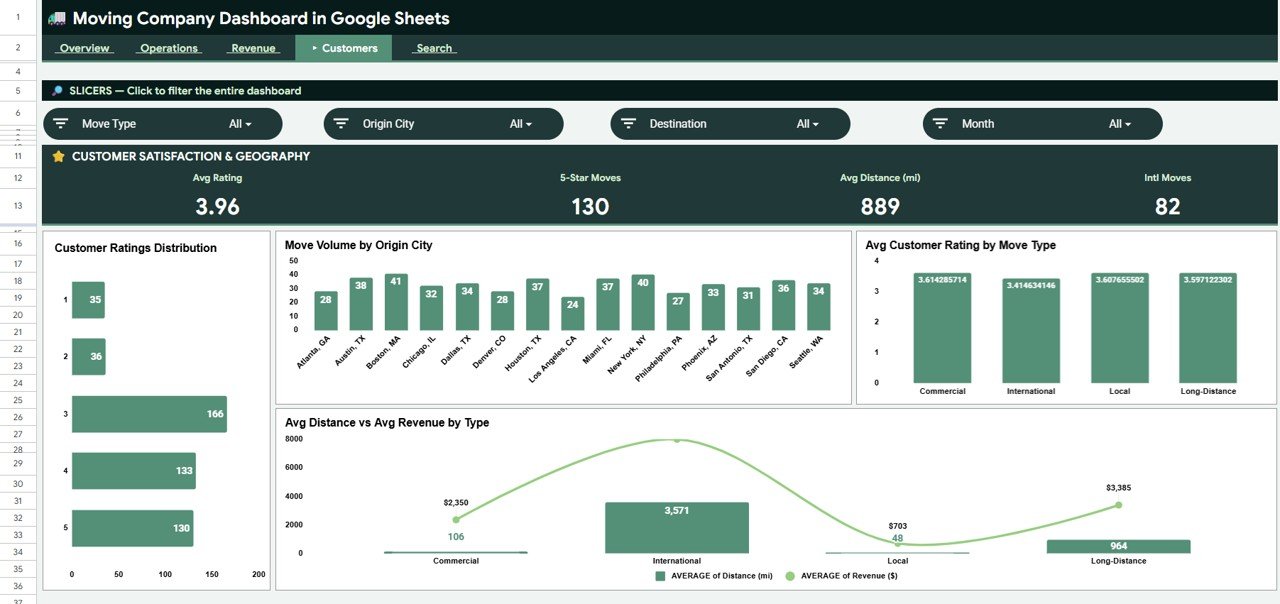
4. Customers Page
The Customers tab connects service quality with operational patterns. Customer Ratings Distribution by Rating shows whether ratings are concentrated at the high or low end, helping managers monitor service experience.
Move Volume by Origin City shows where demand is coming from. Average Customer Rating by Move Type helps identify service categories that need training or process improvements. Average Distance and Average Revenue by Move Type compares distance and sales value together, useful for pricing longer or more complex jobs.
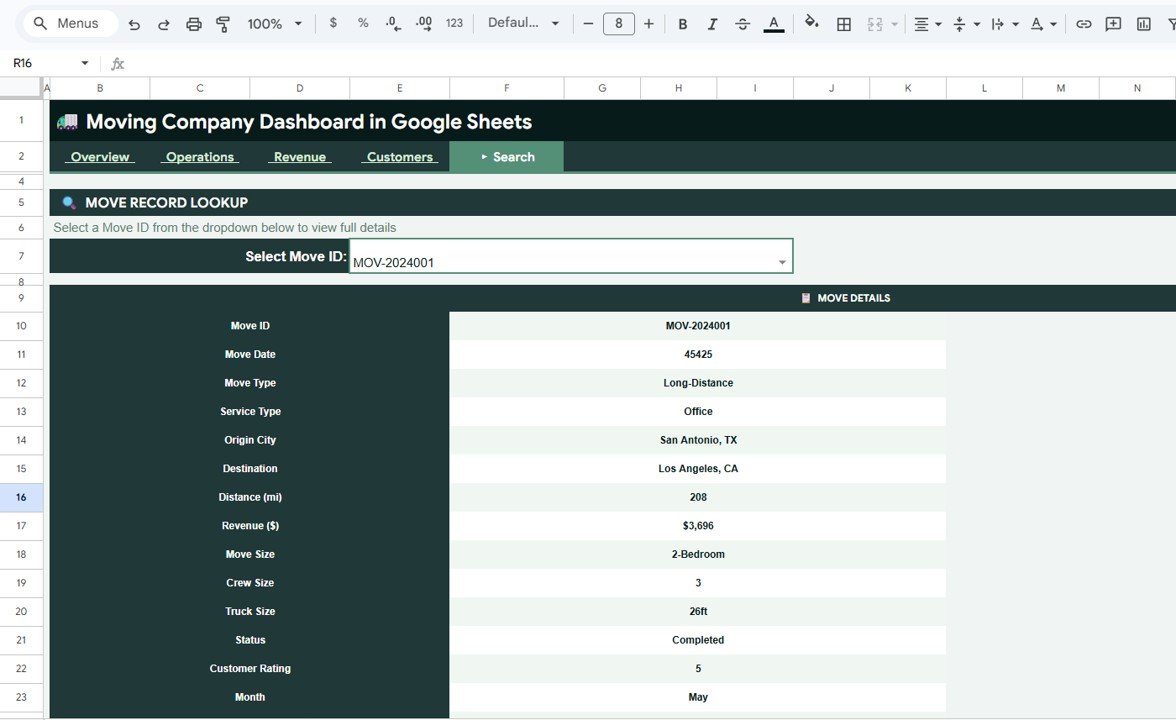
5. Search Page
The Search tab gives users a single-record lookup by Move ID. It displays Move Details, Move Date, Move Type, Service Type, Origin City, Destination, Distance, Revenue, Move Size, Crew Size, Truck Size, Status, Customer Rating, and Month for the selected move.
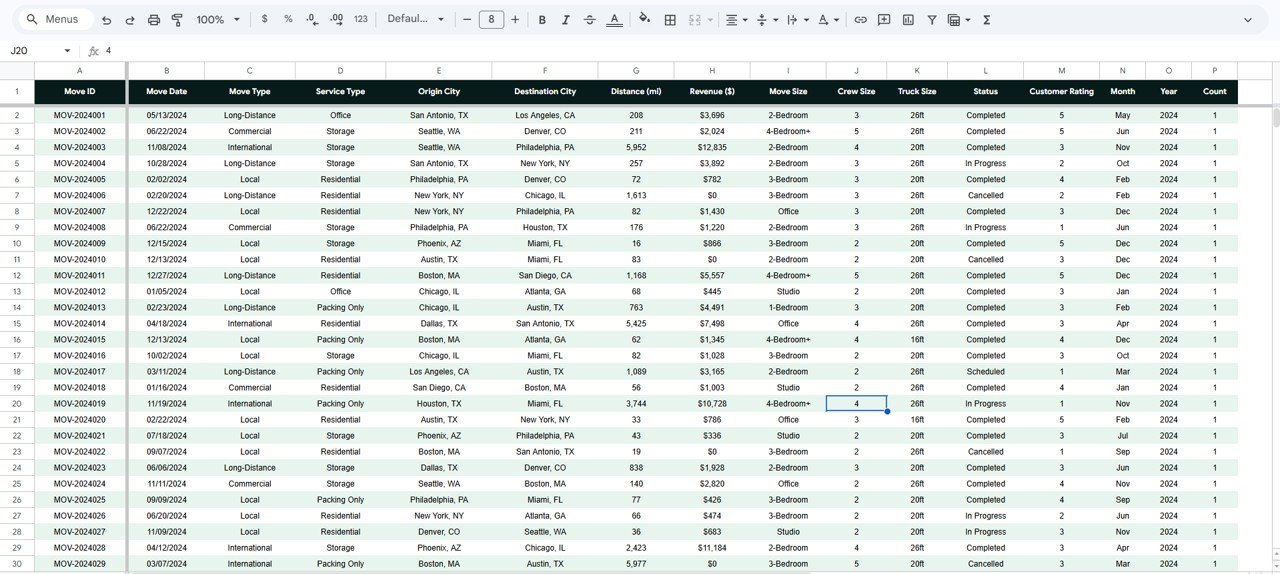
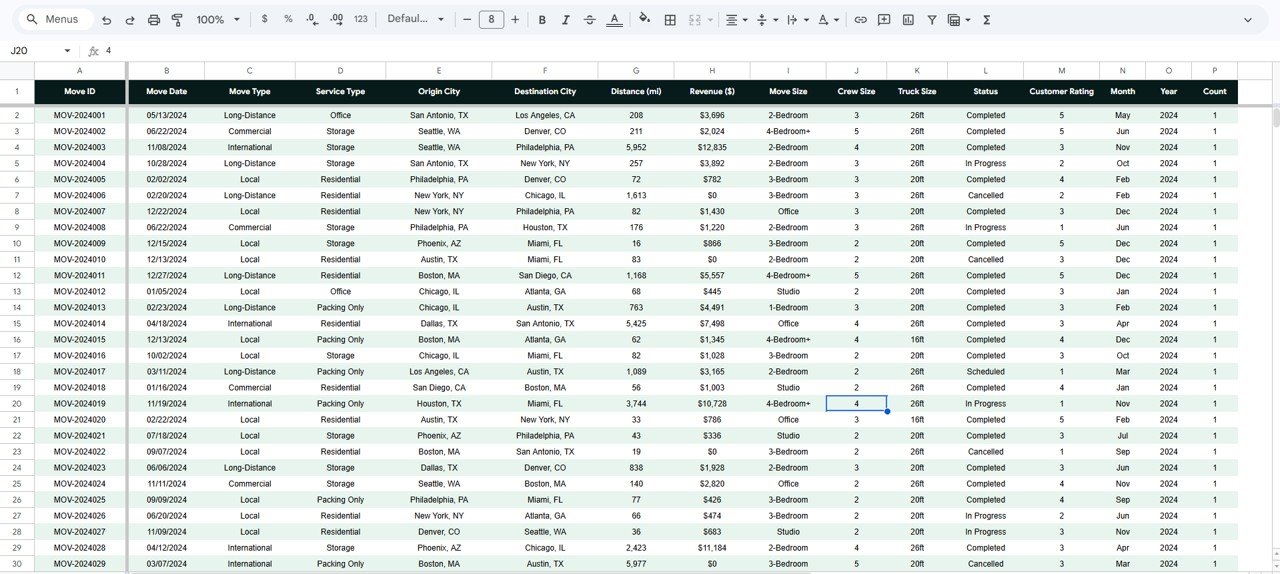
6. Data Sheet Tab
The Data sheet is the source table for the dashboard. Add your own moving job records in the same format, keep the column structure stable, and the dashboard pages can continue to calculate cards, charts, slicers, and lookup results correctly.
Moving Company Dashboard in Google Sheets vs. Microsoft Excel vs. Paid CRM/SaaS – Where This Fits
| Feature | This Google Sheets dashboard | Microsoft Excel dashboard | Paid moving CRM/SaaS |
|---|---|---|---|
| Cost | $9.99 one-time | One-time template cost | $99-$399 per user per month |
| Platform | Google Sheets in browser | Excel desktop or Microsoft 365 | Vendor cloud platform |
| Setup time | Under 10 minutes after copying | Fast after workbook setup | Often requires onboarding |
| Team collaboration | Built into Google Drive sharing | Best with Microsoft 365 | Account-based access |
| Customizable fields | Fully editable | Fully editable | Often restricted by plan |
| Move lookup | Built-in Search tab | Requires workbook lookup | Usually included |
| Year-1 cost at 5 users | $9.99 total | Template cost plus setup time | Often $5,000+ |
Who This Template Is For – and Who It’s Not For
This template is for moving-company owners, dispatchers, operations managers, relocation coordinators, and finance teams that need a simple reporting layer for jobs, revenue, customer ratings, truck usage, and service mix.
It is not a full dispatching system, route optimizer, CRM, payroll tool, GPS tracker, or customer booking portal. Larger carriers that need live telematics, automated crew SMS, claims management, or DOT compliance should use specialized moving software and treat this as a reporting companion.
How to Use the Moving Company Dashboard in Google Sheets
- Open the PDF guide in your download and use the Google Sheets copy link.
- Click Make a copy to save your editable workbook in Google Drive.
- Go to the Data sheet and replace the sample records with your moving job data.
- Keep the same column structure for Move ID, date, move type, service type, cities, distance, revenue, crew, truck, status, rating, and month.
- Use slicers on the dashboard pages to filter by the available fields.
- Use the Search tab to review one Move ID at a time.
Real-World Use Cases
Olivia, owner of a 7-truck local moving company, reviews Total Revenue, Total Moves, and Monthly Revenue every Monday before assigning crew capacity for the week.
Ravi, a dispatch manager, uses Moves by Status and Move Volume by Move Size to identify bottlenecks before peak weekend demand.
Maya, a relocation consultant, uses Average Customer Rating by Move Type and Move Volume by Origin City to improve service quality and local marketing focus.
Frequently Asked Questions
Is the Moving Company Dashboard in Google Sheets beginner-friendly?
Yes. The dashboard is designed for normal Google Sheets users. Replace the sample data, keep the same columns, and use the prepared dashboard pages.
Can I use this for local and long-distance moves?
Yes. You can track different move types, service types, move sizes, truck sizes, cities, distance, revenue, status, and rating fields.
Does the template include a search feature?
Yes. The Search tab lets you select or enter a Move ID and view the matching move details in a clean lookup format.
Can my team collaborate on the dashboard?
Yes. Because it is built in Google Sheets, you can share it through Google Drive with view, comment, or edit permissions.
Does this replace moving-company CRM software?
No. It is a reporting dashboard, not a booking, dispatch, billing, or customer communication platform.
Can I customize the charts and fields?
Yes. Google Sheets is editable, so you can adjust labels, formulas, charts, slicers, and source fields as needed.
About the Author
Built by PK – Microsoft Certified Professional with 15+ years of Excel, Google Sheets, and Power BI experience. Founder of NextGenTemplates, reaching 300K+ subscribers across YouTube channels. Every template is hand-built and tested before release.
Explore Related Templates
- Moving Company Dashboard in Excel – for teams that prefer Excel desktop reporting.
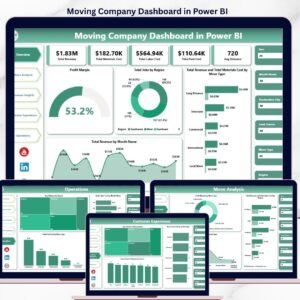
- Moving Company Dashboard in Power BI – for teams that want a Power BI version.
- Trucking and Logistics Dashboard in Google Sheets – a broader logistics dashboard for shipment and fleet reporting.
- Transportation Operations Dashboard in Google Sheets – useful for wider transportation KPI reporting.
- Trucking and Logistics Dashboard in HTML – browser-based logistics reporting without spreadsheet software.
Browse more Google Sheets templates and Google Sheets dashboard templates for related reporting tools.
Ready to track moving revenue, operations, customer ratings, and job details in one shared file? Add the Moving Company Dashboard in Google Sheets to your toolkit today.
Last updated: May 22, 2026


Reviews
There are no reviews yet.