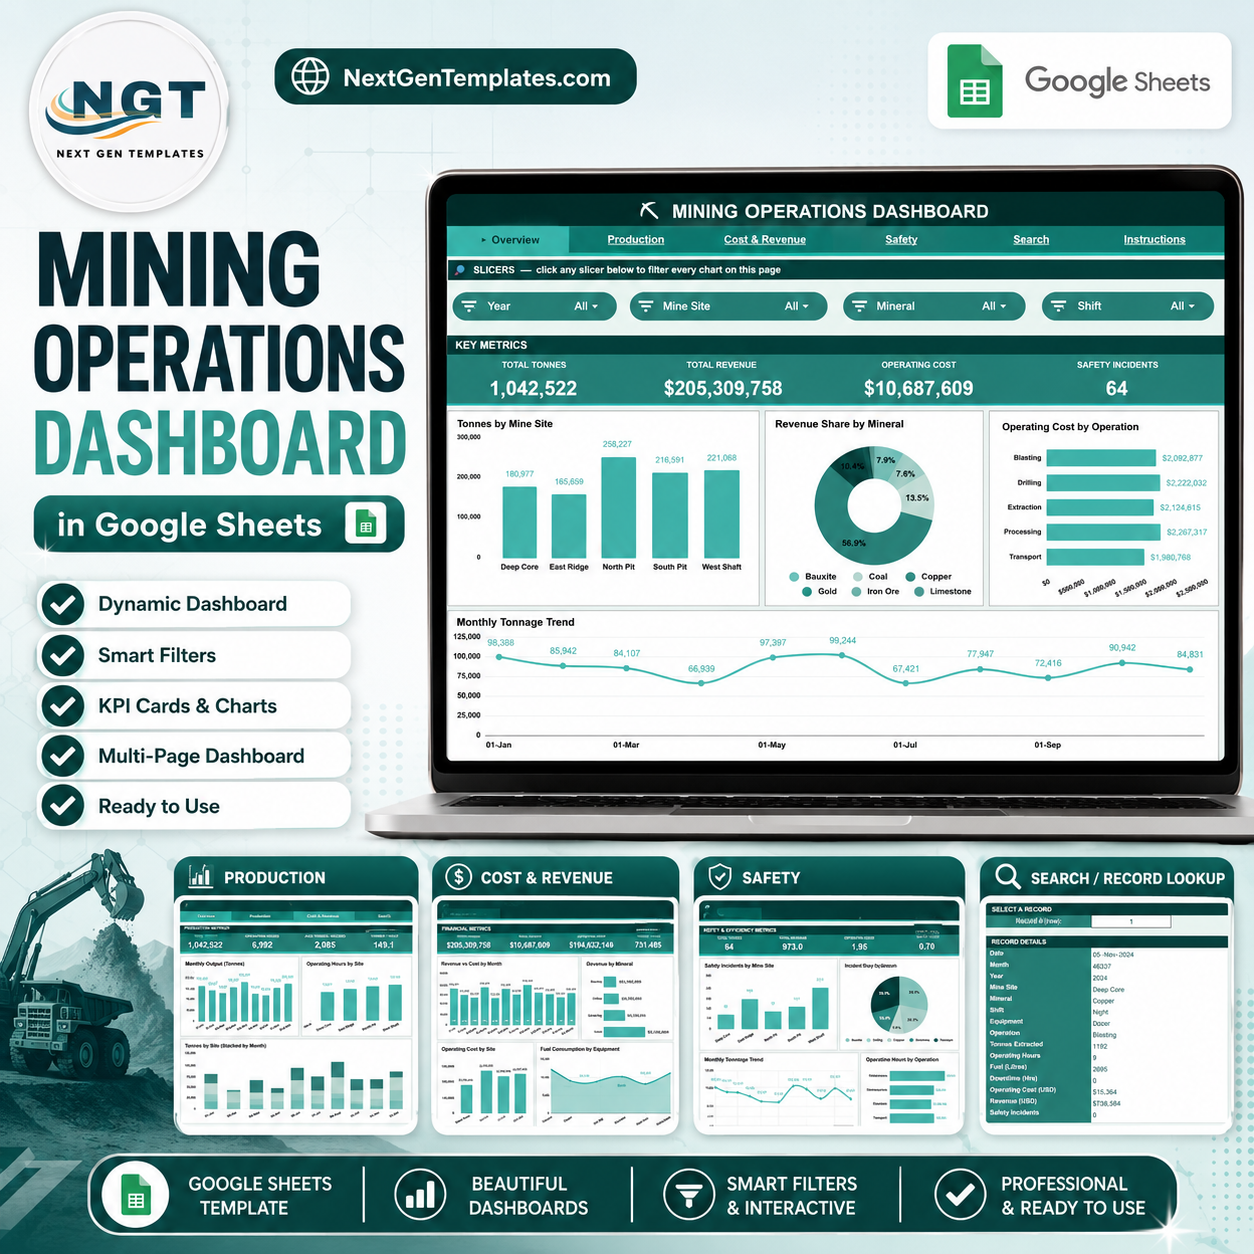

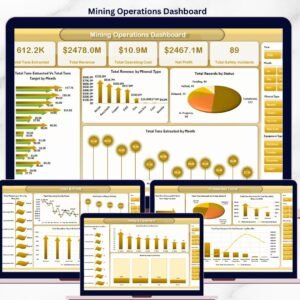
The Mining Operations Dashboard in Google Sheets tracks 4 headline KPIs across 6 connected tabs, with 16 pre-built charts and slicer filters covering production, cost, revenue, and safety. Setup takes under 10 minutes — copy it to your Google Drive, paste your extraction data into the Data tab, and every chart and KPI updates automatically.
🌍 Join 8,400+ teams in 40+ countries using NextGenTemplates to replace paid SaaS tools with one-time-purchase Excel, Google Sheets, Power BI, and HTML templates.
✅ Instant download · One-time payment · No subscription · No per-user fees · Lifetime access
🔑 Key Features of the Mining Operations Dashboard in Google Sheets
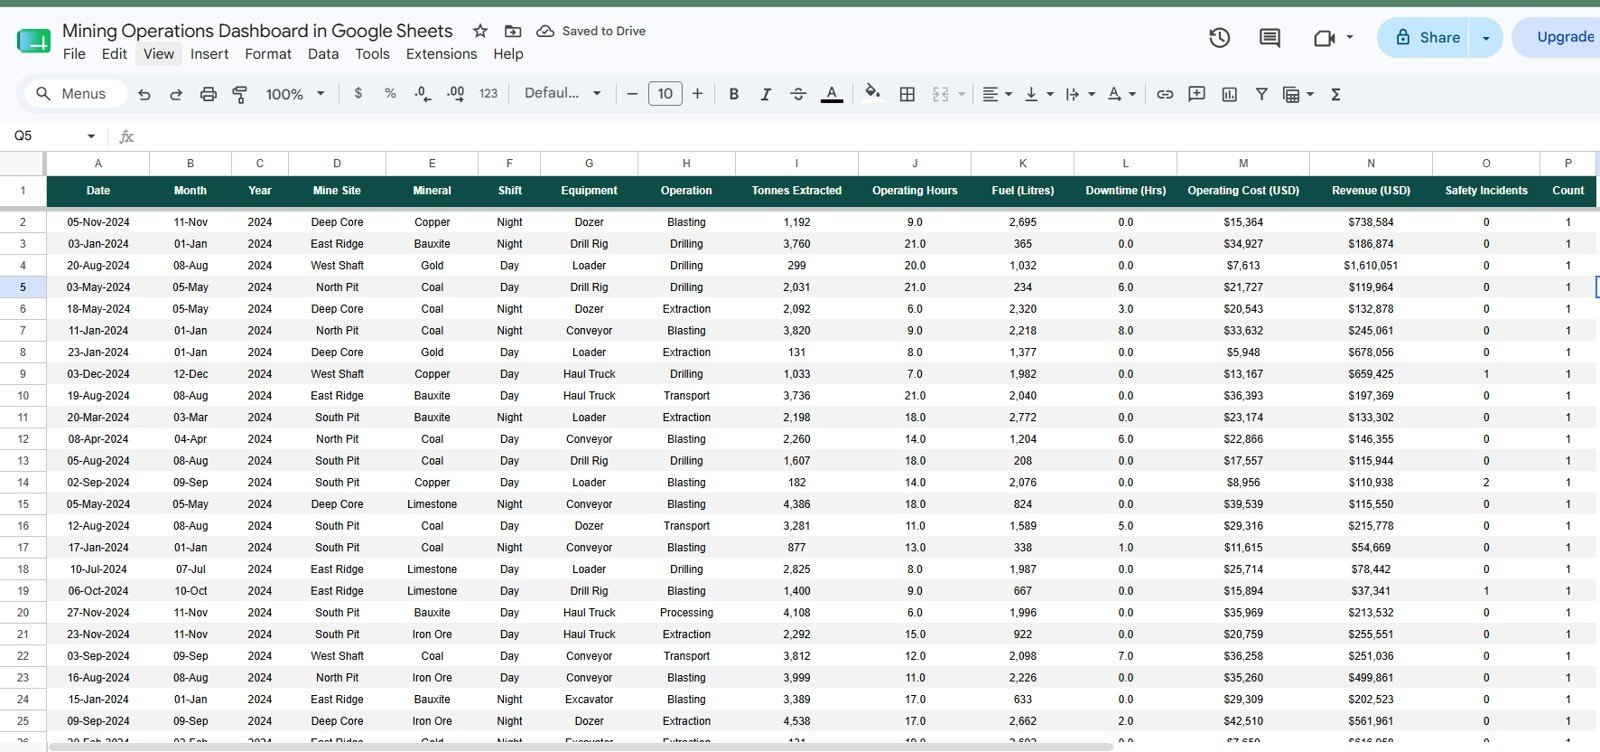
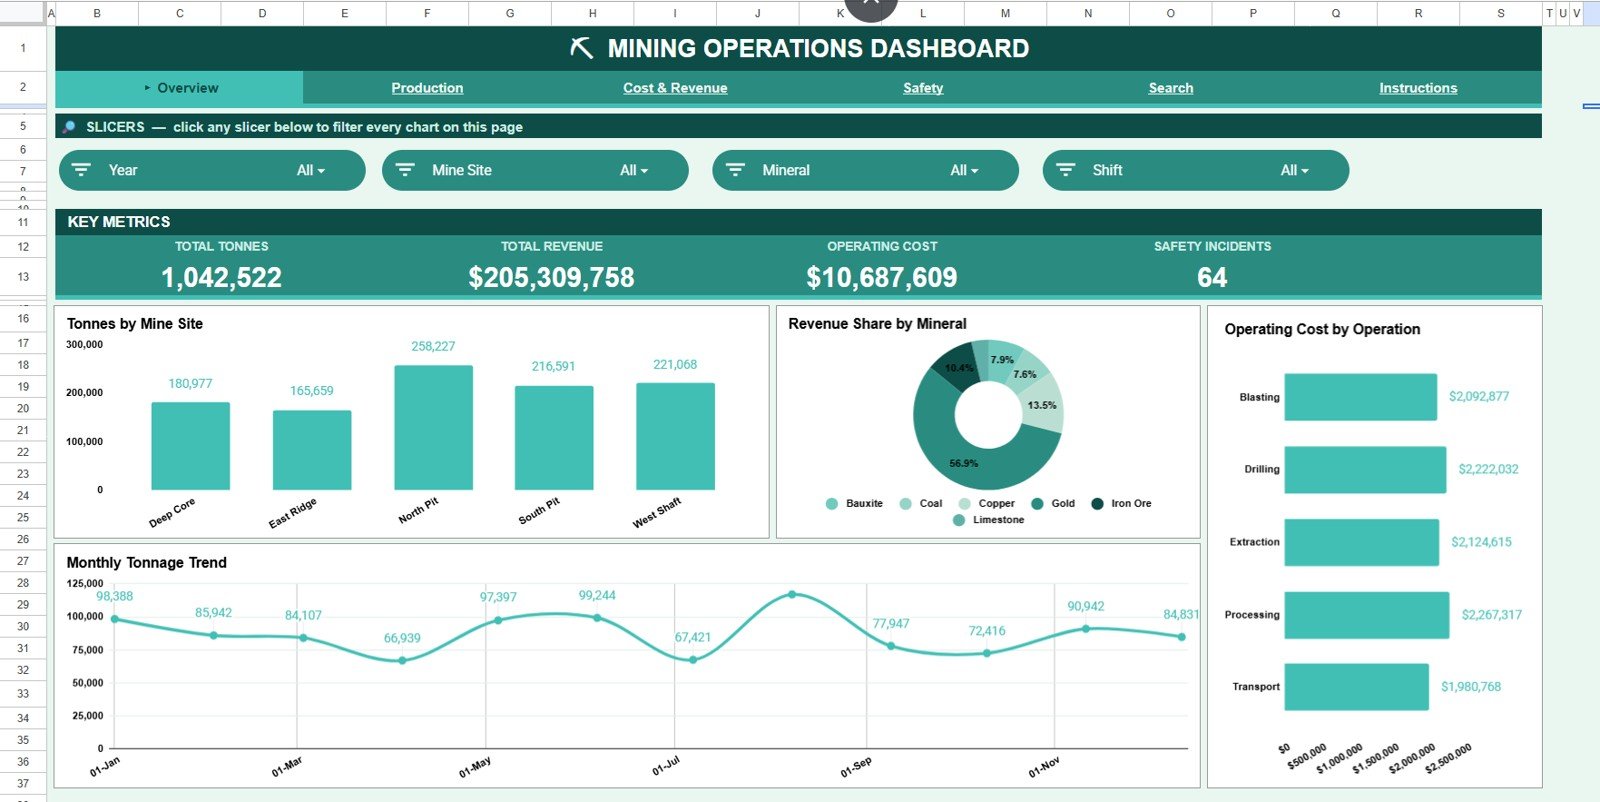
📊 This Google Sheets mining dashboard tracks 15 data fields per record — date, month, year, mine site, mineral, shift, equipment, operation, tonnes extracted, operating hours, fuel, downtime, operating cost, revenue, and safety incidents — and rolls them up into four KPI cards: Total Tonnes, Total Revenue, Operating Cost, and Safety Incidents.
🎛️ The Overview page carries native Google Sheets slicers, so you can filter the entire dashboard by mine site, mineral, shift, or operation with a single click and see the filtered view instantly — no formulas to touch.
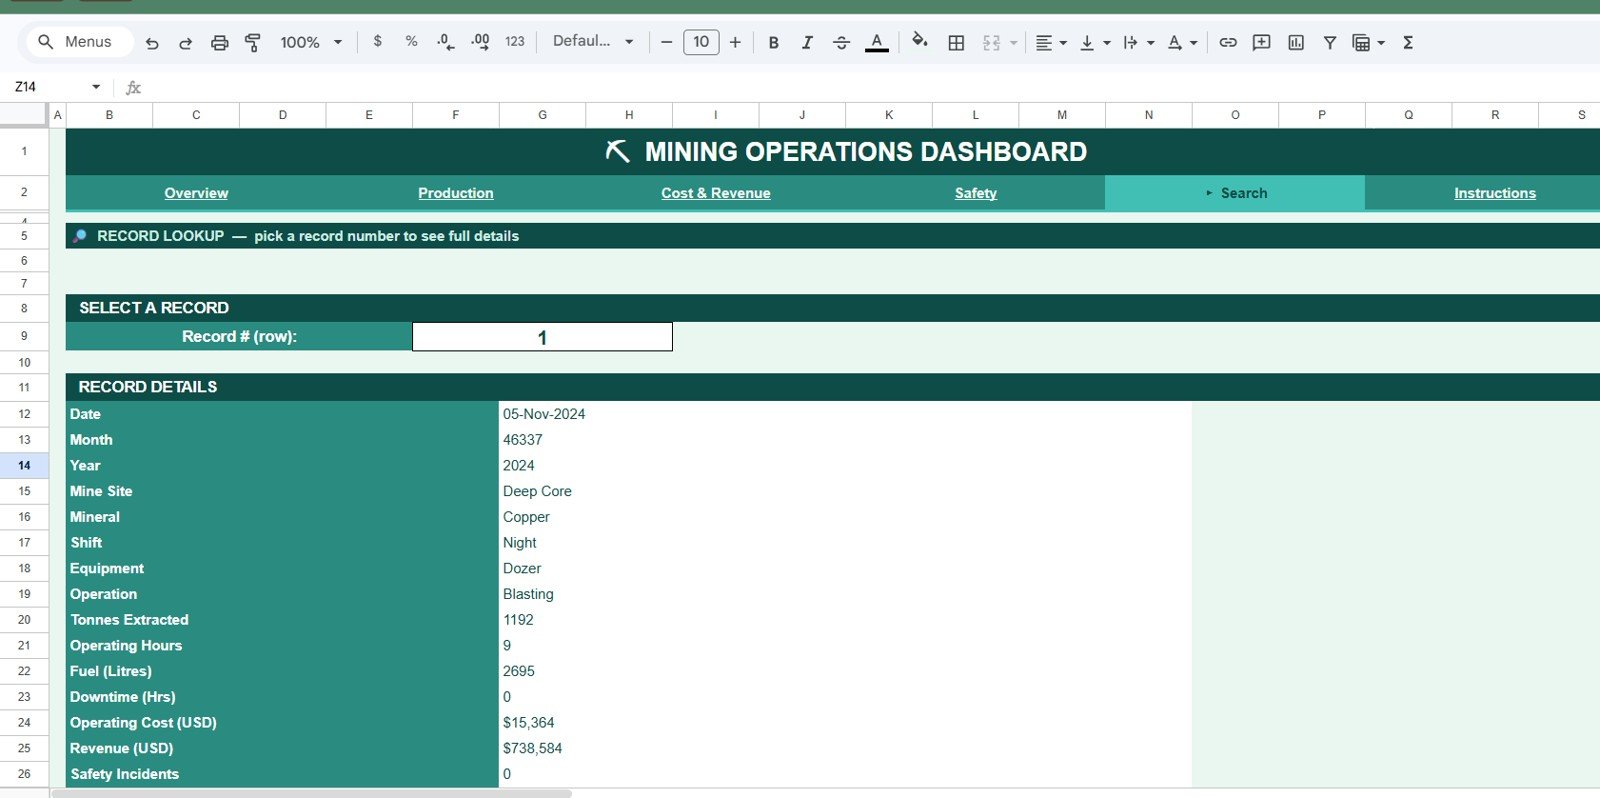
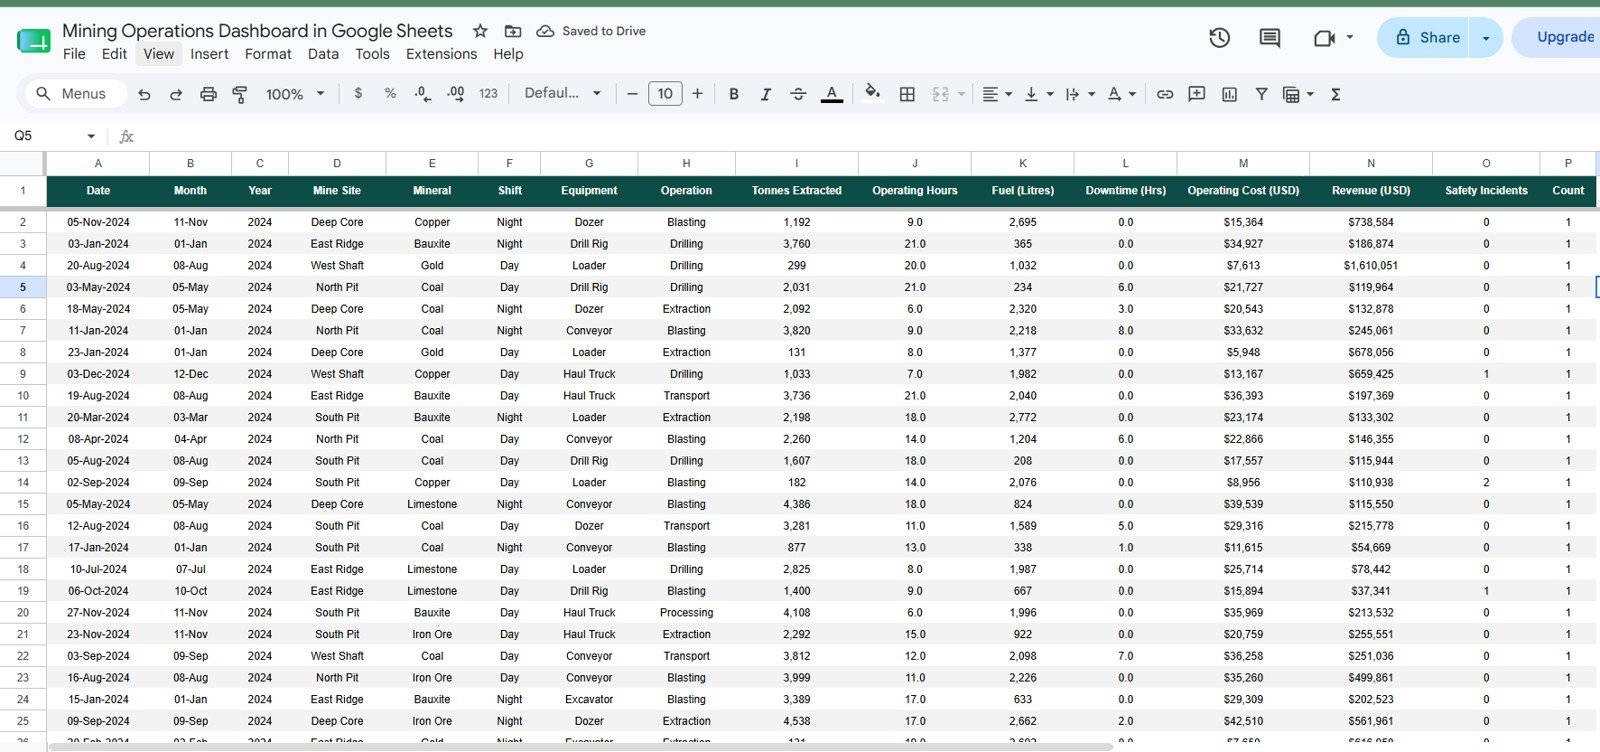
🔎 A dedicated Search tab lets you look up any record by its number and returns all 15 fields for that entry at once, while the Data tab is where you paste your own rows in the same column order and watch all 16 charts recalculate on their own.
📈 Because it runs entirely in the browser, the mining operations dashboard opens on any device, shares with a link, and needs no Excel install or Power BI licence.
📦 What’s Inside the Mining Operations Dashboard in Google Sheets
Six tabs, four KPI cards, sixteen charts, slicer filters, a search lookup, and a clean data-entry sheet. Here is each page in detail.
Page 1: Overview
The Overview page opens with four KPI cards — Total Tonnes, Total Revenue, Operating Cost, and Safety Incidents — sitting above slicers that filter the whole page. Charts include Tonnes by Mine Site, Revenue Share by Mineral, Operating Cost by Operation, and Monthly Tonnage Trend, giving leadership a one-screen read of output, earnings, spend, and risk.
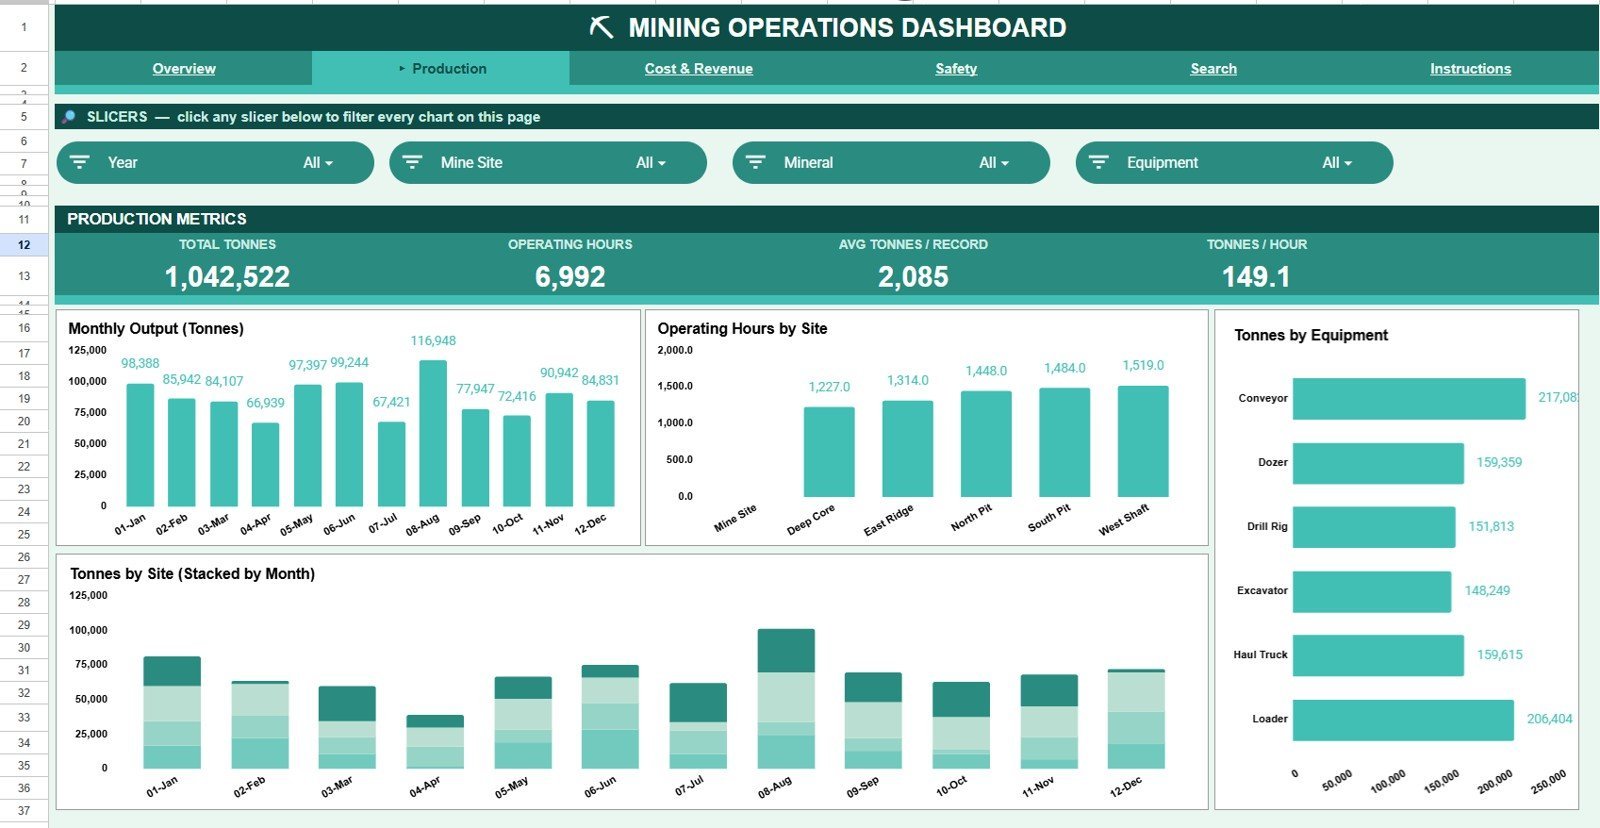
Page 2: Production
The Production tab focuses on throughput and utilisation. Charts include Monthly Output (Tonnes), Operating Hours by Site, Tonnes by Equipment, and Monthly Tonnes by Site — so you can spot which site or machine is driving volume and where hours are being spent.

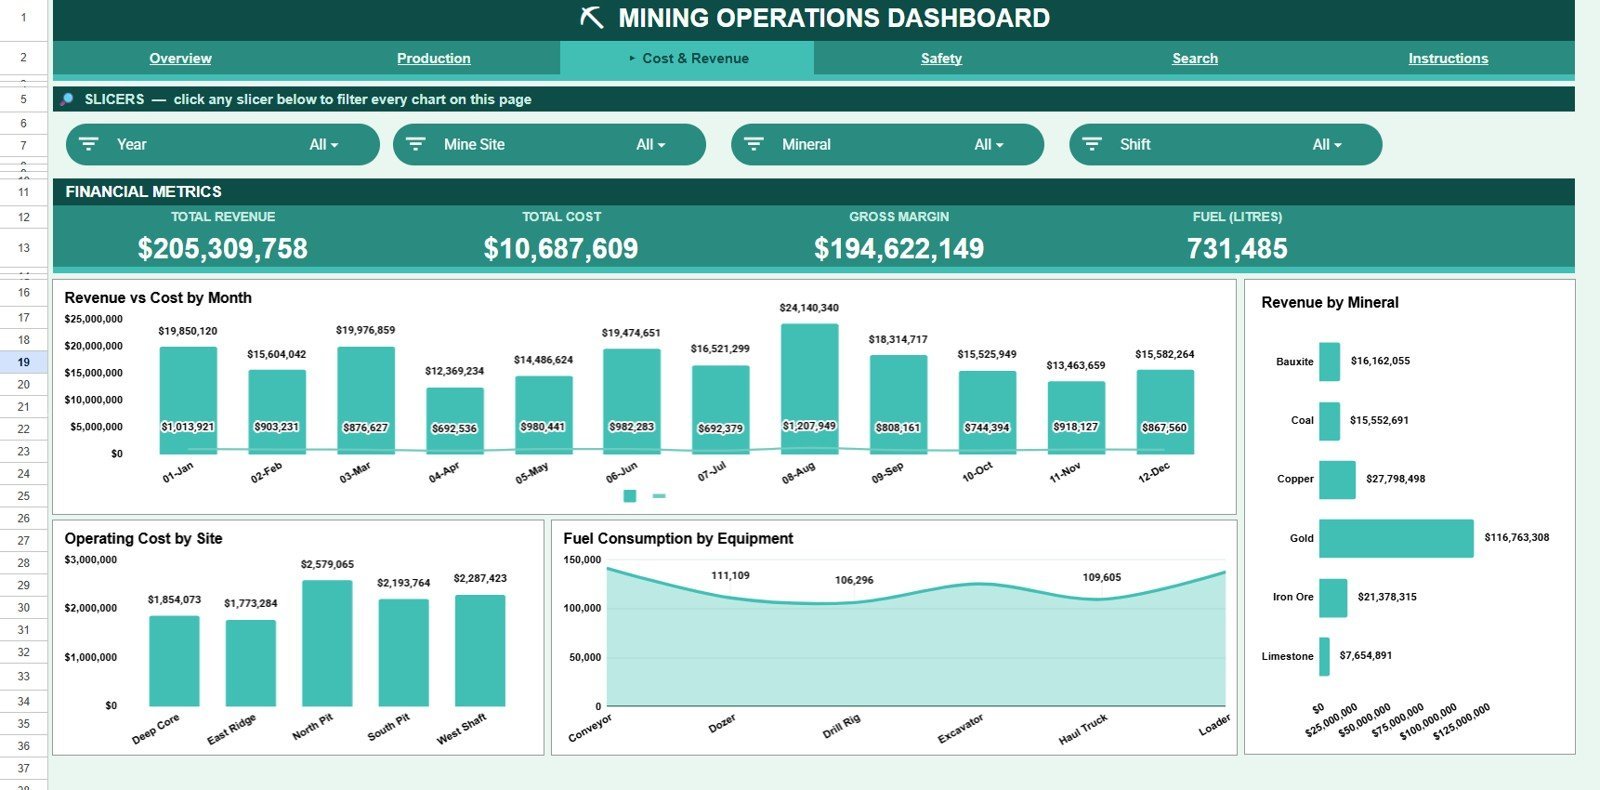
Page 3: Cost & Revenue
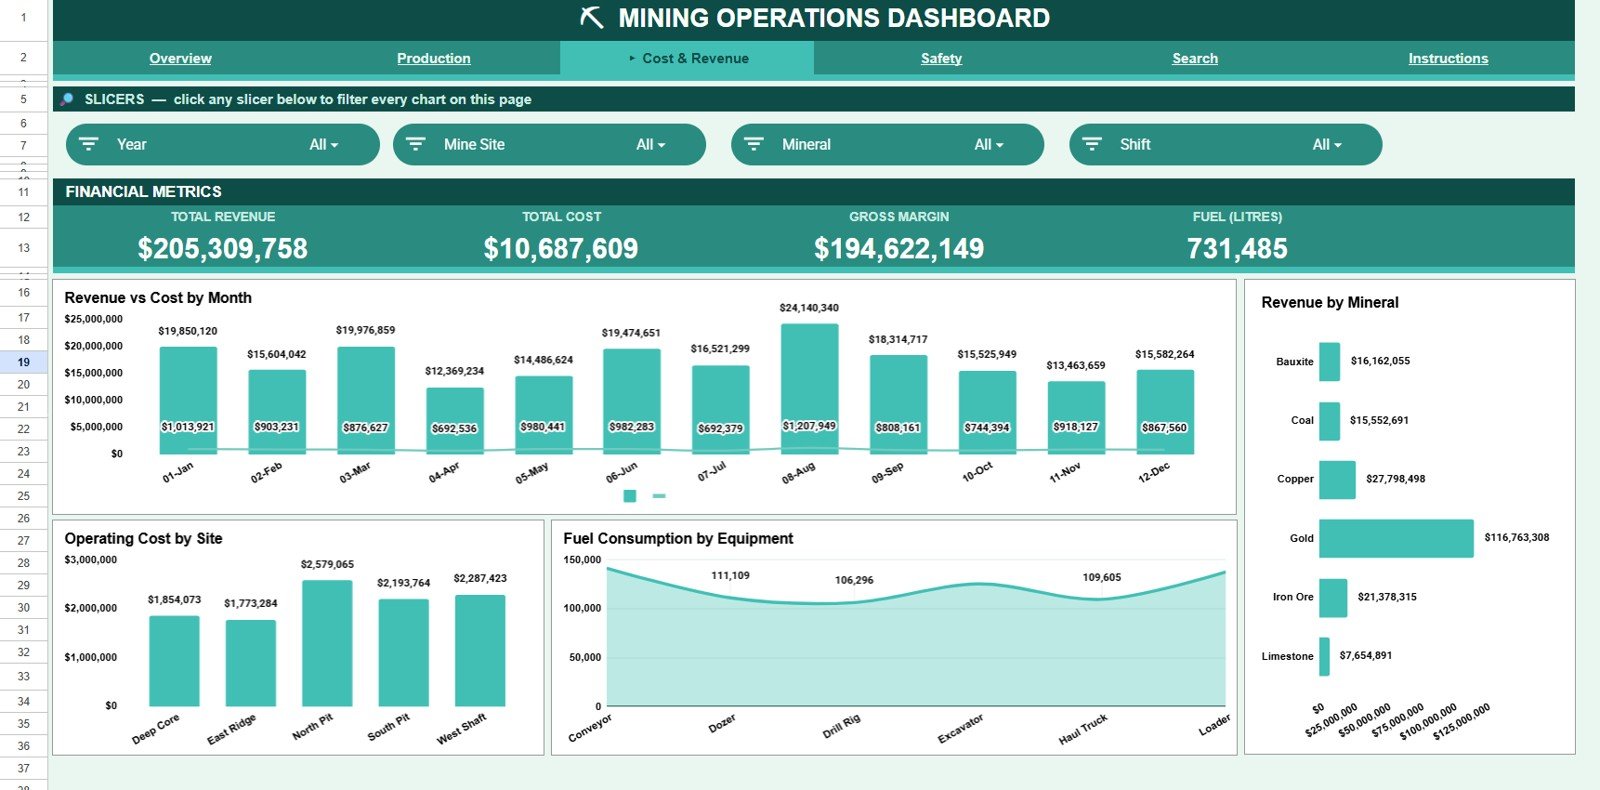
The Cost & Revenue tab connects money in with money out. Charts include Revenue vs Cost by Month, Revenue by Mineral, Operating Cost by Site, and Fuel Consumption by Equipment — making it easy to see margin trends and which minerals and machines carry the heaviest cost.
Page 4: Safety
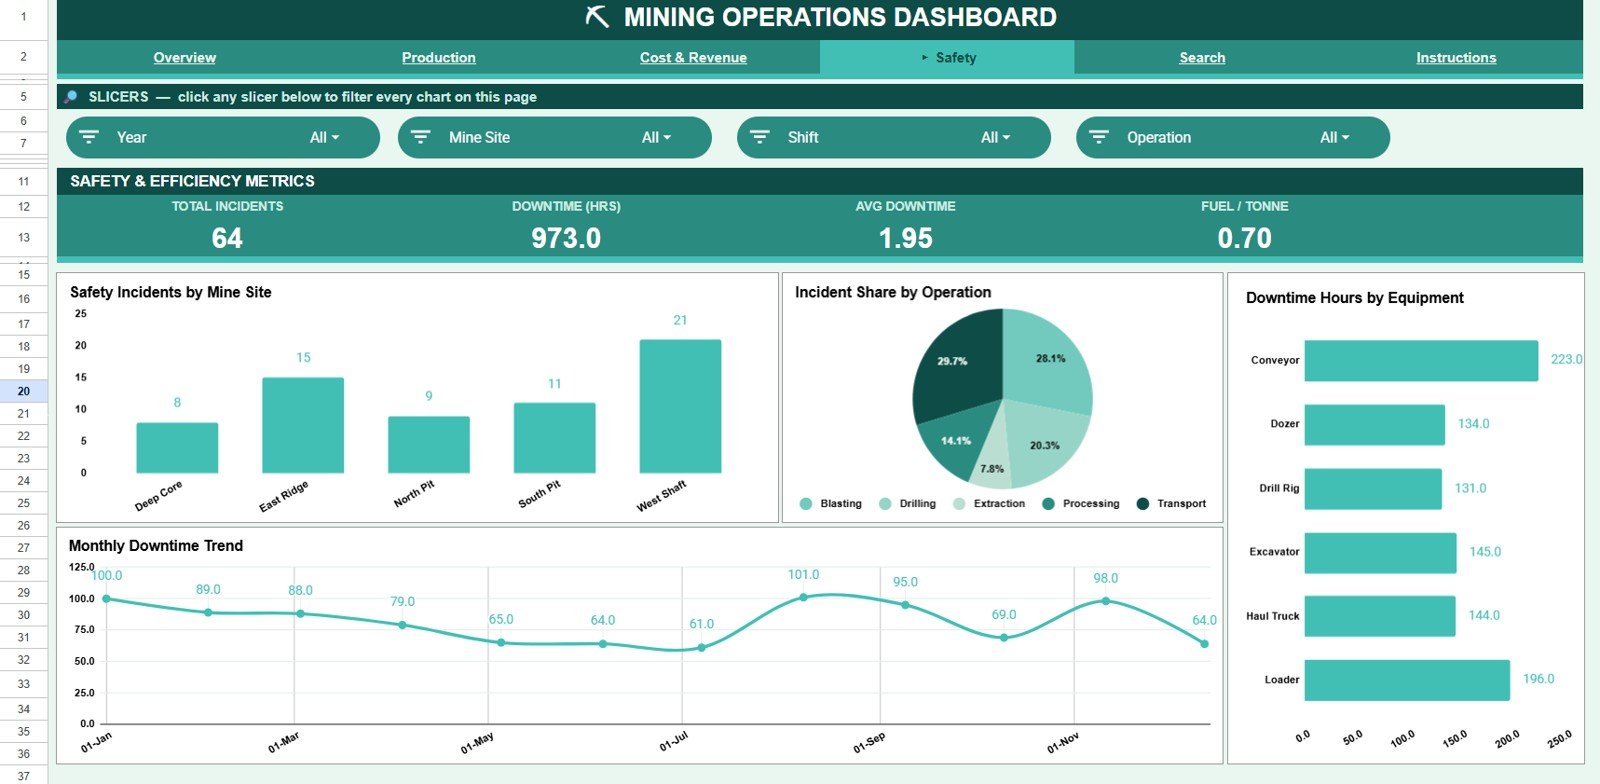
The Safety tab keeps incidents and downtime in view. Charts include Safety Incidents by Mine Site, Incident Share by Operation, Downtime Hours by Equipment, and Monthly Downtime Trend — helping HSE teams target the sites, operations, and machines with the highest risk.
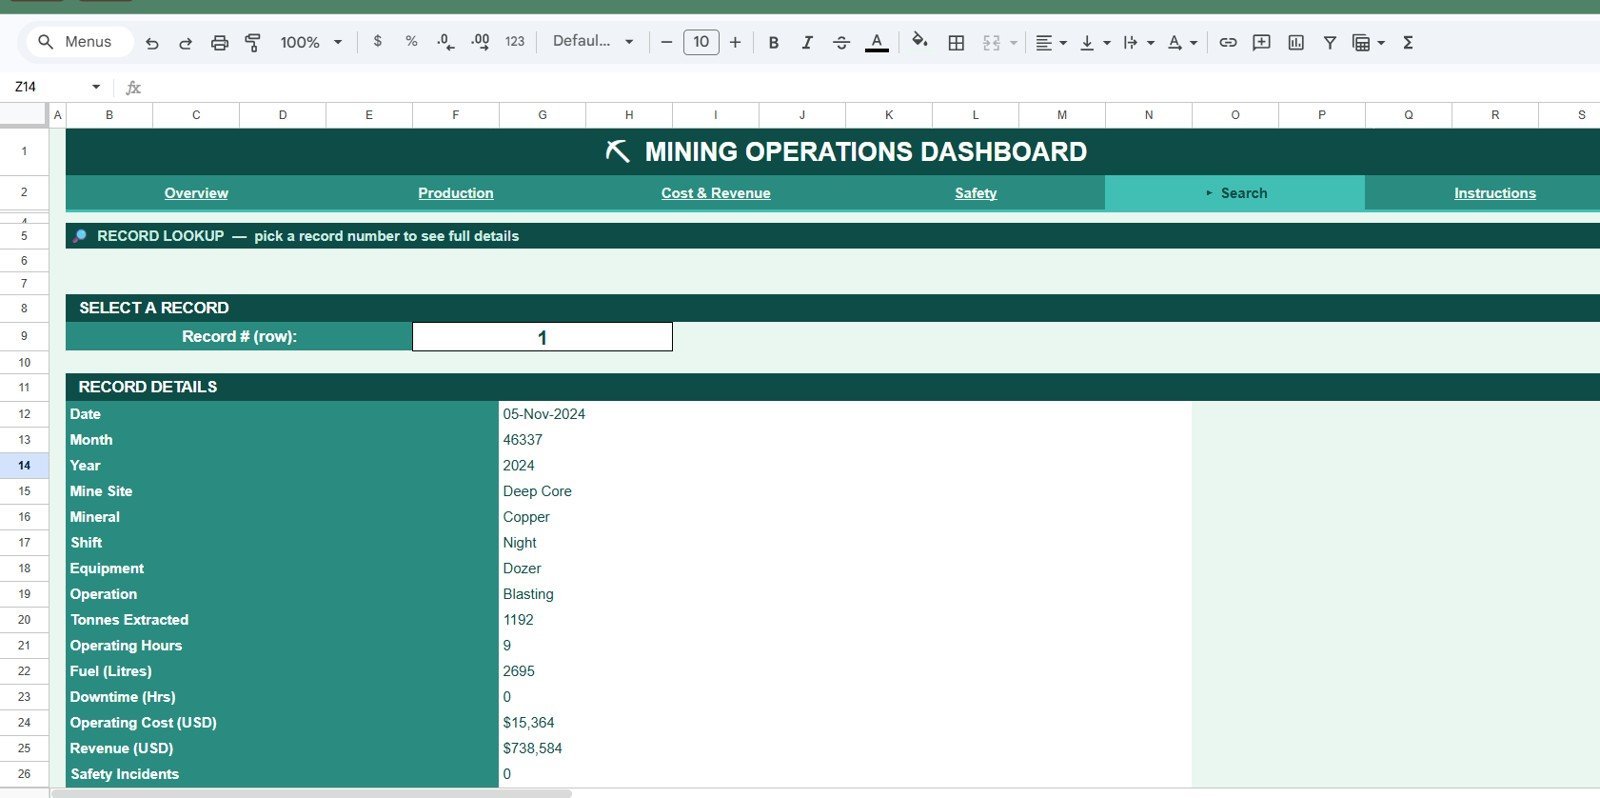
Search Sheet tab
On the Search tab you select a record number and every detail for that entry appears instantly — date, month, year, mine site, mineral, shift, equipment, operation, tonnes extracted, operating hours, fuel, downtime, operating cost, revenue, and safety incidents.
Data Sheet tab
The Data tab is your input sheet — add each new record in the same column format and the dashboard, search, and every chart update automatically. This is the single source the whole workbook reads from.
📊 Mining Operations Dashboard in Google Sheets vs. Excel vs. Paid BI SaaS — Where This Fits
| Feature | Mining Operations Dashboard (Google Sheets) | Microsoft Excel Dashboard | Tableau / Power BI Pro |
|---|---|---|---|
| Cost | $9.99 one-time | $17.99 one-time + Office licence | $14–75 / user / month |
| Platform | Browser — nothing to install ✅ | Desktop Excel required | Desktop + cloud service |
| Setup time | Under 10 minutes ✅ | 10–15 minutes | Hours to days |
| Real-time team collaboration | Yes, built in ✅ | Limited (co-authoring) | Yes (paid seats) |
| Mobile access | Yes, any browser ✅ | Excel mobile app | Vendor mobile app |
| Slicer filtering | Native slicers ✅ | Slicers / timelines | Advanced filters |
| Share with a link | Yes ✅ | File share only | Yes (paid) |
| Year-1 cost at 5 users | $9.99 total ✅ | ~$18 + licences | $840–$4,500 |
For mining teams that want live tonnage, cost, revenue, and safety analysis without paying per-seat BI fees, the Mining Operations Dashboard in Google Sheets sits in the sweet spot.
👥 Who This Template Is For — and Who It’s Not For
✅ This template is built for:
- Mine managers and operations leads tracking output, cost, and safety across multiple sites
- Small and mid-size mining or quarrying firms that want dashboards without a BI licence
- HSE and finance teams who need shareable, browser-based reporting on any device
❌ This template is NOT for:
- Enterprise operations needing live sensor/IoT feeds or SCADA integration
- Teams that require SOC 2, SSO, or row-level security governance
⚙️ How to Use the Mining Operations Dashboard in Google Sheets
- Open your download and click the Google Sheets copy link to save your own editable copy to Google Drive.
- Go to the Data tab and paste your records in the same column order.
- Return to the Overview page and use the slicers to filter by mine site, mineral, shift, or operation.
- Open the Production, Cost & Revenue, and Safety tabs to review the 16 charts.
- Use the Search tab to pull all fields for any single record number.
💼 Real-World Use Cases
Ravi runs operations for a three-site aggregate mining firm. He pastes daily extraction logs into the Data tab and uses the Overview slicers to compare tonnes and operating cost per site before his morning stand-up — without opening a single formula.
Lena is the HSE lead at a mid-size mineral operation. She lives on the Safety tab, watching Safety Incidents by Mine Site and Monthly Downtime Trend to decide where to send her next audit — replacing a manual monthly slide deck.
Marco handles finance for a family quarry business. He uses Revenue vs Cost by Month and Fuel Consumption by Equipment to catch margin slippage early, sharing the sheet with a link instead of paying for BI seats.
❓ Frequently Asked Questions
What KPIs does the Mining Operations Dashboard in Google Sheets track?
The Mining Operations Dashboard in Google Sheets tracks four headline KPIs — Total Tonnes, Total Revenue, Operating Cost, and Safety Incidents — plus 16 charts covering production, cost, revenue, and safety across mine sites, minerals, and equipment. All metrics update automatically when you replace the sample data.
How long does setup take?
Setup takes under 10 minutes. Copy the Mining Operations Dashboard in Google Sheets to your Drive, paste your records into the Data tab in the same column order, and the KPI cards, slicers, search, and every chart update on their own.
Do I need Excel or Power BI to use it?
No. The Mining Operations Dashboard in Google Sheets runs entirely in Google Sheets in the browser, so there is nothing to install and no Excel or Power BI licence required. It opens on any device with a browser.
Can I filter the dashboard by mine site or mineral?
Yes. The Overview page uses native Google Sheets slicers, so you can filter the whole dashboard by mine site, mineral, shift, or operation with one click and see the filtered result instantly.
How does this compare to paid BI SaaS like Tableau or Power BI Pro?
The Mining Operations Dashboard in Google Sheets is a $9.99 one-time purchase with no per-seat fees, versus $14–75 per user per month for tools like Tableau or Power BI Pro. It covers the core tonnage, cost, revenue, and safety views most mining teams need without the subscription.
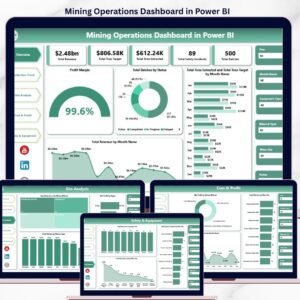
Is this available in Excel or Power BI too?
Yes. The same dashboard is also available as the Mining Operations Dashboard in Excel and the Mining Operations Dashboard in Power BI, so you can pick the platform your team already uses.
👤 About the Author
Built by PK — Microsoft Certified Professional with 15+ years of Excel, Google Sheets, and Power BI experience. Founder of NextGenTemplates, reaching 300K+ subscribers across YouTube channels (@PK-AnExcelExpert, @NextGenTemplates, @NeoTechNavigators). Every template is hand-built and tested before release.
🔗 Explore Related Templates
Prefer a broader operational view? Try the Integrated Mining Operations Dashboard in Google Sheets or the simpler Mining Dashboard in Google Sheets. For upstream logistics, see the Supply Chain Management Dashboard in Google Sheets. Browse more Google Sheets Dashboards.
Also available as: Excel version · Power BI version.
📖 Click here to read the Detailed Blog Post<
Watch the step-by-step video Demo:
/h3>
🎥 Visit our YouTube channel for step-by-step video tutorials
👉 YouTube.com/@NextGenTemplates


Reviews
There are no reviews yet.