

The Podcast Audience Insights Dashboard in Google Sheets tracks 6 headline KPI cards, 30 chart views, 6 working sheet tabs, and multi-slicer filtering for downloads, listeners, completion rate, subscriber growth, episode ratings, audience demographics, campaigns, sponsors, and revenue. For $9.99 one-time, it gives podcast teams a shareable Google Sheets analytics system without paying $20-$200 per month for fragmented podcast reporting tools. Join 8,400+ teams in 40+ countries using NextGenTemplates to replace subscription dashboards with editable templates they control.
Instant download. One-time payment. No subscription. No per-user fees. Lifetime access.
Key Features of Podcast Audience Insights Dashboard in Google Sheets
- 6 overview KPI cards for Total Downloads, Total Listeners, Average Listening Time, Completion Rate, Subscriber Growth, and Average Episode Rating.
- 5 analysis pages covering overview, listener demographics, episode performance, marketing channels, and revenue or sponsor insights.
- 30 chart views across categories, platforms, age groups, devices, countries, episodes, sources, campaigns, sponsors, regions, and months.
- Interactive slicers let you filter the dashboard quickly by podcast segment, platform, region, campaign, sponsor, or time period.
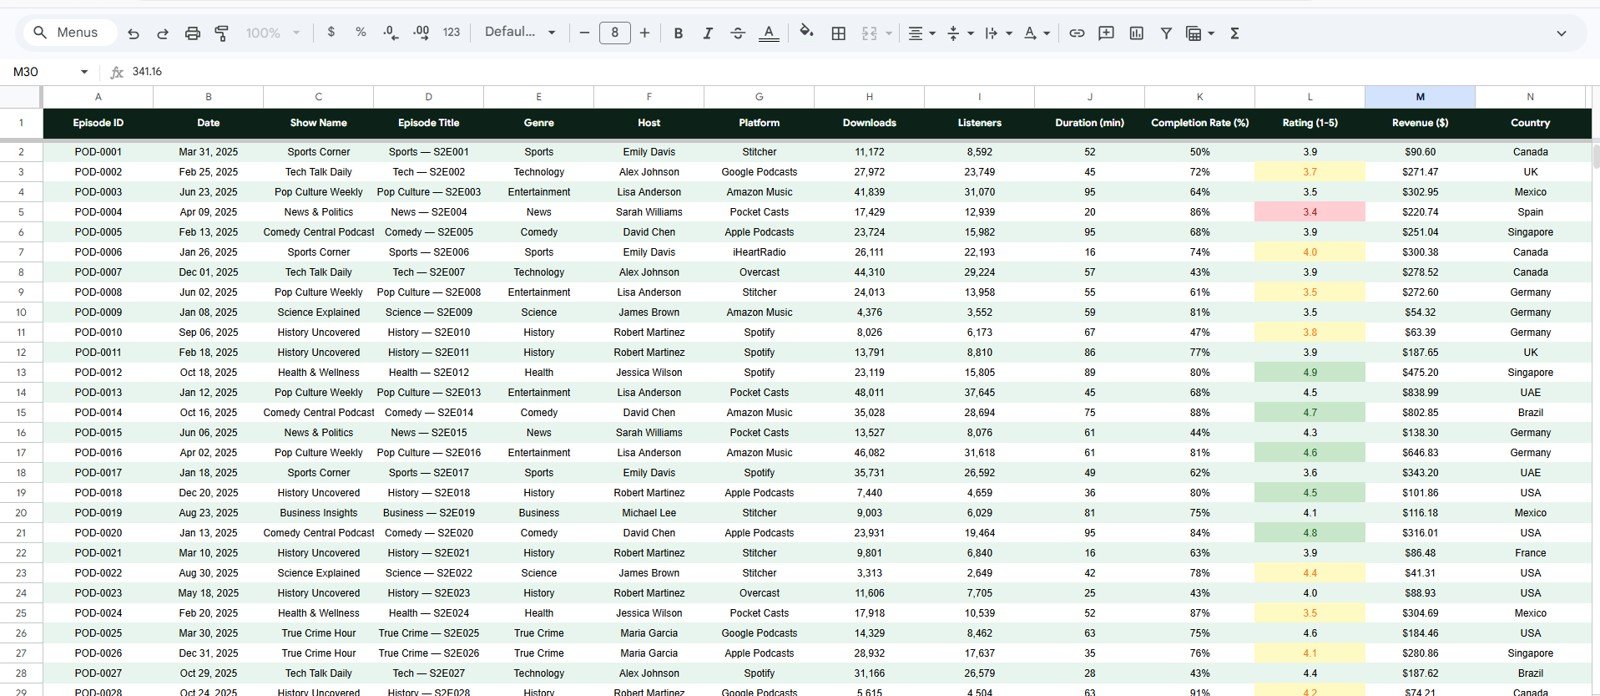
- Data Sheet included so users can paste their podcast records in the same structured format and refresh the dashboard.
- Search Sheet workflow helps users find specific audience records, episode names, platforms, campaigns, sponsors, or listener segments.
- Google Sheets collaboration makes the file easy to share with co-hosts, agencies, sponsors, or leadership through Google Drive.
What’s Inside the Podcast Audience Insights Dashboard in Google Sheets
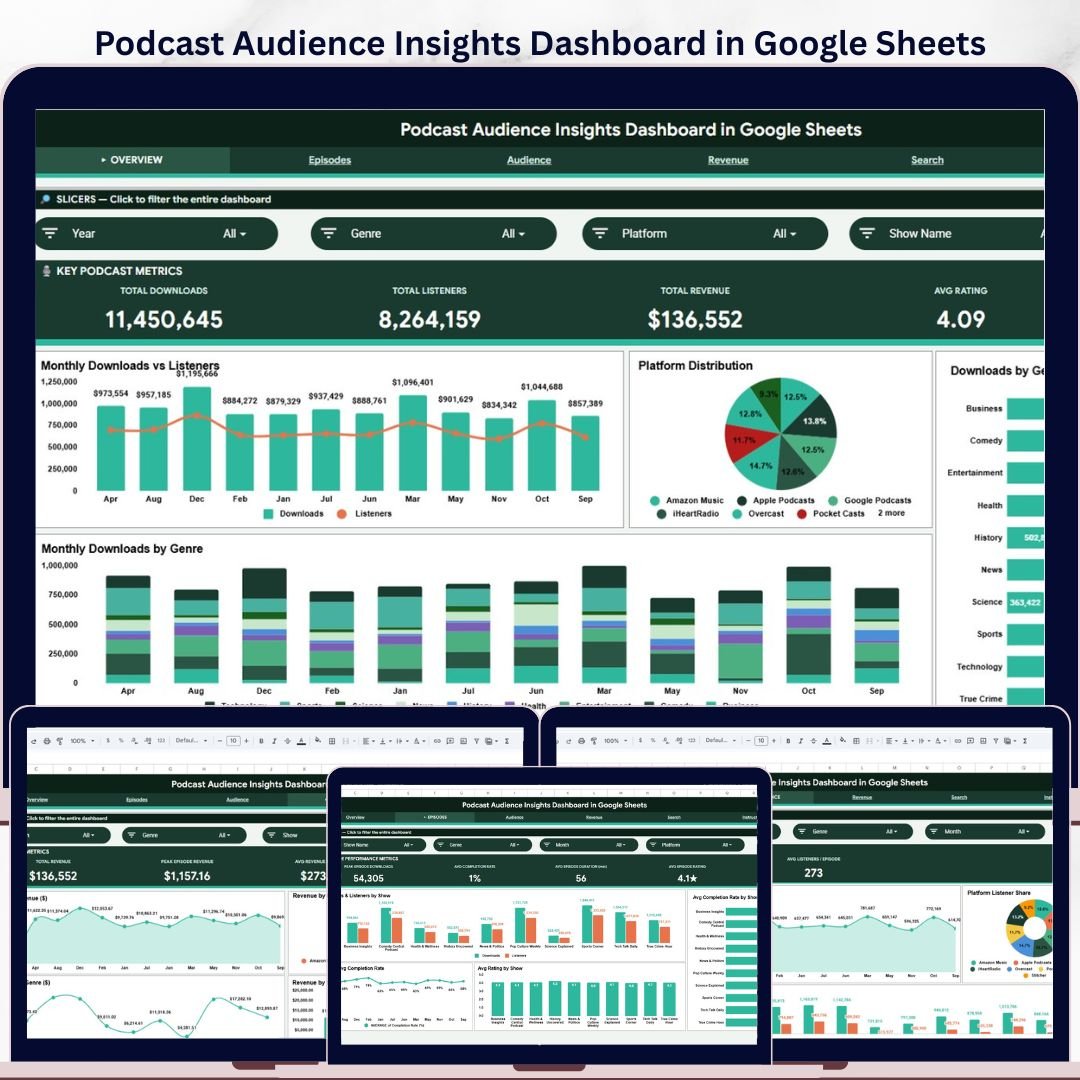
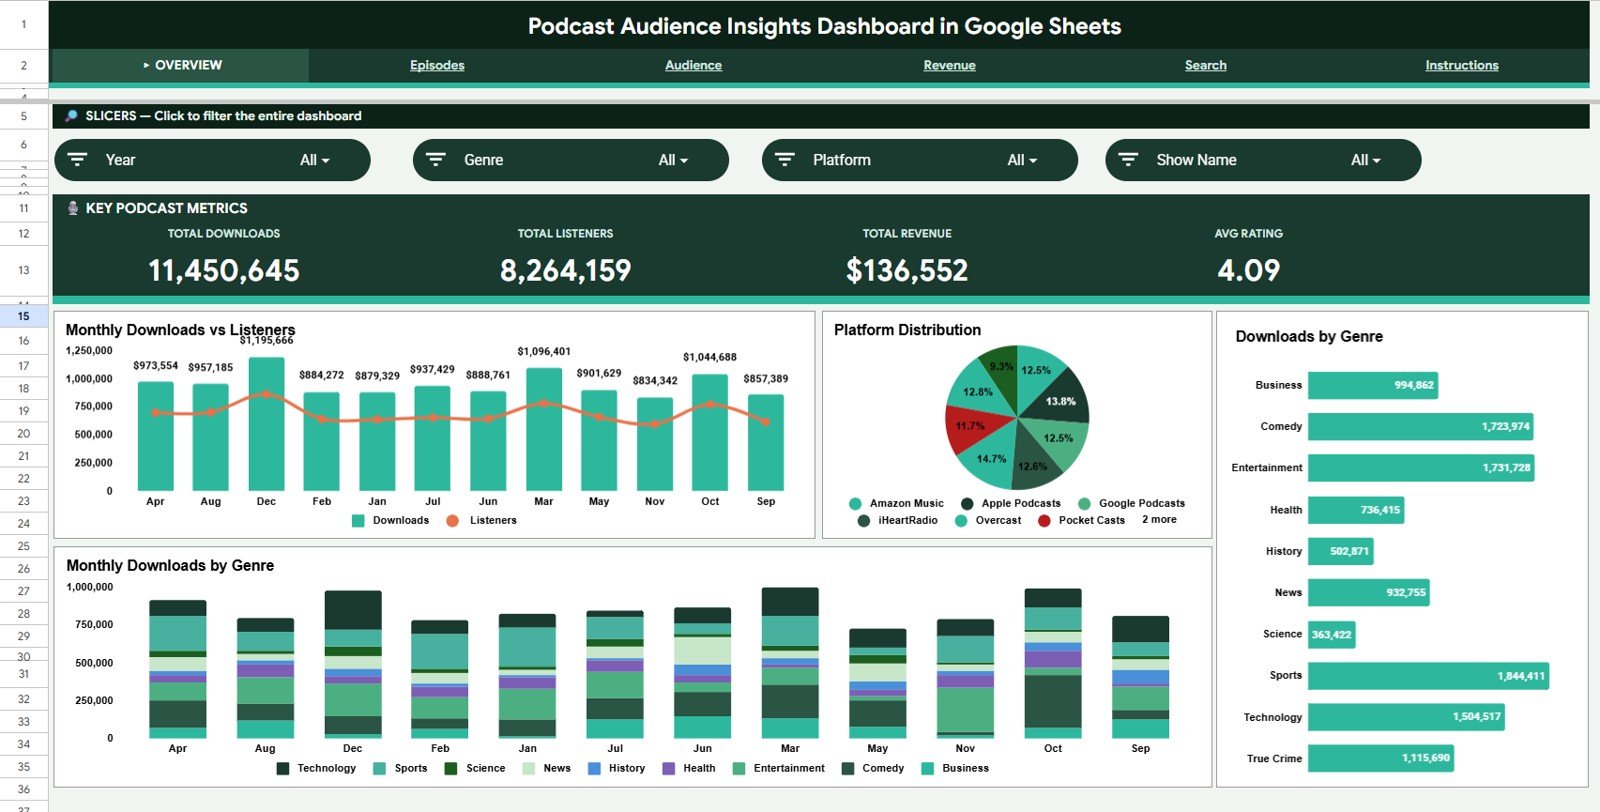
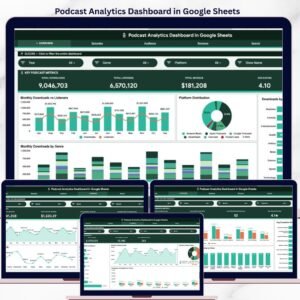
1. Overview Page
The Overview page gives a fast executive snapshot of podcast performance. KPI cards show Total Downloads, Total Listeners, Average Listening Time, Completion Rate, Subscriber Growth, and Average Episode Rating, while slicers help users filter the full dashboard in seconds.
The chart set includes Downloads by Episode Category, Listeners by Platform, Completion Rate by Episode, Audience Share by Age Group, Subscriber Growth by Month, and Engagement by Region. Together, these visuals show what content is growing, which platforms matter most, and where audience attention is strongest.
Podcast Audience Insights Dashboard in Google Sheets
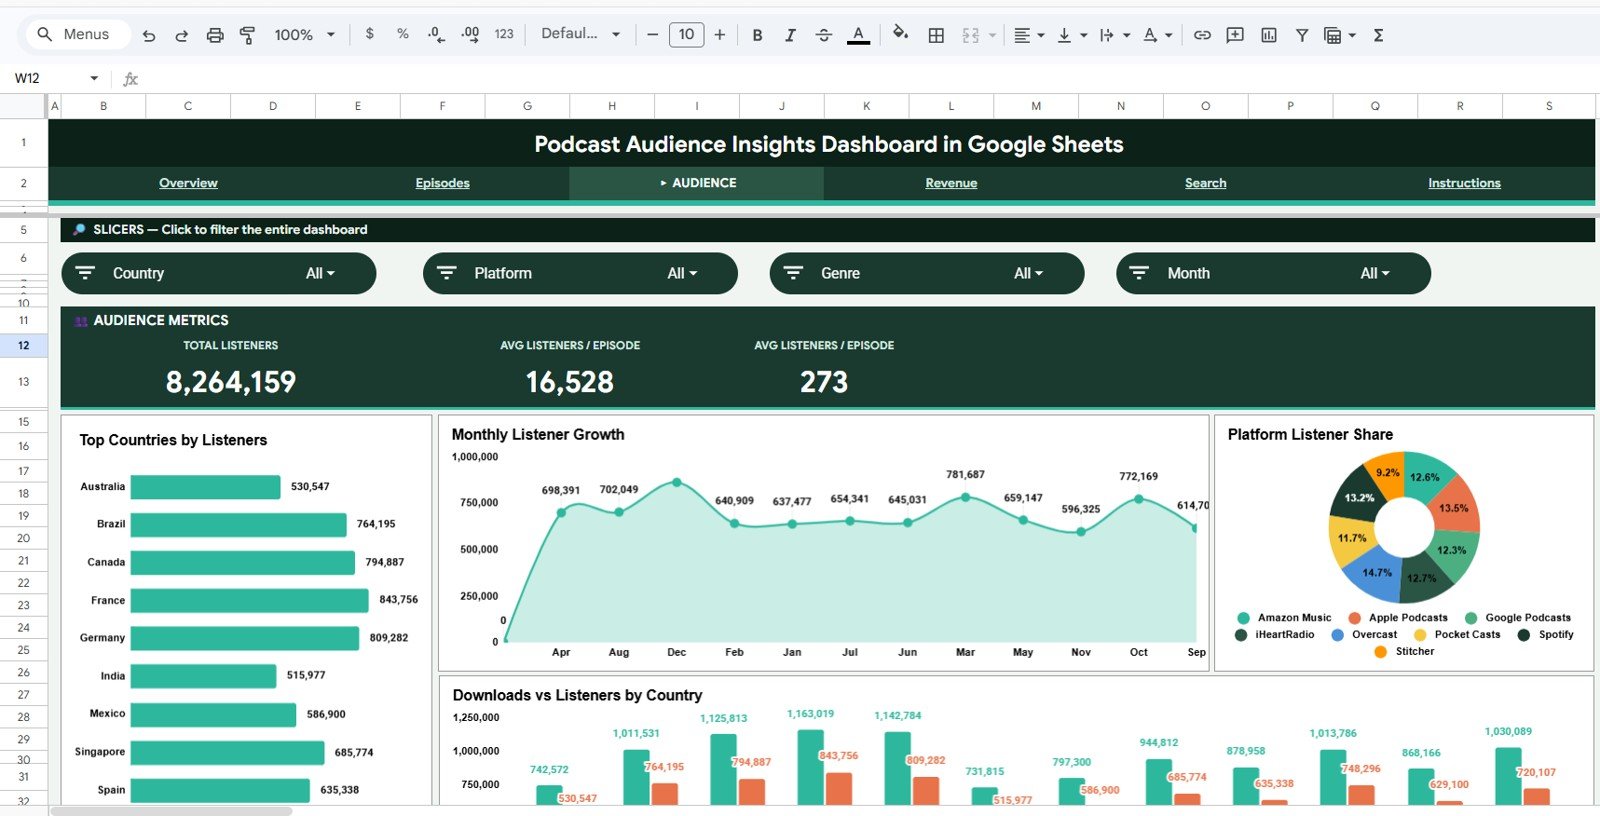
2. Listener Demographics
The Listener Demographics tab explains who listens to the podcast and how those listeners engage across devices, platforms, countries, and regions. It includes Listeners by Age Group, Listeners by Gender, Listening Hours by Country, Listeners by Device, Average Listening Time by Region, and Audience Share by Platform.
Listener Demographics
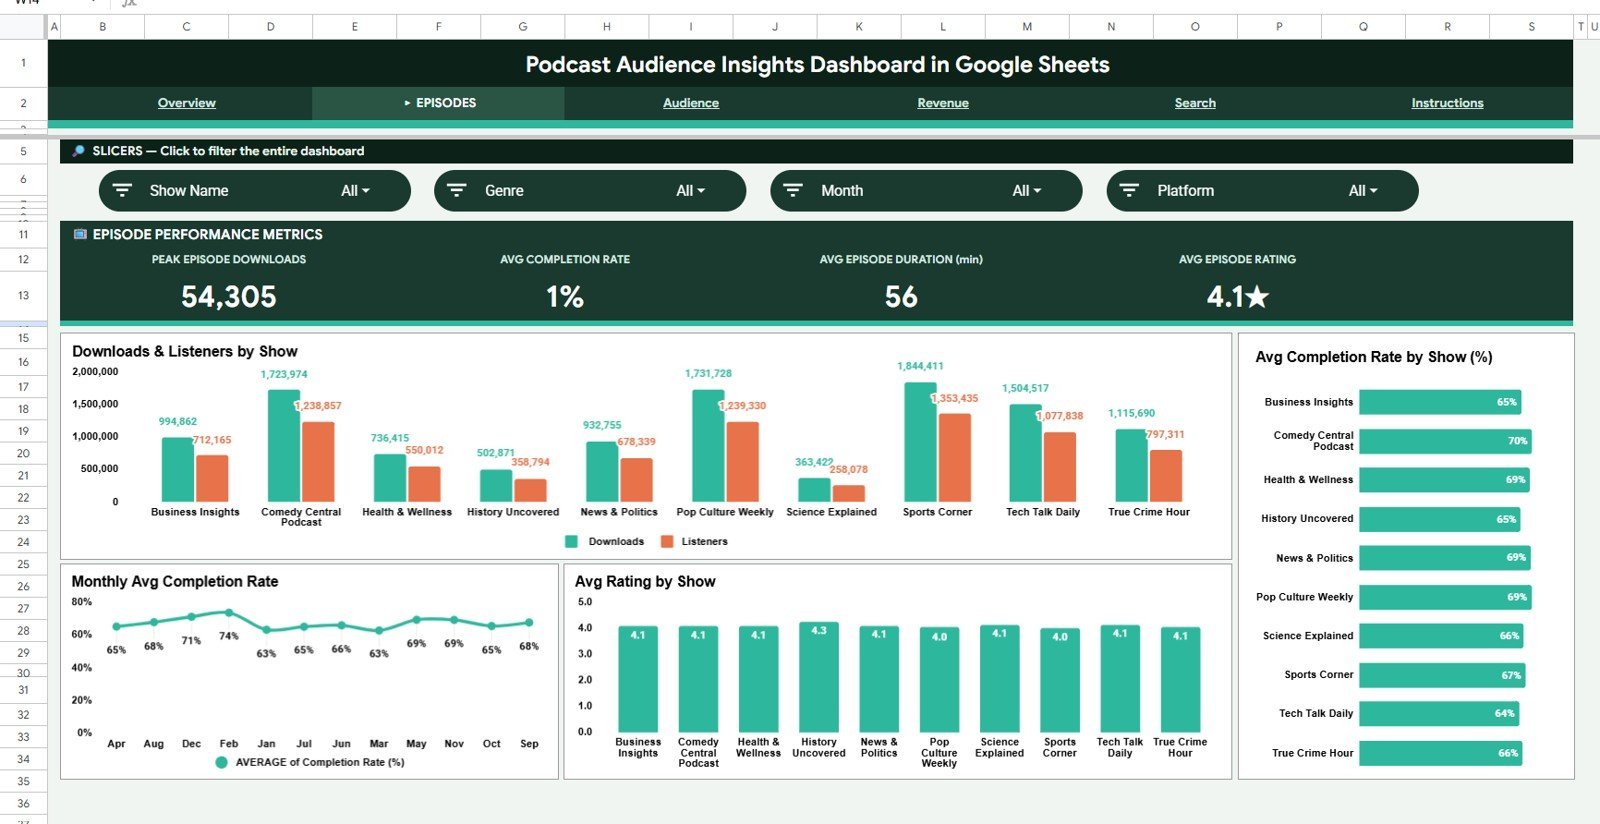
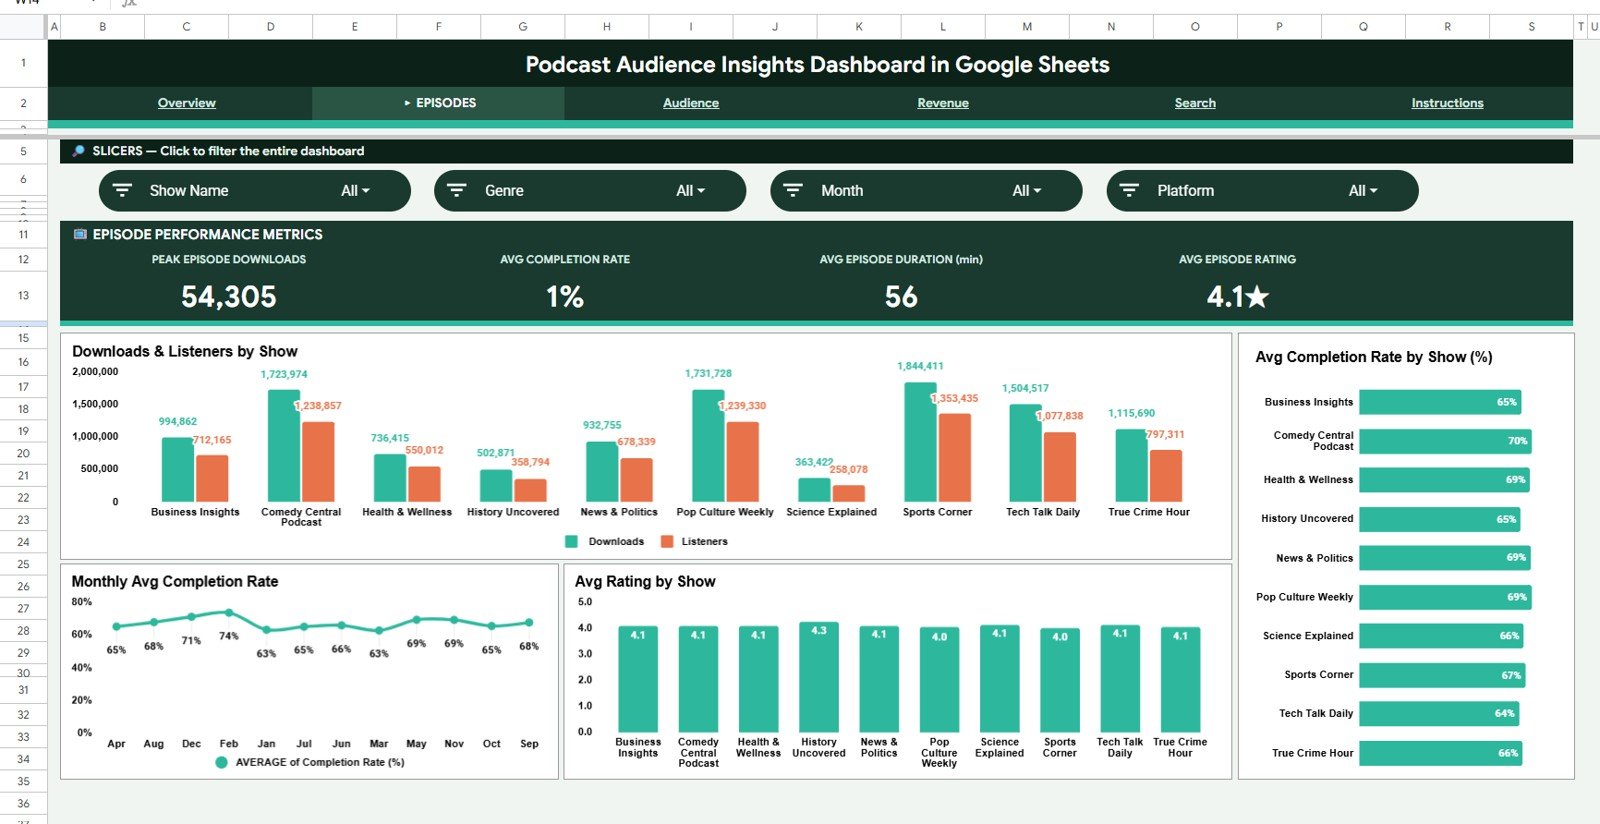
3. Episode Performance
The Episode Performance tab is built for content review. It helps podcasters compare Downloads by Episode, Completion Rate by Episode, Average Listening Time by Episode, Engagement Rate by Episode Category, Listener Drop-off by Episode Length, and Ratings by Host.
Episode Performance
4. Marketing Channel Insights
The Marketing Channel Insights tab connects promotion activity to listener growth. It tracks New Subscribers by Source, Website Visits by Campaign, Conversion Rate by Referral Channel, Social Engagement by Platform, Email Clicks by Campaign, and Audience Growth by Month.
Marketing Channel Insights
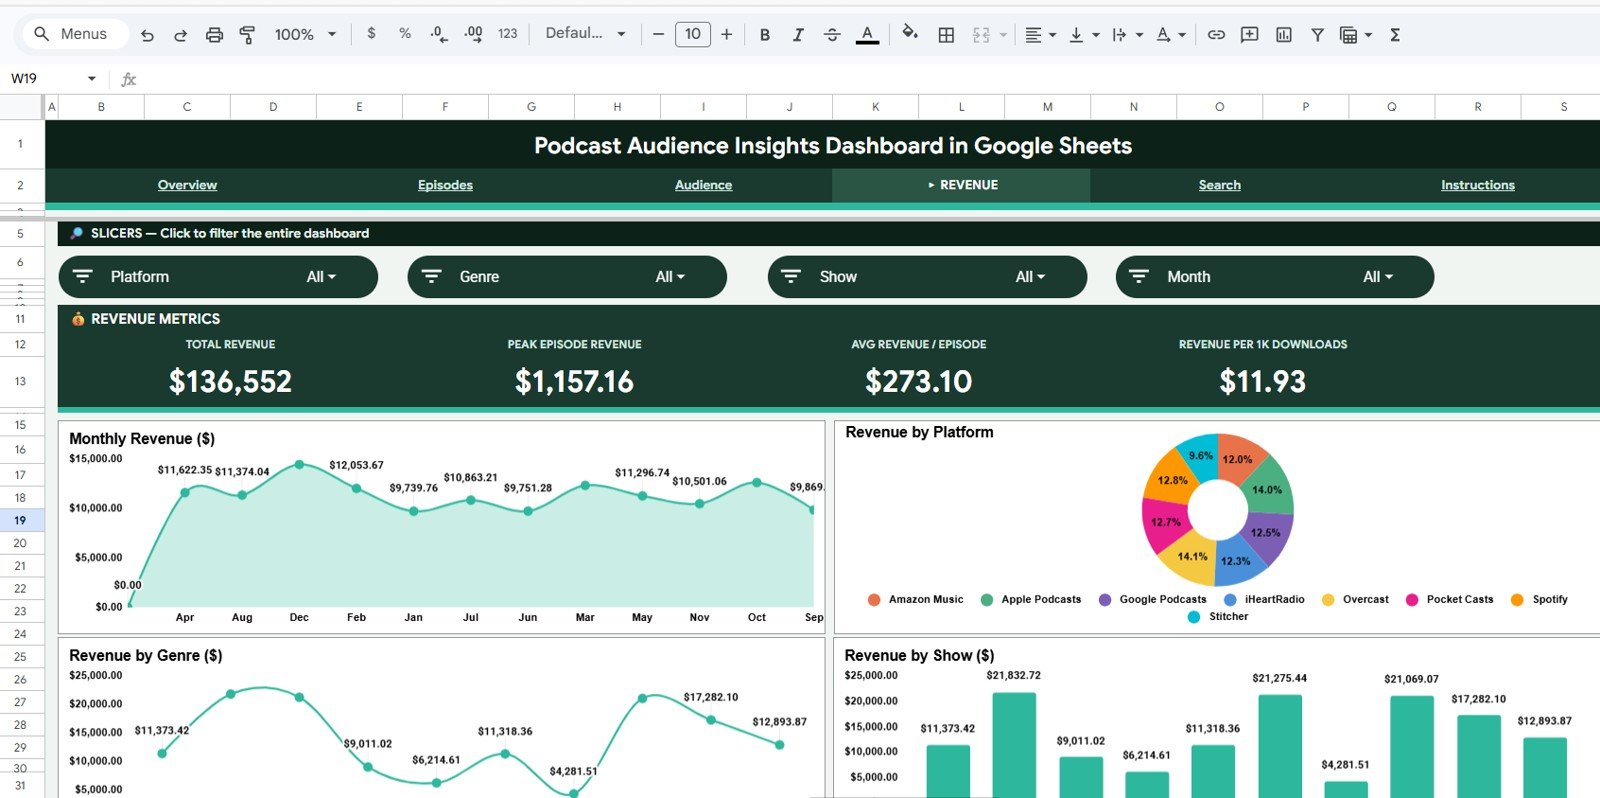
5. Revenue and Sponsor Insights
The Revenue and Sponsor Insights tab gives commercial visibility for podcasters, media teams, and agencies. It includes Revenue by Sponsor, Revenue by Episode Category, Ad Impressions by Platform, Revenue per Listener by Month, Sponsor Clicks by Campaign, and CPM by Platform.

Revenue and Sponsor Insights
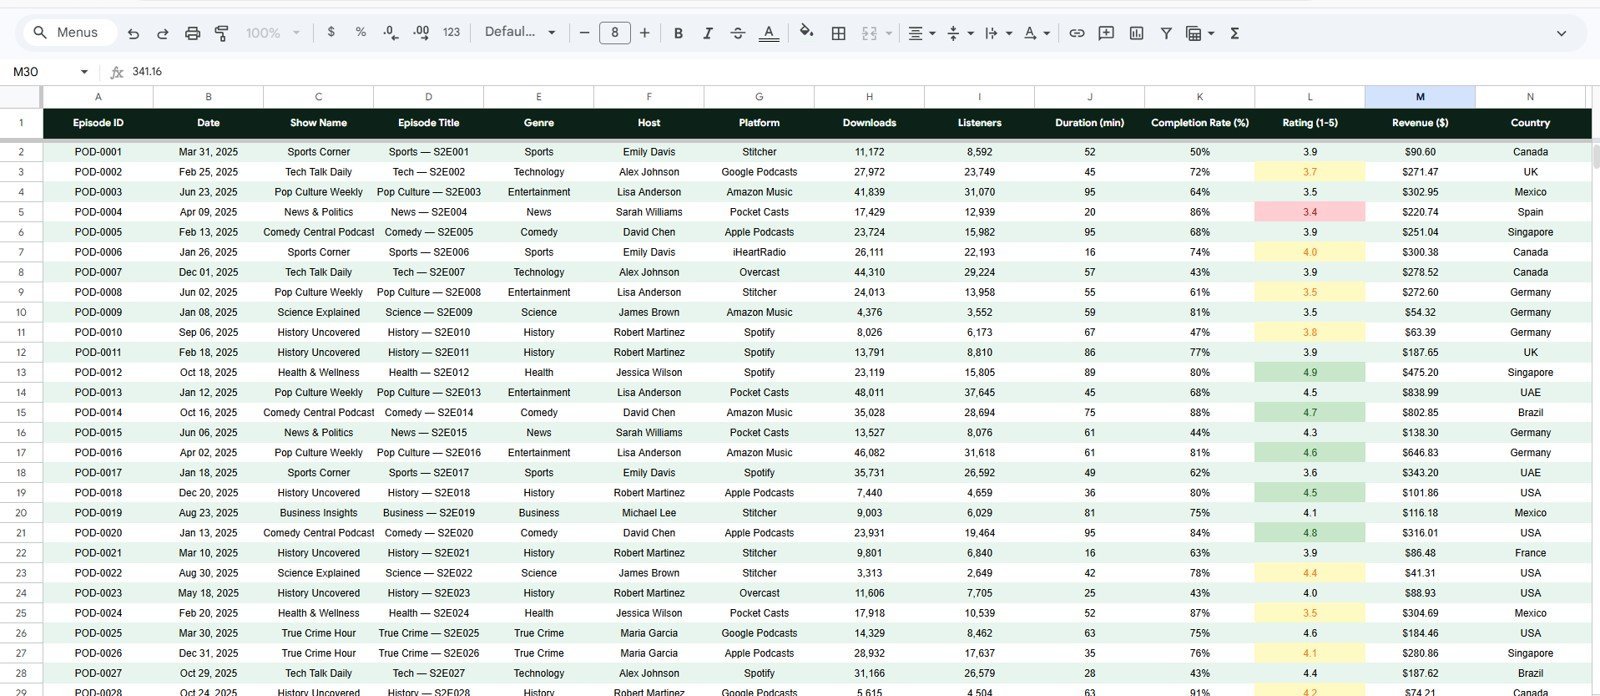
6. Data Sheet Tab
The Data Sheet is the structured input tab. Users enter or paste podcast records in the same format, then the dashboard pages update from that source data.
Data Sheet tab
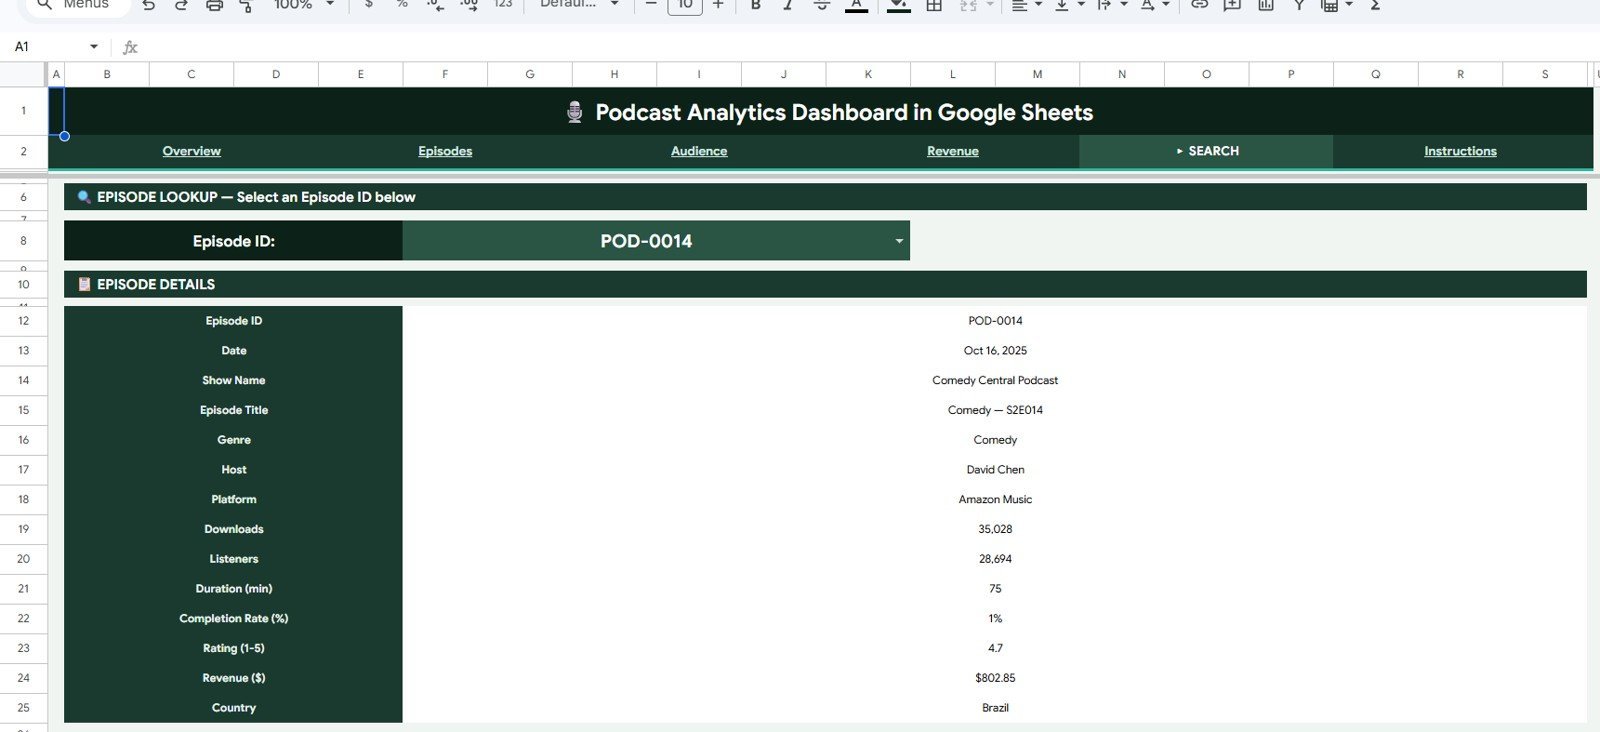
7. Search Sheet Tab
The Search Sheet helps users find specific podcast audience records, episode names, platforms, campaigns, sponsors, regions, or listener segments quickly from the Google Sheets dashboard. This is useful during sponsor calls, content planning meetings, and monthly performance reviews.
Podcast Audience Insights Dashboard in Google Sheets vs. Microsoft Excel Dashboard vs. Paid Podcast SaaS – Where This Fits
| Feature | This Google Sheets Dashboard | Microsoft Excel Dashboard | Paid Podcast SaaS |
|---|---|---|---|
| Cost | $9.99 one-time | $9.99-$17.99 one-time | $20-$200/month |
| Platform | Google Sheets in browser | Excel desktop or web | Vendor cloud app |
| Setup time | Under 10 minutes | Under 10 minutes | Hours or days of configuration |
| Real-time team collaboration | Native Google Drive sharing | Needs OneDrive or SharePoint | Often seat-based |
| Mobile access | Google Sheets app | Excel mobile with limits | Usually available |
| Customizable fields | Fully editable sheet structure | Fully editable workbook | Limited by vendor settings |
| Share with link | Yes, viewer or editor access | Possible through cloud storage | Usually paid user seats |
| Year-1 cost at 5 users | $9.99 total | $9.99-$17.99 total | $1,200-$12,000 |
| Sponsor and campaign views | Included | Possible with custom sheets | Often split across tools |
| Data ownership | 100% in your Google Drive | 100% in your workbook | Vendor-hosted |
Who This Template Is For – and Who It’s Not For
This template is built for:
- Independent podcasters tracking listeners, downloads, completion, ratings, and subscriber growth.
- Podcast agencies preparing monthly reports for hosts, sponsors, or clients.
- Content marketing teams using podcast episodes as a lead generation and audience-building channel.
- Media teams that prefer a shareable Google Sheets Dashboard template instead of a paid analytics platform.
It is not for:
- Teams that need automated API ingestion from every podcast platform.
- Enterprise networks that require IAB-certified download deduplication or legal-grade ad attribution.
- Users who do not want to maintain a structured data sheet.
How to Use the Podcast Audience Insights Dashboard in Google Sheets
- Open the PDF guide from your download and click the Google Sheets copy link.
- Create your own editable copy in Google Drive.
- Go to the Data Sheet tab and replace the sample data with your podcast audience records.
- Review the Overview page for headline KPIs and audience trends.
- Use slicers to filter by platform, category, region, sponsor, campaign, or month.
- Use the Search Sheet to locate a specific record, campaign, sponsor, episode, or listener segment.
Real-World Use Cases
Maya, an independent podcaster, uses the dashboard after every monthly export to see which episode category drives the best completion rate and which platform brings the most listeners.
Rahul, a content marketing manager, reviews Marketing Channel Insights before assigning ad spend to email, referral, and social campaigns.
Elena, a podcast agency analyst, uses Revenue and Sponsor Insights to prepare sponsor reports covering revenue, ad impressions, CPM, and sponsor clicks.
Frequently Asked Questions
What does the Podcast Audience Insights Dashboard in Google Sheets track?
It tracks downloads, listeners, listening time, completion rate, subscriber growth, episode ratings, demographics, campaign performance, sponsor activity, and revenue views.
Does this dashboard work only for one podcast?
No. You can use it for one podcast, a podcast network, or multiple client podcasts as long as your Data Sheet contains consistent podcast, episode, platform, region, campaign, and sponsor fields.
Do I need advanced Google Sheets skills?
No. The dashboard is designed for data entry and filtering. Replace sample data in the same format, then use the pre-built pages and slicers.
Can I share this dashboard with sponsors?
Yes. Since it runs in Google Sheets, you can share a view-only link with sponsors, managers, advertisers, or co-hosts.
Does it connect directly to Spotify or Apple Podcasts?
No. This template uses manual data entry or pasted exports. That keeps it affordable, editable, and platform-neutral.
Can I customize the charts?
Yes. You can duplicate sheets, adjust chart ranges, add your own metrics, or extend the Data Sheet fields if your reporting process needs more detail.
About the Author
Built by PK – Microsoft Certified Professional with 15+ years of Excel, Google Sheets, and Power BI experience. Founder of NextGenTemplates, reaching 300K+ subscribers across YouTube channels. Every template is hand-built and tested before release.
Explore Related Templates
Podcast Performance KPI Dashboard in Google Sheets – KPI scorecard-style tracking for podcast performance.
Content Creator Revenue Dashboard in Google Sheets – revenue tracking for podcasts, YouTube, blogs, and creator channels.
Podcast Analytics Dashboard in Power BI – Power BI version for teams that prefer DAX-driven reporting.
Browse more Google Sheets templates and Google Sheets Dashboard templates.
Ready to understand your podcast audience clearly? Use the Podcast Audience Insights Dashboard in Google Sheets to turn downloads, listeners, sponsors, and campaigns into a simple reporting workflow.
Last updated: May 2026


Reviews
There are no reviews yet.