
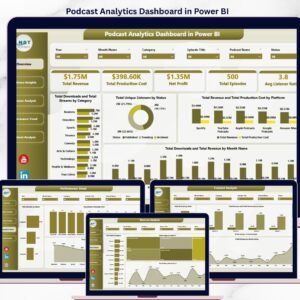
The Podcast Analytics Dashboard in Power BI tracks 5 headline KPIs across 5 interactive report pages, with 12 analytical charts and multi-dimension slicers covering platform, category, podcast, host, season, status, distribution channel, and month. Setup takes under 10 minutes — connect your data source, click Refresh, and every visual recalculates automatically using DAX measures.
🌍 Join 8,400+ teams in 40+ countries using NextGenTemplates to replace paid podcast analytics SaaS tools with one-time-purchase Power BI, Excel, Google Sheets, and HTML templates.
✅ Instant download · One-time payment · No subscription · No per-user fees · Lifetime access
Podcast Analytics Dashboard in Power BI
🔑 Key Features of the Podcast Analytics Dashboard in Power BI
🔹 5 interactive report pages — Overview, Audience Insights, Revenue Analysis, Performance Trend, and Content Analysis, each with its own visual set and cross-page slicer panel that filters every page in sync.
🔹 5 headline KPI cards on the Overview page — Total Revenue, Total Production Cost, Net Profit, Total Episodes, and Avg Listener Rating update in real time as filters are applied across the report.
🔹 DAX-driven measures — every KPI and chart is powered by reusable DAX expressions on the data model, so you can extend the analysis without rebuilding visuals from scratch.
🔹 Multi-dimension slicers on platform, category, podcast name, host, season, status, distribution channel, and month let you drill into any segment in one click.
🔹 Profit margin lens built across platform, season, and month dimensions exposes which channels and timeframes actually convert listener growth into bottom-line profit.
🔹 Power BI Desktop compatible — opens cleanly in the free Microsoft Power BI Desktop application; no Pro license required to view or edit the .pbix file.
📦 What’s Inside the Podcast Analytics Dashboard in Power BI
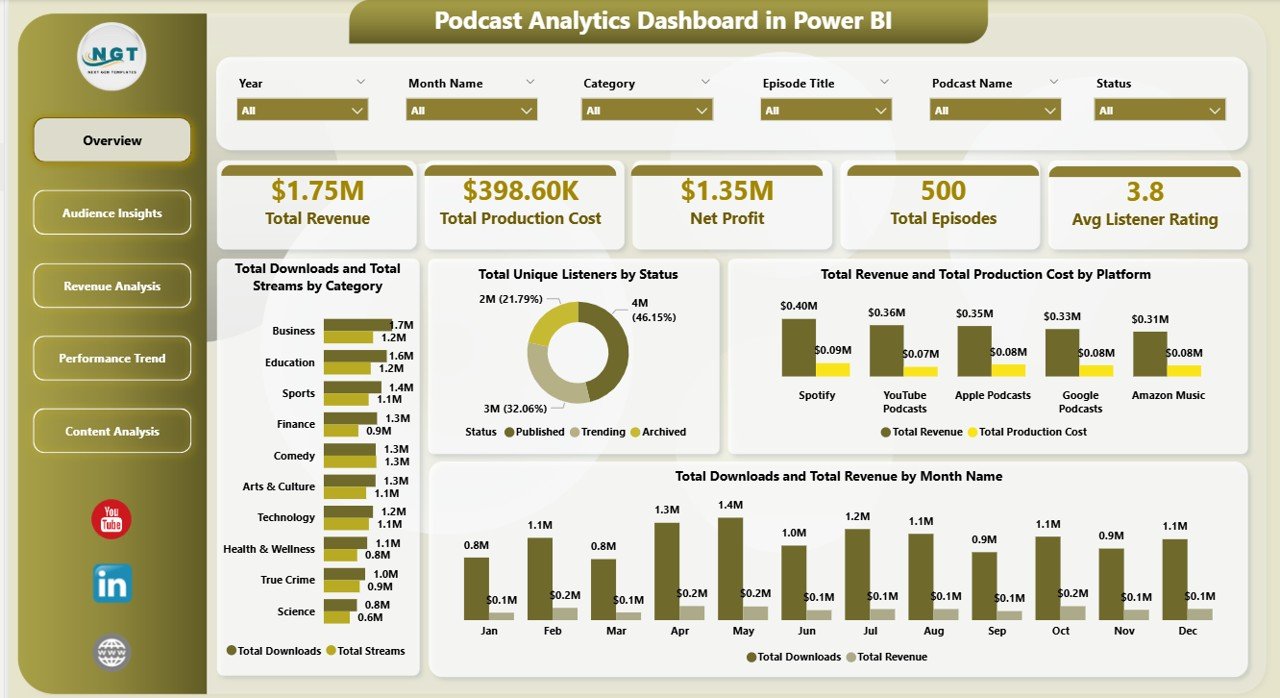
1. Overview Page — the landing report with 5 KPI cards (Total Revenue, Total Production Cost, Net Profit, Total Episodes, Avg Listener Rating) plus 4 summary charts:
🔹 Total Downloads and Total Streams by Category — compares download-first vs. stream-first consumption across each podcast category.
🔹 Total Unique Listeners by Status — segments your audience by episode publishing status to reveal where your distinct reach is concentrated.
🔹 Total Revenue and Total Production Cost by Platform — exposes which distribution platforms deliver positive margin and which ones absorb production budget.
🔹 Total Downloads and Total Revenue by Month Name — a dual-series monthly trend that shows whether download growth is converting into revenue growth period over period.
Audience Insights
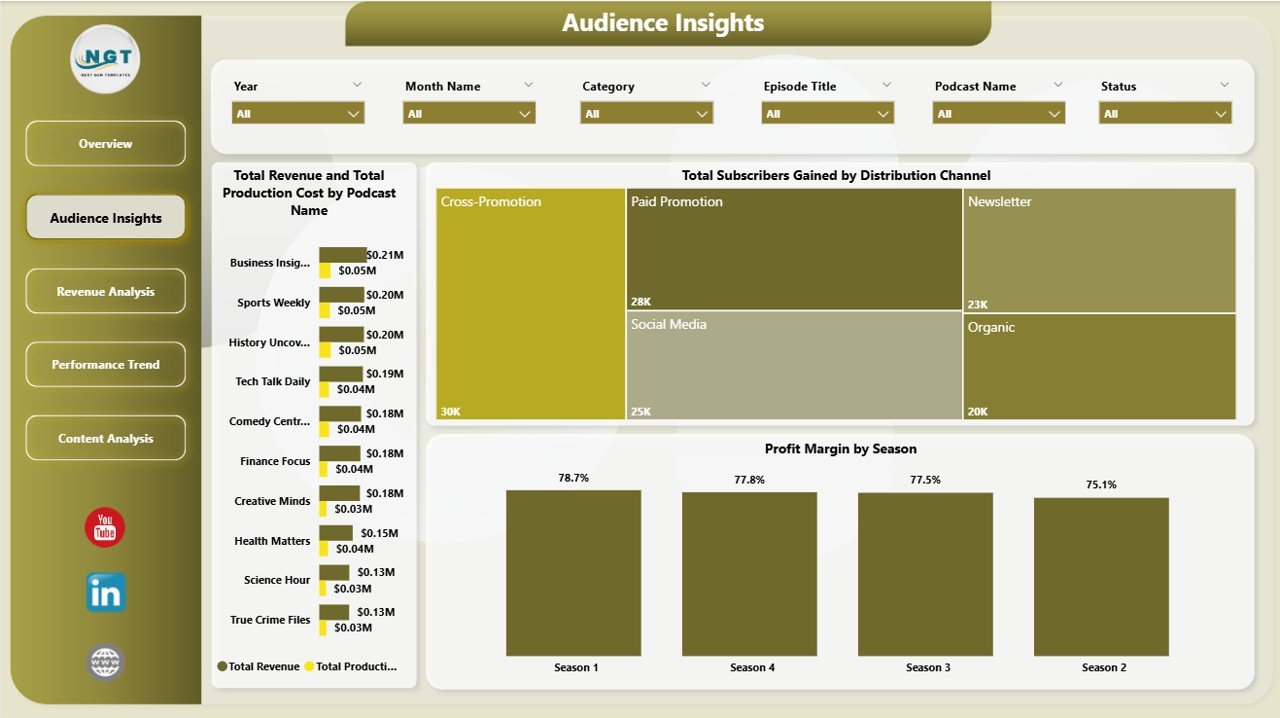
2. Audience Insights — 3 analyses that profile who listens and how the audience grows:
🔹 Total Revenue and Total Production Cost by Podcast Name — show-by-show profitability comparison to decide which formats deserve more investment.
🔹 Total Subscribers Gained by Distribution Channel — ranks channels by net subscriber acquisition so you know where to focus growth budget.
🔹 Profit Margin by Season — season-level margin percentage that signals format fatigue or improvement across multi-season shows.
Revenue Analysis
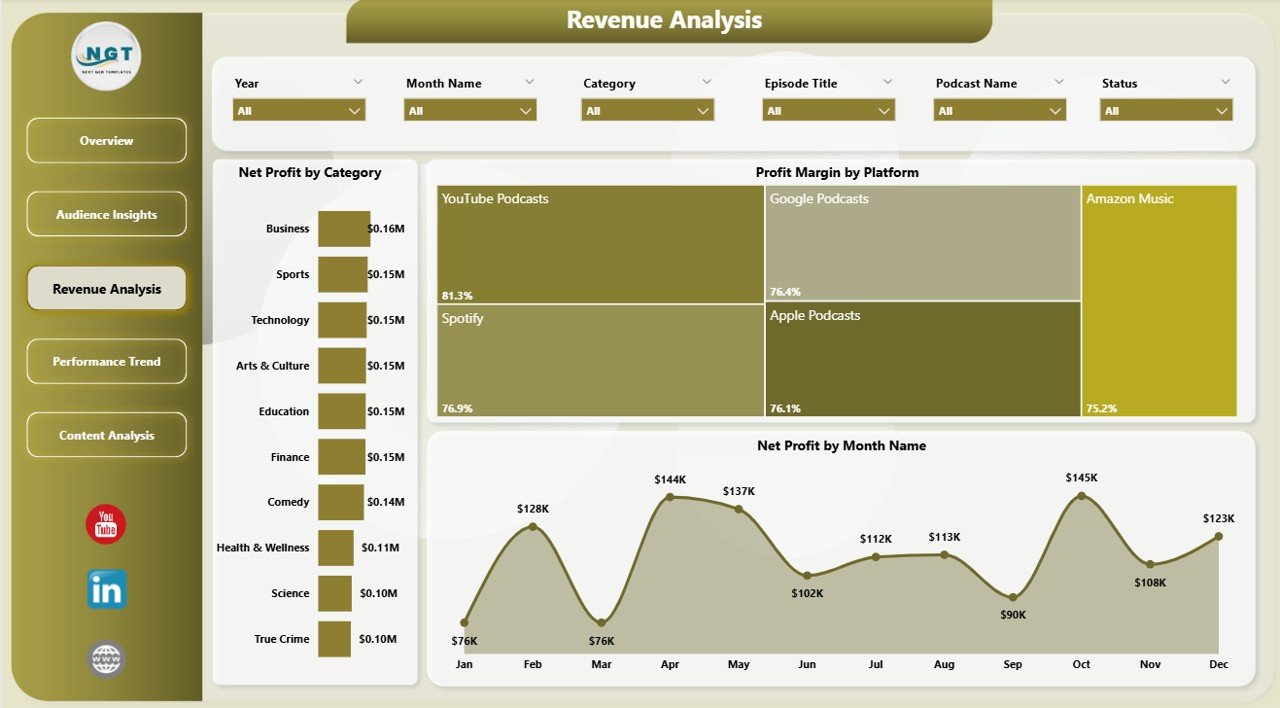
3. Revenue Analysis — 3 monetization-focused charts:
🔹 Net Profit by Category, Profit Margin by Platform, and Net Profit by Month Name — together these reveal whether your monetization curve is scaling with audience growth or whether margin is being squeezed as you scale.
Performance Trend
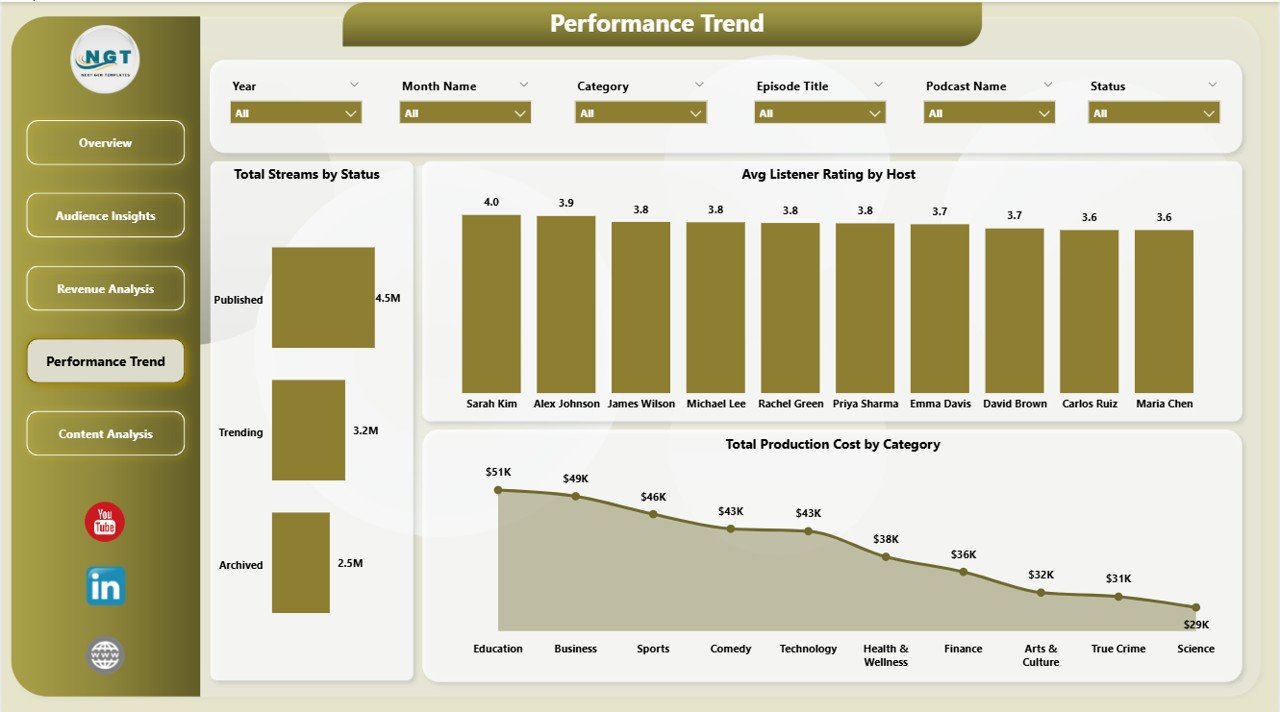
4. Performance Trend — 3 operational-review analyses:
🔹 Total Streams by Status, Avg Listener Rating by Host, and Total Production Cost by Category — useful for host evaluation, stream-state planning, and category cost greenlighting.
Content Analysis
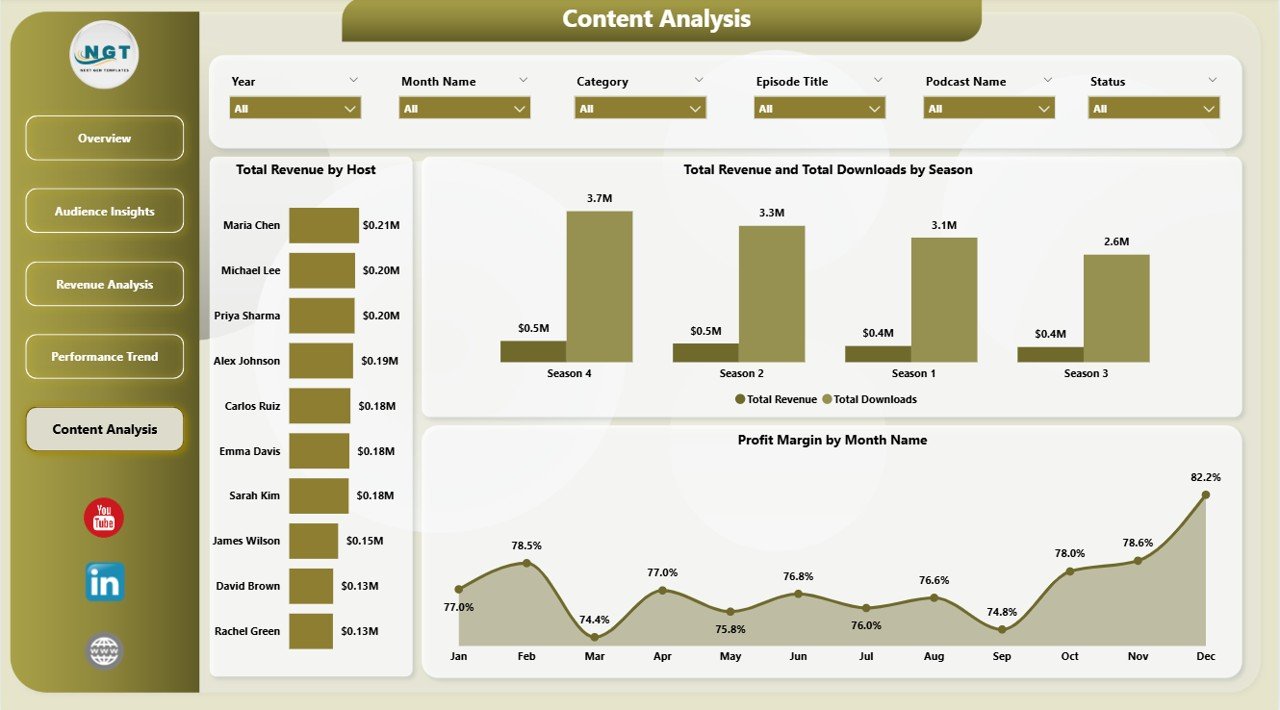
5. Content Analysis — 3 editorial-focused charts:
🔹 Total Revenue by Host, Total Revenue and Total Downloads by Season, and Profit Margin by Month Name — connects content output volume to commercial outcomes at host, season, and month level.
📊 Podcast Analytics Dashboard in Power BI vs. Excel Equivalent vs. Chartable / Podtrac SaaS — Where This Fits
| Feature | Podcast Analytics Dashboard in Power BI | Excel Equivalent | Chartable / Podtrac |
|---|---|---|---|
| Cost | $17.99 one-time | $17.99 one-time | $40–$300 / month |
| Platform | Power BI Desktop (free) | Microsoft Excel 2016+ | Cloud SaaS |
| Setup time | Under 10 minutes | Under 10 minutes | 2–5 days |
| Cross-page synchronized slicers | ✅ Native | Per-sheet only | ✅ |
| DAX measures (fully editable) | ✅ | Pivot formulas only | ❌ Locked logic |
| Mobile access | ✅ Power BI mobile app | Excel mobile | ✅ |
| Data ownership | ✅ 100% on your machine | ✅ 100% on your machine | ❌ Vendor-hosted |
| Year-1 cost at 5 users | $17.99 total | $17.99 total | $2,400–$18,000 |
| Custom DAX extensions | ✅ Add your own measures | Limited to formulas | ❌ No code access |
For podcast networks that want a fully editable, DAX-extensible analytics layer without paying $200+/month, the Podcast Analytics Dashboard in Power BI sits in the sweet spot.
👥 Who This Template Is For — and Who It’s Not For
✅ This template is built for:
- Independent podcasters running 1–10 shows who want one Power BI report covering downloads, revenue, cost, and listener metrics
- Podcast network operators managing a portfolio of hosts, seasons, and platforms in a centralized data model
- Agency analysts delivering monthly podcast performance decks to clients using Power BI as the standard reporting tool
- In-house content marketing teams at 50–1,000 person companies running a branded podcast as a lead-gen channel
- BI teams already standardized on Power BI who want a podcast-shaped dataset they can extend with their own DAX
❌ This template is NOT for:
- Networks needing real-time IAB-certified download dedupe at the feed level — use Podtrac or ArtDetect instead
- Teams without Power BI Desktop installed who prefer spreadsheets — use the Podcast Analytics Dashboard in Excel instead
- Podcasters who want fully automated API ingestion from Spotify or Apple — this template uses paste-and-refresh data updates
⚙️ How to Use the Podcast Analytics Dashboard in Power BI
- Download and unzip the file after purchase — the .pbix opens in Power BI Desktop 2.100 or later (free from Microsoft).
- Open Power Query via Transform Data and review the source table columns (platform, category, podcast name, host, season, status, distribution channel, downloads, streams, revenue, production cost, listener rating, episodes, subscribers, unique listeners, month).
- Replace the sample dataset with your own export from Spotify for Podcasters, Apple Podcasts Connect, or YouTube Studio in the same column structure.
- Click Refresh on the Home ribbon. Every DAX measure, KPI card, and visual recalculates instantly.
- Use the cross-page slicers on each report page to filter by platform, category, host, season, distribution channel, status, or month.
- Optionally publish the report to Power BI Service to share with stakeholders via web browser or the Power BI mobile app.
💼 Real-World Use Cases
Maya runs a 3-show indie podcast network. Each Monday she pastes the week’s Spotify and Apple exports into the Power Query source table, hits Refresh, and reviews which show had the highest Net Profit, which host pulled the best Avg Listener Rating, and which season is tracking best on Profit Margin — all in under 15 minutes instead of paying $99/month for a podcast analytics SaaS.
Rahul leads content marketing at a B2B SaaS company. He uses the Podcast Analytics Dashboard in Power BI to report podcast ROI to his CMO, specifically the Total Revenue and Total Production Cost by Platform chart to prove that the YouTube podcast arm is outperforming the Spotify-only arm on margin — and publishes the .pbix to Power BI Service so the CMO can drill in herself between meetings.
Elena manages 12 client podcasts at a creative agency. She duplicates the .pbix per client, swaps the source table, and uses the Profit Margin by Season and Total Subscribers Gained by Distribution Channel views to anchor her quarterly retention conversations with each client.
❓ Frequently Asked Questions
What KPIs does the Podcast Analytics Dashboard in Power BI track?
The Podcast Analytics Dashboard in Power BI tracks 5 headline KPIs — Total Revenue, Total Production Cost, Net Profit, Total Episodes, and Avg Listener Rating — plus 12 supporting analyses across platform, category, podcast name, host, season, status, distribution channel, and month dimensions.
How long does the Podcast Analytics Dashboard in Power BI take to set up?
Setup for the Podcast Analytics Dashboard in Power BI typically takes under 10 minutes. Replace the sample rows in Power Query with your own podcast export in the same column structure, click Refresh on the Home ribbon, and every DAX measure, KPI card, and chart recalculates automatically.
How does the Podcast Analytics Dashboard in Power BI compare to Chartable or Podtrac?
The Podcast Analytics Dashboard in Power BI is a one-time $17.99 purchase with full data ownership and fully editable DAX measures. Chartable and Podtrac are subscription SaaS tools priced at $40–$300 per month that offer real-time feed tracking but lock your data and analytics logic inside their platform.
Do I need a Power BI Pro license to use this dashboard?
No. The Podcast Analytics Dashboard in Power BI opens, edits, and refreshes entirely inside the free Power BI Desktop application. A Power BI Pro license is only required if you want to publish the report to Power BI Service for online sharing with other users.
Can I add my own DAX measures to the Podcast Analytics Dashboard?
Yes. The data model is fully unprotected. You can write additional DAX measures in the Modeling pane, build new visuals on any page, and connect them to the existing slicers via the Edit Interactions menu. The model uses standard star-schema design.
Where can I export my podcast data from to load into this Power BI template?
The Podcast Analytics Dashboard in Power BI accepts data exported from any podcast host. Common sources include Spotify for Podcasters, Apple Podcasts Connect, YouTube Studio, Buzzsprout, and Libsyn. The Microsoft Learn guide on connecting Power BI Desktop to CSV files walks through the standard import process.
👤 About the Author
Built by PK — Microsoft Certified Professional with 15+ years of Excel, Google Sheets, and Power BI experience. Founder of NextGenTemplates, reaching 300K+ subscribers across YouTube channels (@PK-AnExcelExpert, @NextGenTemplates, @NeoTechNavigators). Every template is hand-built and tested before release.
🔗 Explore Related Templates
🔹 Podcast Analytics Dashboard in Excel — Also available as: the Excel sibling of this report for teams who prefer spreadsheets over Power BI.
🔹 Content Creator Revenue Dashboard in Power BI — Track monetization across YouTube, podcasts, sponsorships, and courses in one Power BI report.
🔹 Podcast Platforms Dashboard in Power BI — Platform-by-platform comparison of Spotify, Apple, YouTube, and Amazon Music performance.
🔹 Audio Streaming Services Dashboard in Power BI — Track Spotify, Apple Music, and streaming revenue alongside podcast performance.
🔹 Browse the complete Power BI Dashboards catalog for more role-specific Power BI reports.
📖 Click here to read the Detailed Blog Post
🎥 Visit our YouTube channel for step-by-step video tutorials
👉 YouTube.com/@NextGenTemplates
📅 Last updated: April 2026


Reviews
There are no reviews yet.