


Overview of the HVAC Service Dashboard in Excel
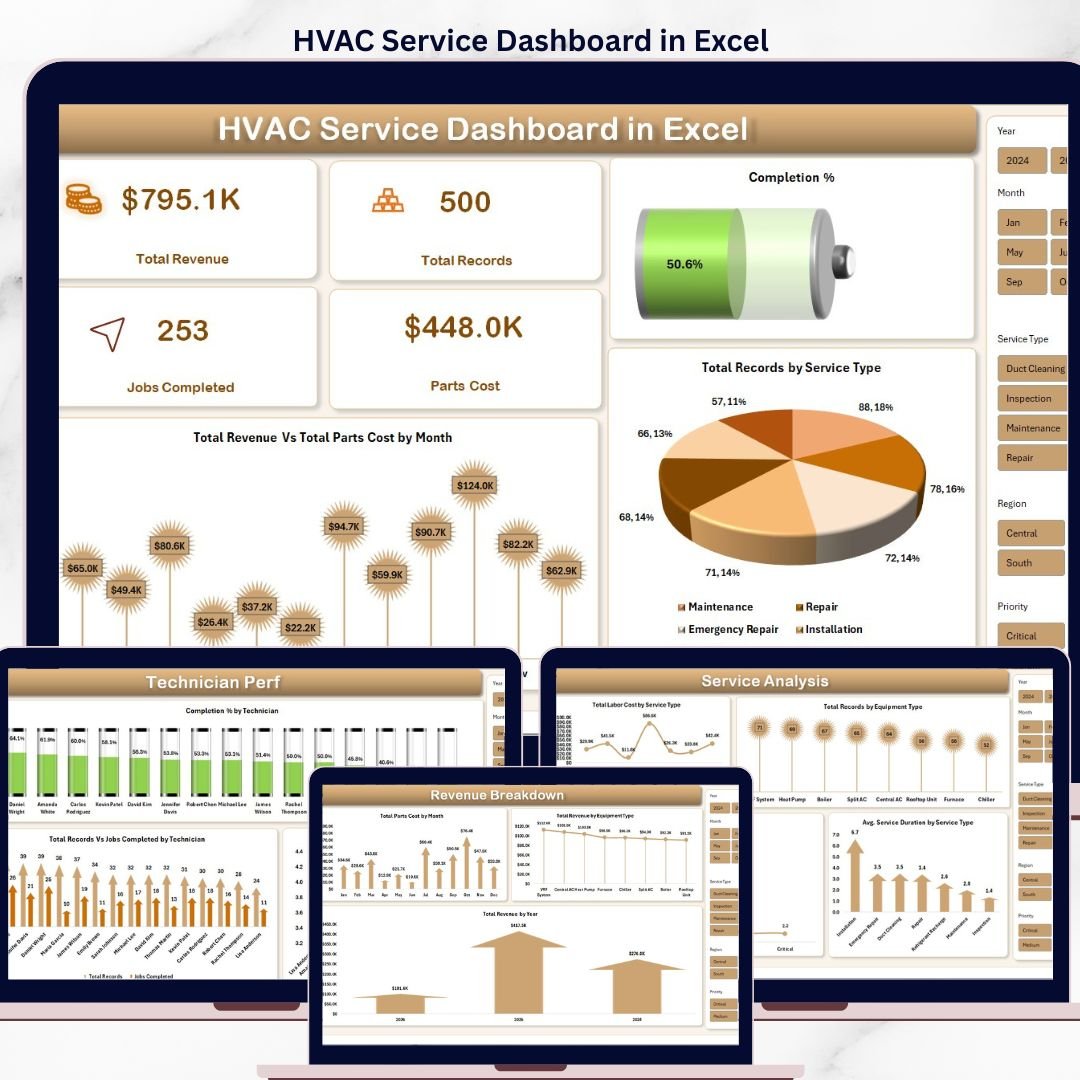
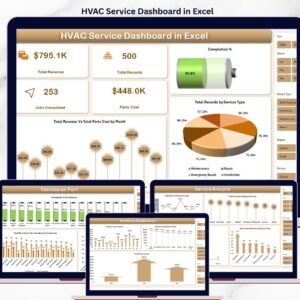
The HVAC Service Dashboard in Excel is a complete service operations analytics template built for HVAC companies, facility maintenance teams, and field service managers. It converts raw service call logs into clear KPIs — Total Revenue, Jobs Completed, Completion %, Parts Cost, Technician Productivity, and Regional Net Profit — so dispatchers, service supervisors, and business owners can make faster, data-backed decisions. Everything runs on Microsoft Excel with pivot tables, slicers, and a clean multi-tab layout — no VBA, no add-ins, no subscriptions. Just paste your service data into the Data Sheet, click Refresh All, and the entire dashboard updates.
This template covers the five most important views an HVAC service business needs: an Overview of revenue and completion, a Service Analysis page for service-type and equipment-type performance, a Technician Performance page for workforce productivity, a Regional Insights page for geographic profitability, and a Revenue Breakdown page for monthly and yearly income trends.
Dashboard Pages & Chart Details
1. Overview Page
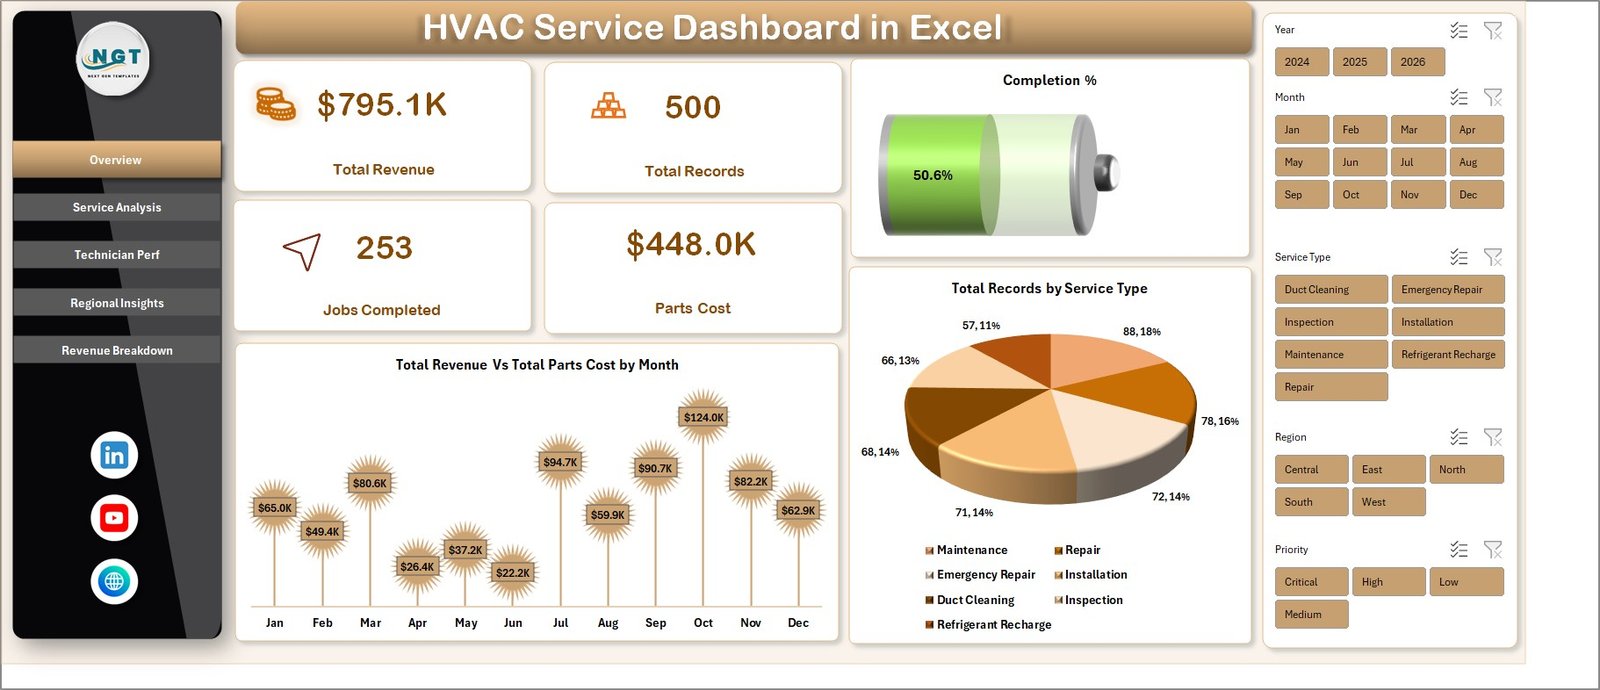
The Overview page gives a high-level snapshot of your entire HVAC service operation. KPI cards at the top display Total Revenue, Total Records, Jobs Completed, Parts Cost, and Completion %. Interactive slicers let you filter the full dashboard by service type, region, technician, or time period in a single click. The page includes these charts:
- Total Revenue Vs Total Parts Cost by Month — a combo chart comparing monthly revenue against parts cost so you can spot margin pressure and seasonal swings at a glance.
- Total Records by Service Type — a column chart showing job volume across installation, repair, maintenance, inspection, and emergency calls to identify your highest-demand service categories.
2. Service Analysis
The Service Analysis page drills into operational performance by service category and equipment. It helps service managers identify where response times slip and which services consume the most labor. Charts include:
- Total Labor Cost by Service Type — shows which service categories are driving the biggest labor spend.
- Total Records by Equipment Type — highlights demand across AC units, furnaces, heat pumps, boilers, and ventilation systems.
- Avg. Response Time by Priority — compares how quickly your team responds to low, medium, high, and emergency calls.
- Avg. Service Duration by Service Type — reveals which job types take longest so you can refine scheduling and quoting.

3. Technician Perf
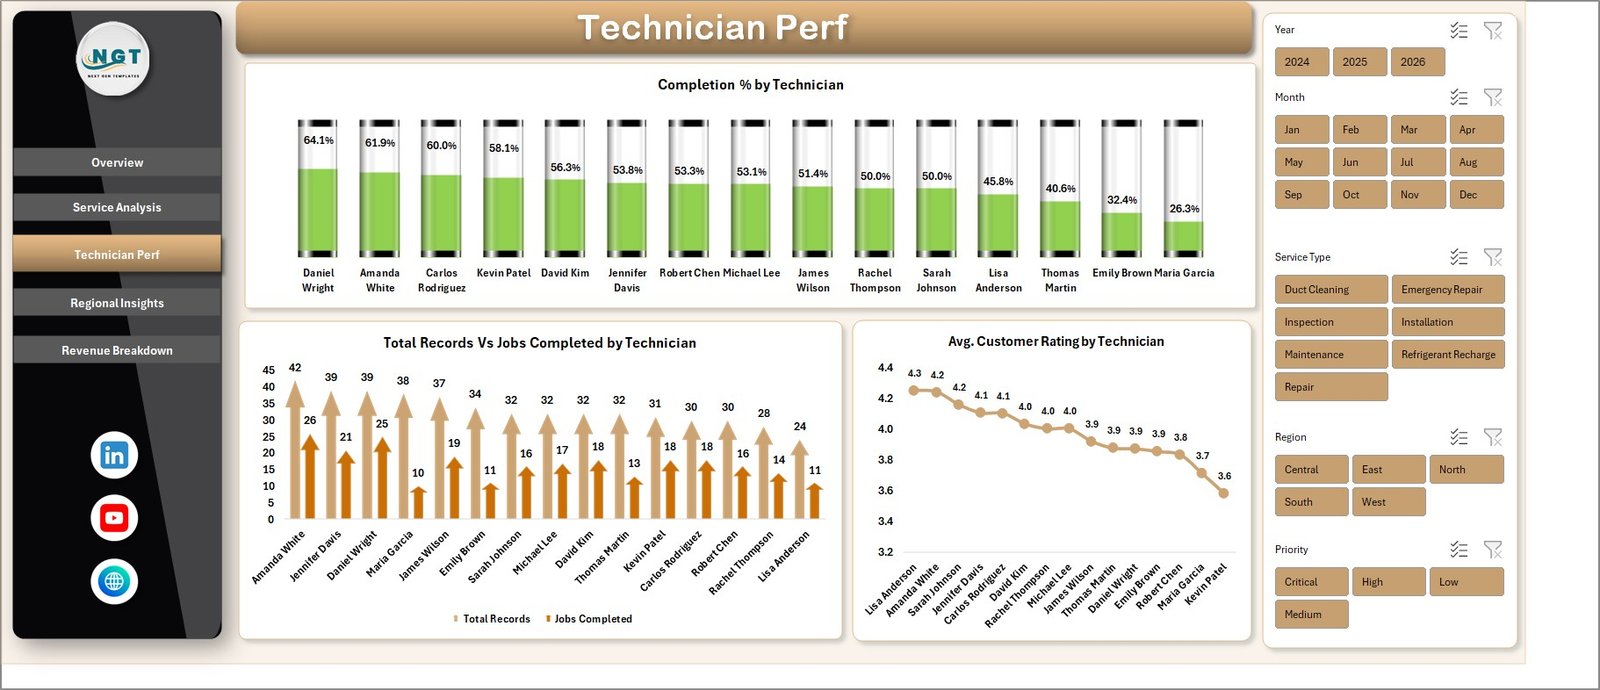
The Technician Performance page is built for service supervisors who need to monitor workforce productivity and customer experience technician-by-technician. Charts include:
- Completion % by Technician — job completion rate per technician to spot top performers and coaching opportunities.
- Total Records Vs Jobs Completed by Technician — side-by-side view of assigned work versus delivered work.
- Avg. Customer Rating by Technician — customer satisfaction score per technician for service quality reviews.
4. Regional Insights
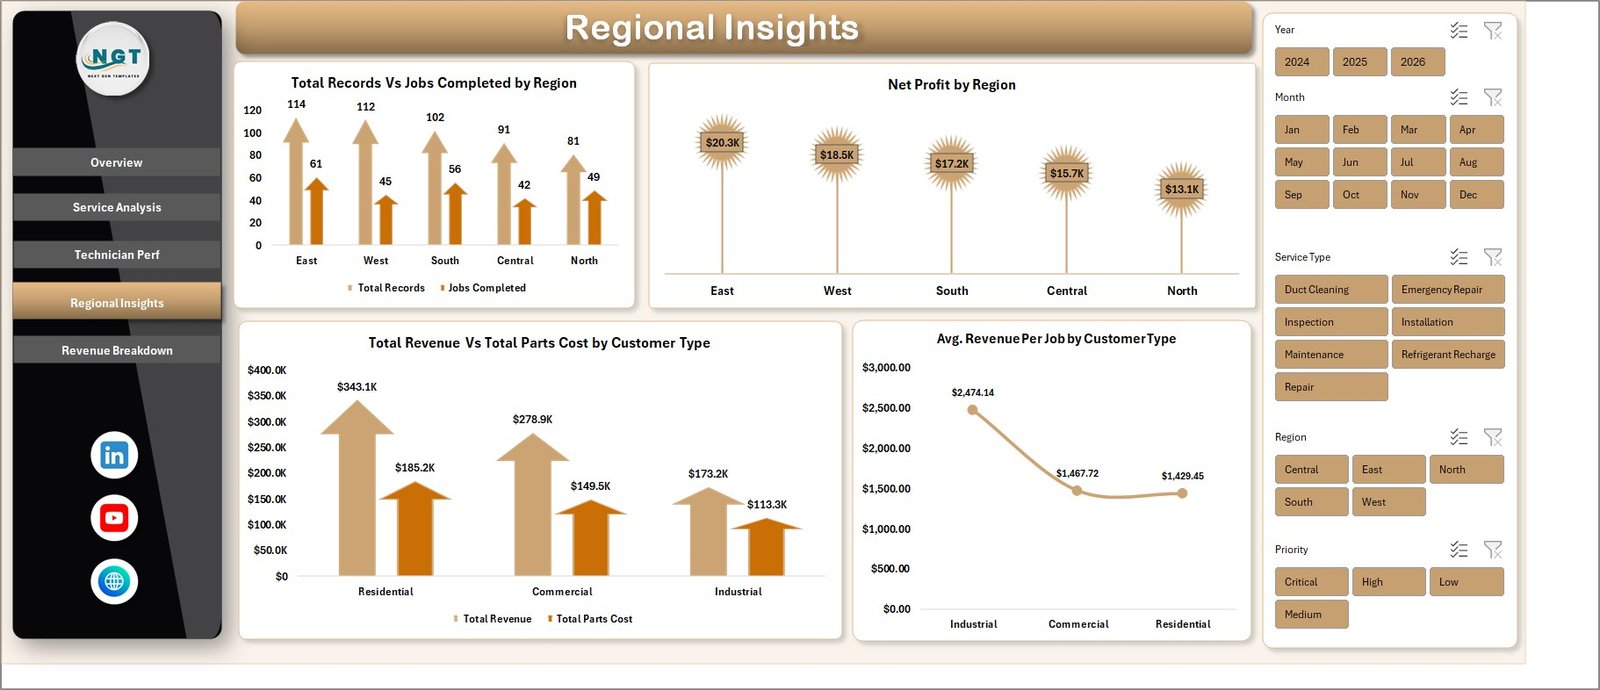
The Regional Insights page reveals which service areas and customer segments drive the most profit. It helps you plan territory expansion, pricing, and dispatch zones. Charts include:
- Total Records Vs Jobs Completed by Region — regional workload versus delivery performance.
- Net Profit by Region — profitability ranking across all service territories.
- Total Revenue Vs Total Parts Cost by Customer Type — compares revenue and parts spend across residential, commercial, and industrial customers.
- Avg. Revenue Per Job by Customer Type — identifies which customer segment delivers the highest average ticket.
5. Revenue Breakdown
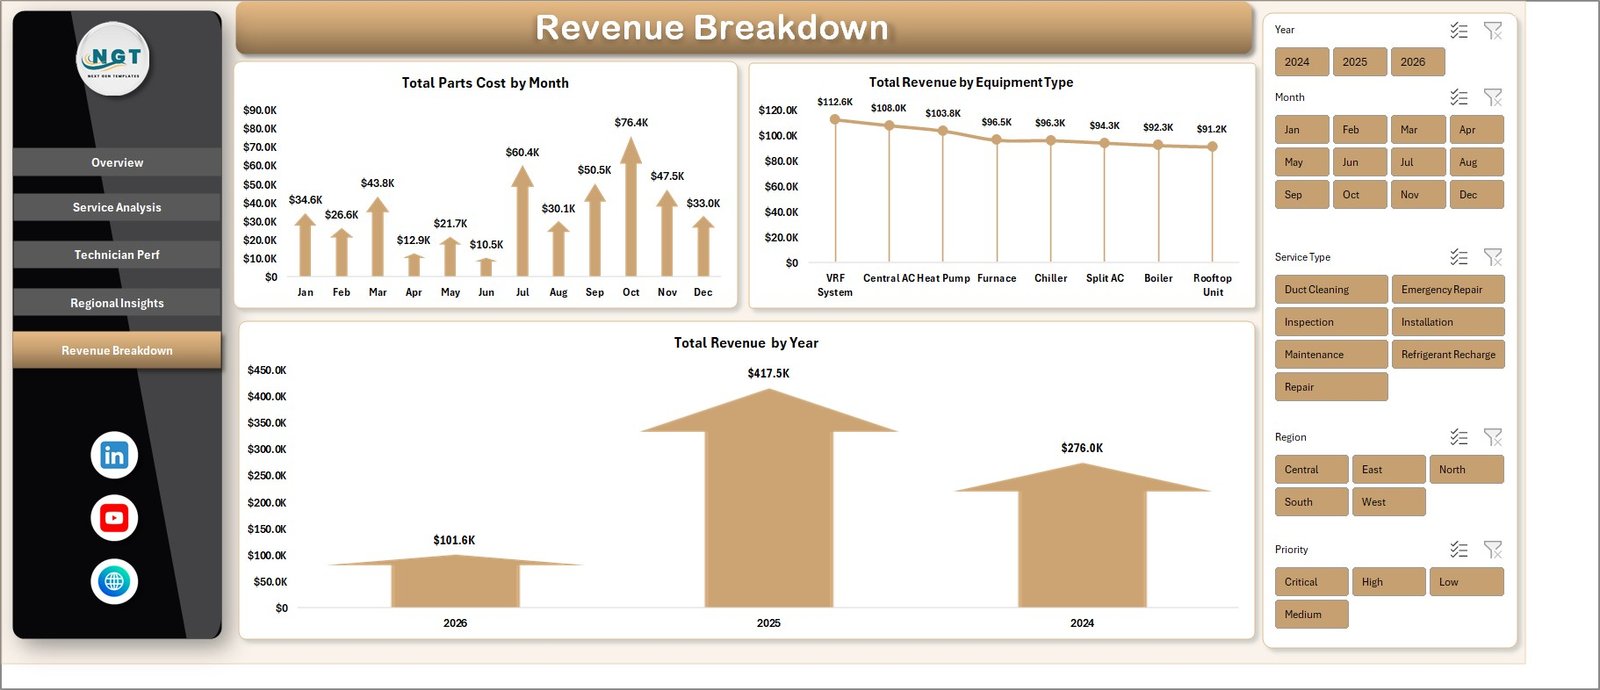
The Revenue Breakdown page gives finance and owners a clear view of income trends over time and across equipment categories. Charts include:
- Total Parts Cost by Month — monthly parts consumption to help with inventory planning and vendor negotiations.
- Total Revenue by Equipment Type — which equipment categories generate the most revenue.
- Total Revenue by Year — year-over-year revenue trend for growth tracking.
6. Data Sheet Tab
The Data Sheet is where you paste or type your HVAC service call records. Keep the same column order and format — the dashboard reads directly from this sheet. Fields include Service ID, Date, Service Type, Equipment Type, Technician, Region, Customer Type, Priority, Response Time, Service Duration, Labor Cost, Parts Cost, Revenue, Completion Status, and Customer Rating.

7. Support Sheet
The Support Sheet contains all the pivot tables that power the dashboard charts dynamically. After updating the Data Sheet, go to the Data tab on the Excel ribbon and click Refresh All — every pivot and chart refreshes instantly. You can hide this sheet from end users to keep the workbook clean.

Who Is This HVAC Dashboard For?
This dashboard is built for HVAC service companies, commercial HVAC contractors, facility maintenance teams, field service managers, dispatch coordinators, and multi-location service operations. If you track service calls in a spreadsheet or export data from a field service CRM like ServiceTitan, Housecall Pro, Jobber, or FieldEdge, you can paste that data here and immediately see technician productivity, regional profit, and revenue trends without rebuilding reports from scratch.
Why Choose This Template?
We specialize in ready-to-use Excel dashboards for service-based businesses. Every template we ship is tested, pivot-driven, and designed to load instantly on standard Excel. You can read the full walkthrough here: HVAC Service Dashboard in Excel – Full Walkthrough on PK – An Excel Expert.
For more HVAC and facility templates, browse our complete Excel Dashboard collection or explore the KPI Dashboard library. If you prefer a BI platform, check the Power BI Dashboard
- 📊 Track your entire HVAC business in one dashboard – revenue, jobs, cost, and performance in real-time
- 👨🔧 Monitor technician productivity easily – identify top performers and improvement areas
- 🌍 Analyze regional profitability – know exactly where you’re making or losing money
- ⚡ One-click data refresh – update everything instantly without manual work
- 🎯 Interactive filters & slicers – drill down by technician, region, or service type
- 📈 Professional charts & visuals – make better decisions with clear insights
- 🧩 No complex formulas needed – built using powerful pivot tables
- 📁 Ready-to-use Excel template – just paste your data and start analyzing
- 💼 Perfect for HVAC & service businesses – adaptable to multiple industries
Frequently Asked Questions
Q1. Which Excel version is required for this HVAC Service Dashboard?
The template works on Microsoft Excel 2016, 2019, 2021, and Microsoft 365 on both Windows and Mac. No VBA macros are used, so enterprise security policies won’t block it.
Q2. How do I update the dashboard with my own HVAC service data?
Open the Data Sheet tab, replace the sample data with your own service records in the same column order, then go to the Data ribbon and click Refresh All. Every pivot, chart, and KPI card updates automatically.
Q3. Can I add my company logo and brand colors?
Yes. The workbook is fully unlocked. You can replace the logo, change theme colors, rename sheets, and add your own KPIs without breaking formulas.
Q4. Does this work for residential HVAC, commercial HVAC, or both?
Both. The Regional Insights page includes a Customer Type dimension so you can analyze Residential, Commercial, and Industrial accounts side by side.
Q5. Can I use this for other field service trades like plumbing or electrical?
Yes. Because the Data Sheet uses generic service fields — Service Type, Equipment Type, Technician, Region — you can repurpose the template for plumbing, electrical, elevator, or general facility maintenance by renaming a few categories.
Q6. Is this a one-time purchase or a subscription?
One-time purchase. You get lifetime access to the file, free bug fixes, and the right to use it for unlimited projects inside your company.
Watch the step-by-step video tutorial:




























Reviews
There are no reviews yet.