

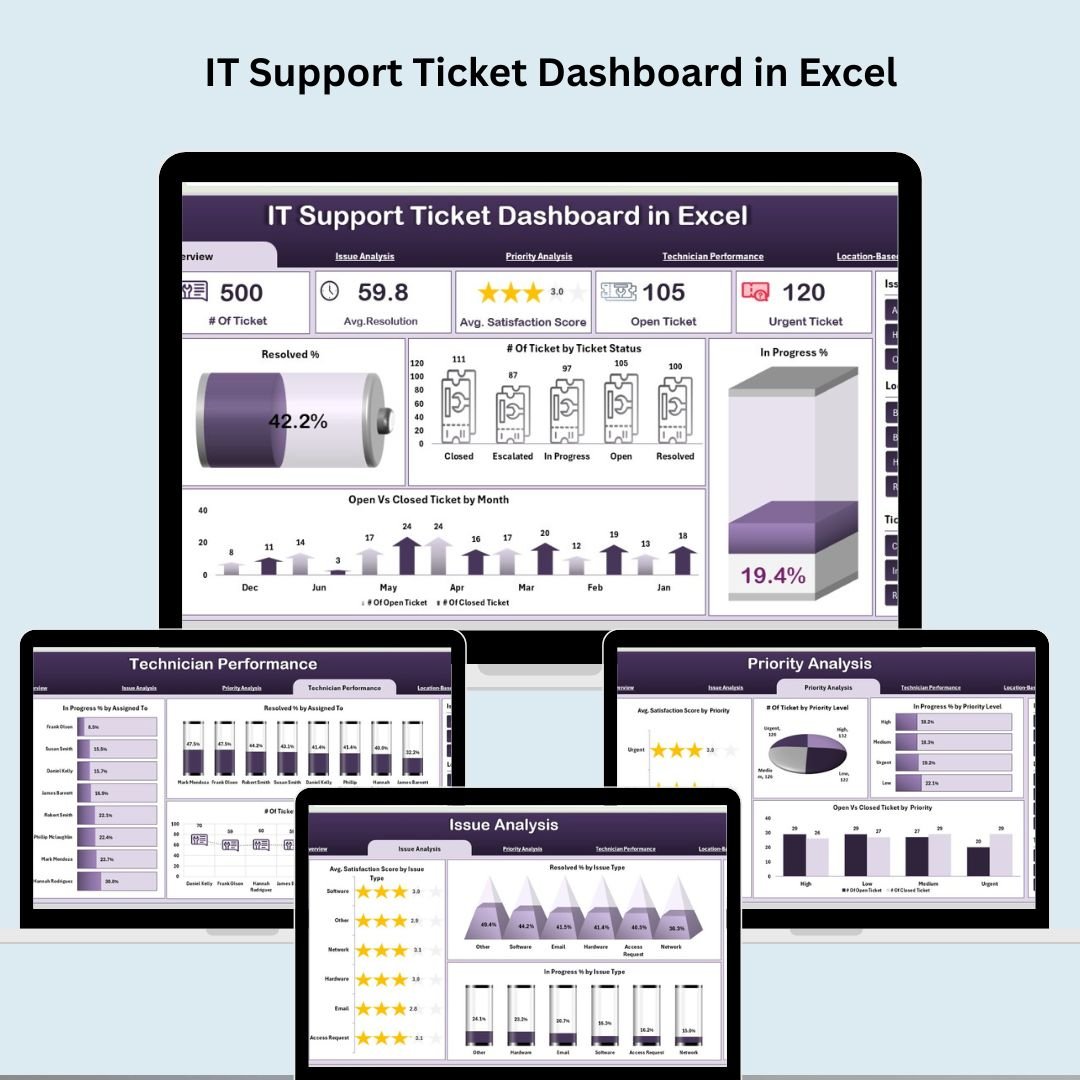

Stop guessing and start managing your IT support operations with precision! The IT Support Ticket Dashboard in Excel is a powerful, plug-and-play tool designed to help IT teams, support managers, and service departments track tickets, analyze performance, and boost customer satisfaction—all in real-time.
Whether you’re struggling with unresolved issues or juggling multiple support requests, this dashboard helps you stay organized, prioritize smartly, and ensure timely resolutions with visual clarity.
⚙️ Key Features of the IT Support Ticket Dashboard
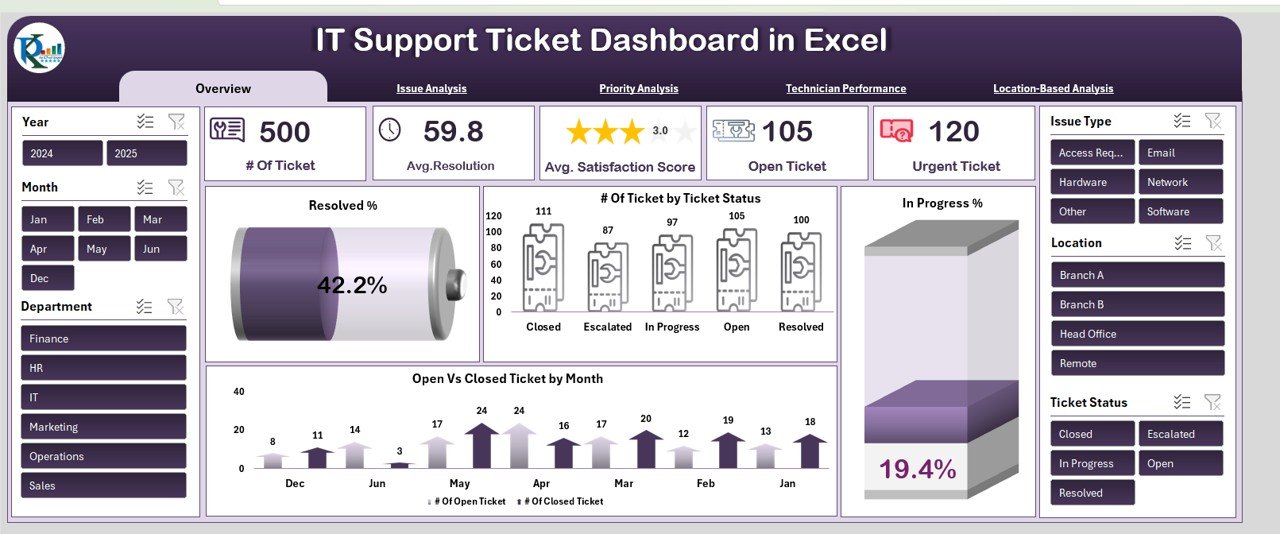
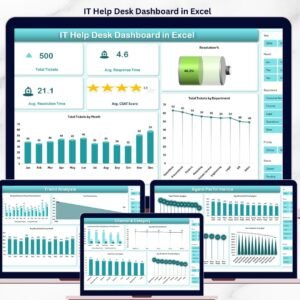
📊 Overview Dashboard
Get a real-time visual snapshot of:
Total Tickets
Avg. Resolution Time (Hrs)
Avg. Satisfaction Score
Open & Urgent Tickets
Includes interactive charts like:
✅ Resolved %
⏳ In Progress %
📅 Open vs Closed by Month
📌 Ticket Status Breakdown
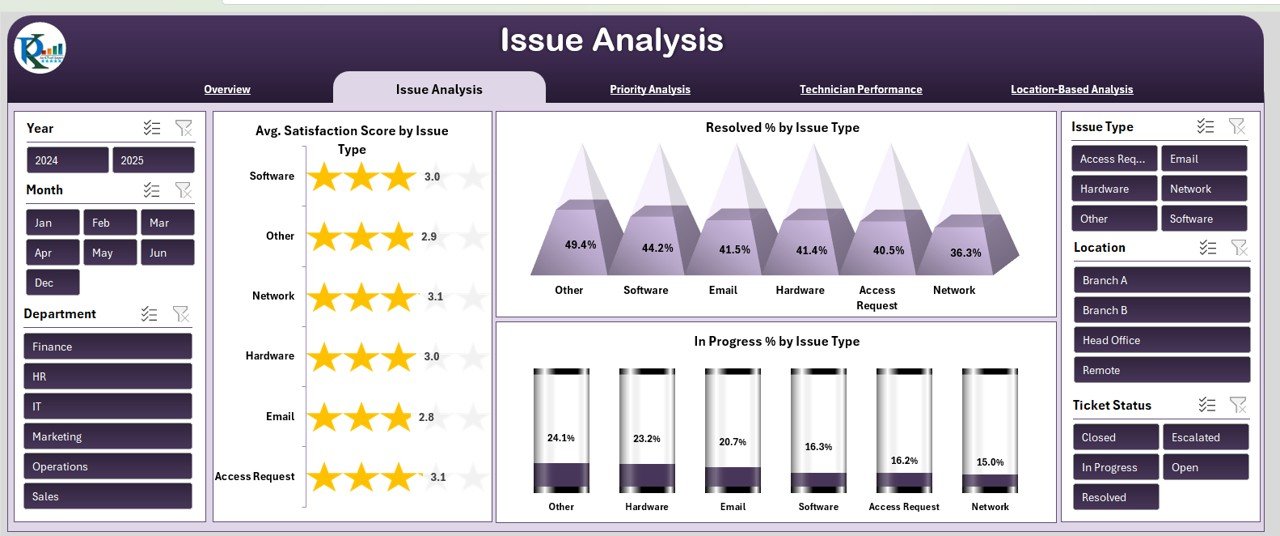
🔍 Issue Analysis Tab
Identify recurring problems and improve service quality.
Visuals include:
Avg. Satisfaction Score by Issue Type
Resolved % and In Progress % by Issue Type
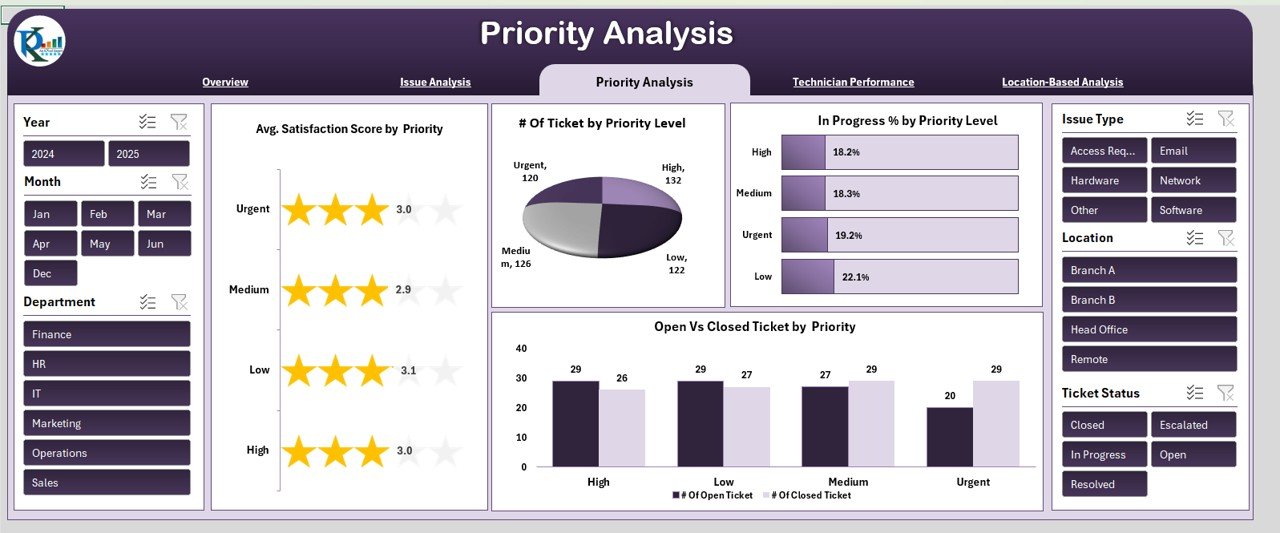
⚠️ Priority Analysis Tab
Optimize your workload by priority levels.
Charts show:
Satisfaction Score by Priority
Open vs Closed by Priority
In Progress % by Priority
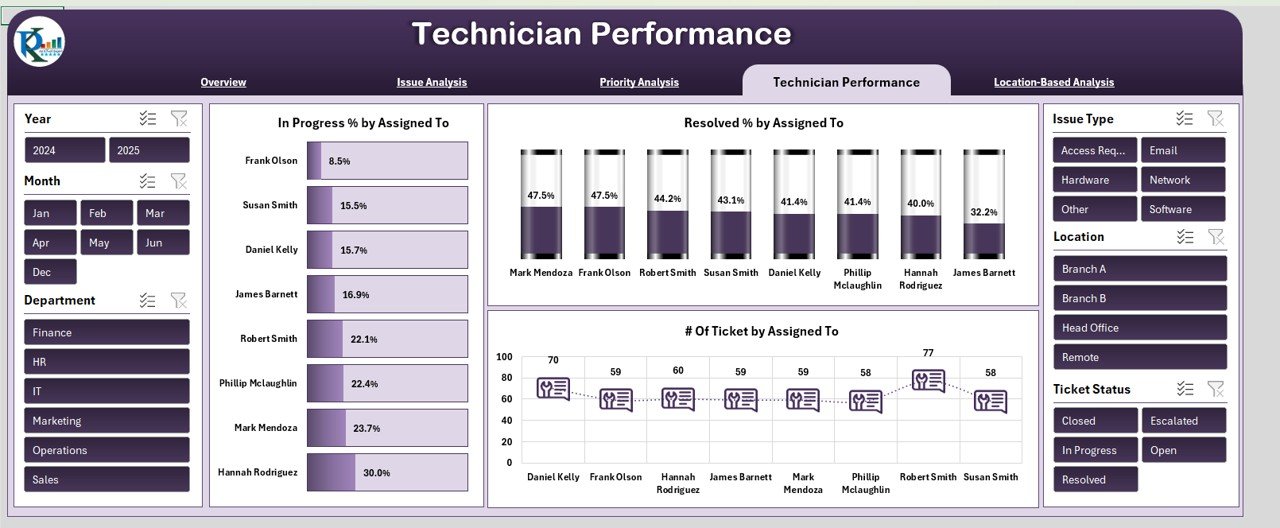
👨🔧 Technician Performance Tab
Track how well each technician performs.
View:
Resolved % and In Progress % by Technician
Ticket Load per Technician
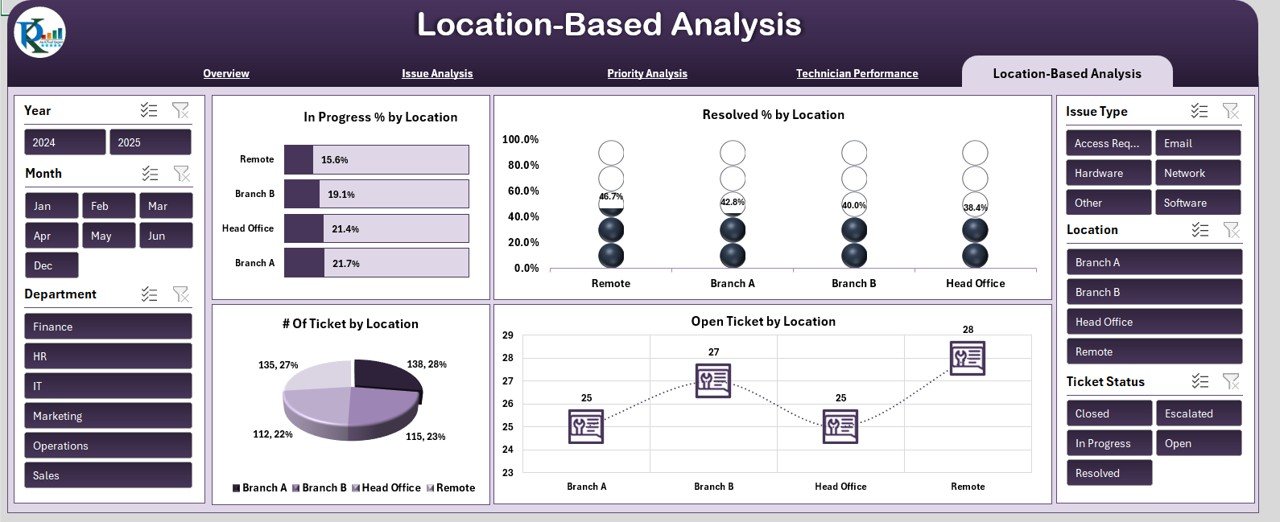
🌍 Location-Based Analysis Tab
Understand how IT support varies by region.
Includes:
Resolved & In Progress % by Location
Open Tickets and Total Tickets by Location
📁 Data Entry Sheet
Enter ticket data here and let the dashboard handle the rest.
Fields include:
Ticket ID, Date, Issue Type, Priority, Technician, Resolution Time, Satisfaction Score, and more.
📦 What’s Inside the IT Support Ticket Dashboard
You get access to 6 interactive, auto-updating worksheet tabs:
Overview – KPI Cards, Status Breakdown, Trend Charts
Issue Analysis – Performance insights by issue type
Priority Analysis – Compare ticket behavior by priority
Technician Performance – Analyze team member efficiency
Location-Based Analysis – Evaluate performance across locations
Data Sheet – Enter raw ticket data to drive the dashboard
All charts update in real-time based on the data you input!
🧑💼 How to Use the IT Support Ticket Dashboard
📝 Step 1: Input ticket data into the Data Sheet
🎯 Step 2: The dashboard updates automatically
📊 Step 3: Navigate tabs for detailed insights
📤 Step 4: Share PDF reports with your team
🔧 Step 5: Customize as per your IT environment
No coding. No formulas. Just clean, interactive visuals!
👥 Who Can Benefit from This Dashboard?
🧑💻 IT Support Teams – Track and resolve issues efficiently
🏢 IT Managers – Monitor staff performance and improve workflows
📞 Helpdesk Analysts – Identify bottlenecks and recurring issues
🛠️ MSPs & Outsourced IT Firms – Offer client-facing reporting
📊 Operations Leads – Align IT support with business outcomes
🏆 Why You’ll Love This Excel-Based Dashboard
✅ Fully customizable and Excel-powered
✅ Works offline or in Microsoft 365
✅ Zero learning curve—plug, update, analyze
✅ Clean visuals and slicers for quick filtering
✅ Real-time insight without any subscriptions
Whether you manage 20 tickets or 2,000—this dashboard will save time, improve performance, and help deliver top-tier IT support.
🔁 Click here to read the Detailed blog post
Click here to read the Detailed blog post
🎥 Visit our YouTube channel to learn step-by-step video tutorials
Watch the step-by-step video tutorial:
Compatibility and Requirements
- Works in Microsoft Excel desktop (Excel 2016 or later, or Microsoft 365).
- Filtering uses Excel slicers, and all six tabs update from the Data sheet.
- To learn how slicers filter data, see Microsoft’s guide Use slicers to filter data.
Frequently Asked Questions
Which KPIs are on the Overview tab?
Total tickets, average resolution time in hours, average satisfaction score and open and urgent tickets.
Can I see performance by technician?
Yes. The Technician Performance tab shows resolved % and in progress % by technician and the ticket load per technician.
What data do I enter?
Ticket ID, date, issue type, priority, technician, resolution time, satisfaction score and related fields on the Data sheet.
Can I compare locations?
Yes. The Location-Based Analysis tab shows resolved and in progress % and open and total tickets by location.
Related IT Support Templates
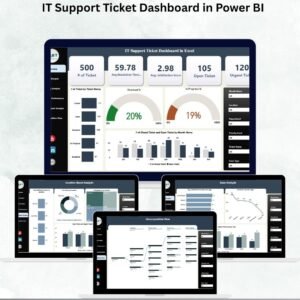
- IT Support Ticket Dashboard in Power BI: the same topic in Power BI
- IT Support Ticket Dashboard in Google Sheets: for teams on Google Sheets
- IT Support Ticket Report in Excel: a printable ticket report
- IT Help Desk Dashboard in Excel: another help desk view in Excel
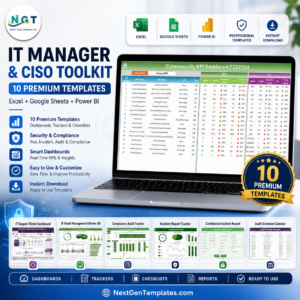
- IT Manager and CISO Toolkit: 10 IT templates in one bundle
Browse all Excel IT templates or the Excel dashboards.













Reviews
There are no reviews yet.