

SaaS Financial Model Dashboard in Google Sheets is a comprehensive, ready-to-use Google Sheets dashboard designed for SaaS founders, CFOs, finance teams, and startup operators who need to track Monthly Recurring Revenue (MRR), Annual Recurring Revenue (ARR), Customer Acquisition Cost (CAC), Lifetime Value (LTV), subscription status, and cash flow — all from a single interactive spreadsheet 📊💰. This powerful template includes 4 dynamic dashboard pages, a search page, and a structured data sheet that auto-updates with your own SaaS data.
Running a SaaS business without centralized financial visibility leads to revenue leakage, unsustainable CAC ratios, and missed growth targets. The SaaS Financial Model Dashboard in Google Sheets eliminates these blind spots by transforming your raw subscription data into clear, actionable charts, KPI cards, and filterable analytics. This dashboard includes 4 interactive analysis pages and tracks 5 key performance indicators including Total MRR, Total ARR, Avg Lifetime Value, Avg CAC, and Total Customers.
 SaaS Financial Model Dashboard in Google Sheets
🔑 Key Features of SaaS Financial Model Dashboard in Google Sheets
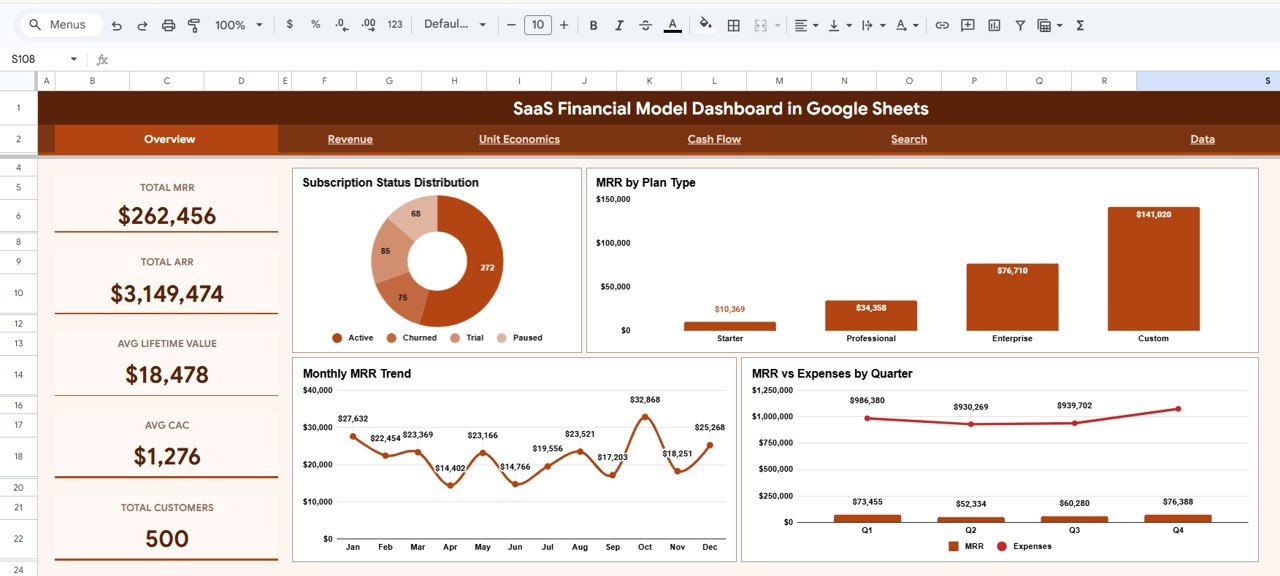
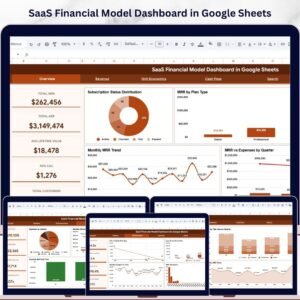
This Google Sheets dashboard delivers complete SaaS financial visibility across 4 interactive pages with dynamic charts and slicers. The Overview page displays 5 KPI cards — Total MRR, Total ARR, Avg Lifetime Value, Avg CAC, and Total Customers — alongside 4 analytical charts covering Subscription Status Distribution, MRR by Plan Type, Monthly MRR Trend, and MRR vs Expenses by Quarter. Built-in slicers enable instant filtering across all pages, allowing managers to drill down into specific plans, regions, industries, or time periods within seconds 🎯.
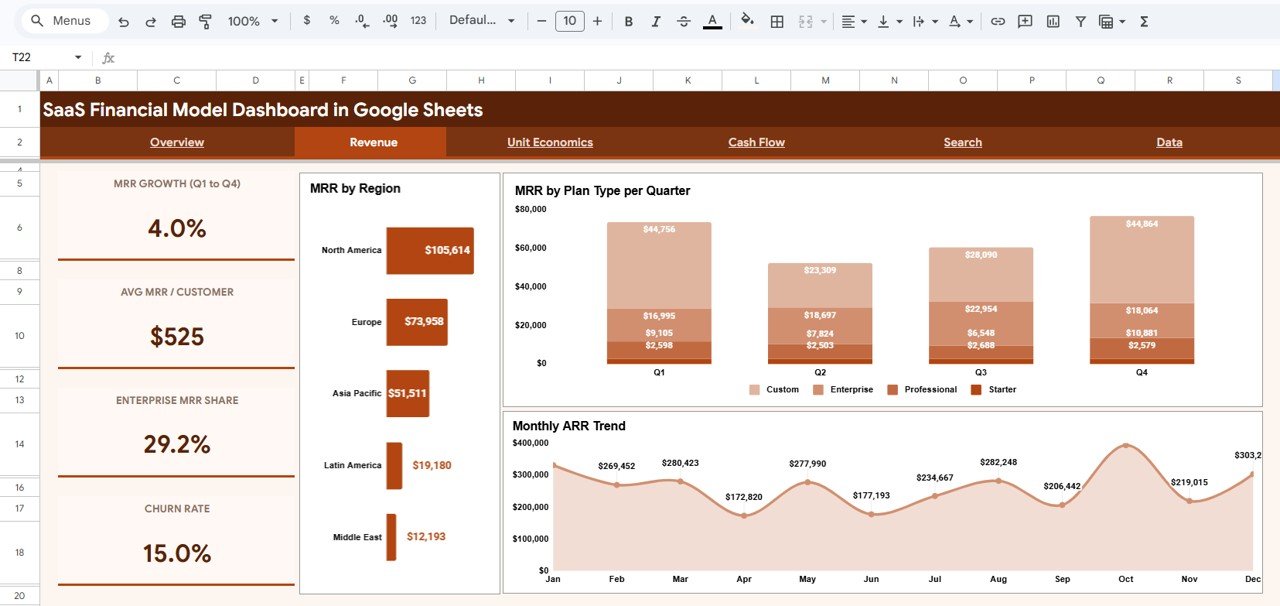
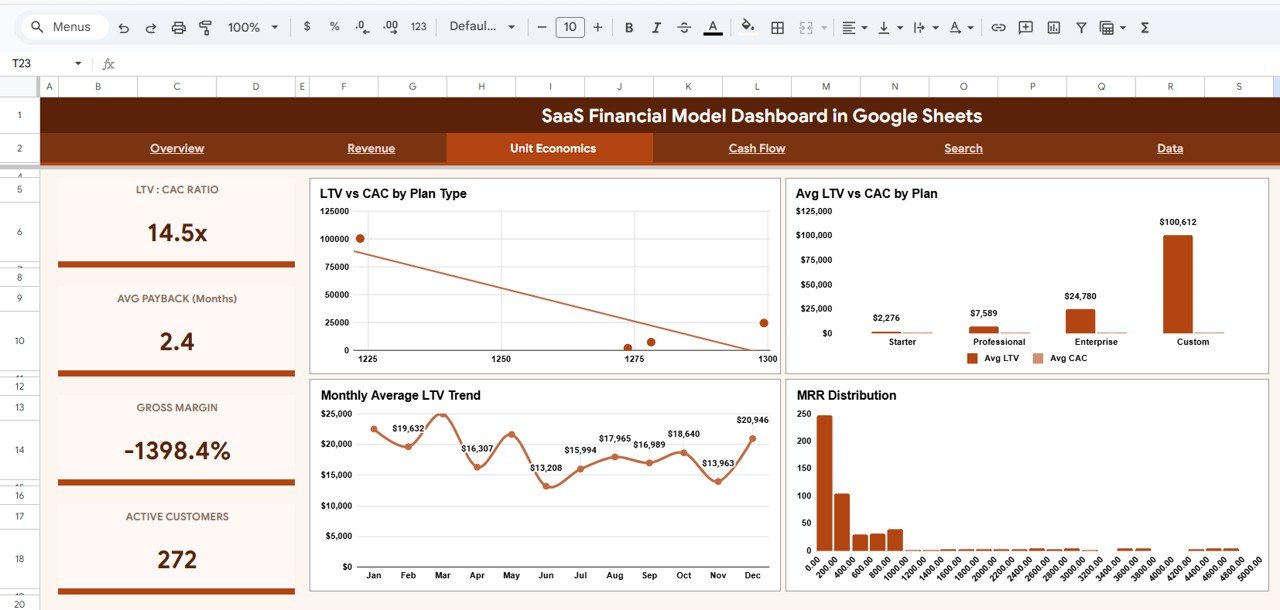
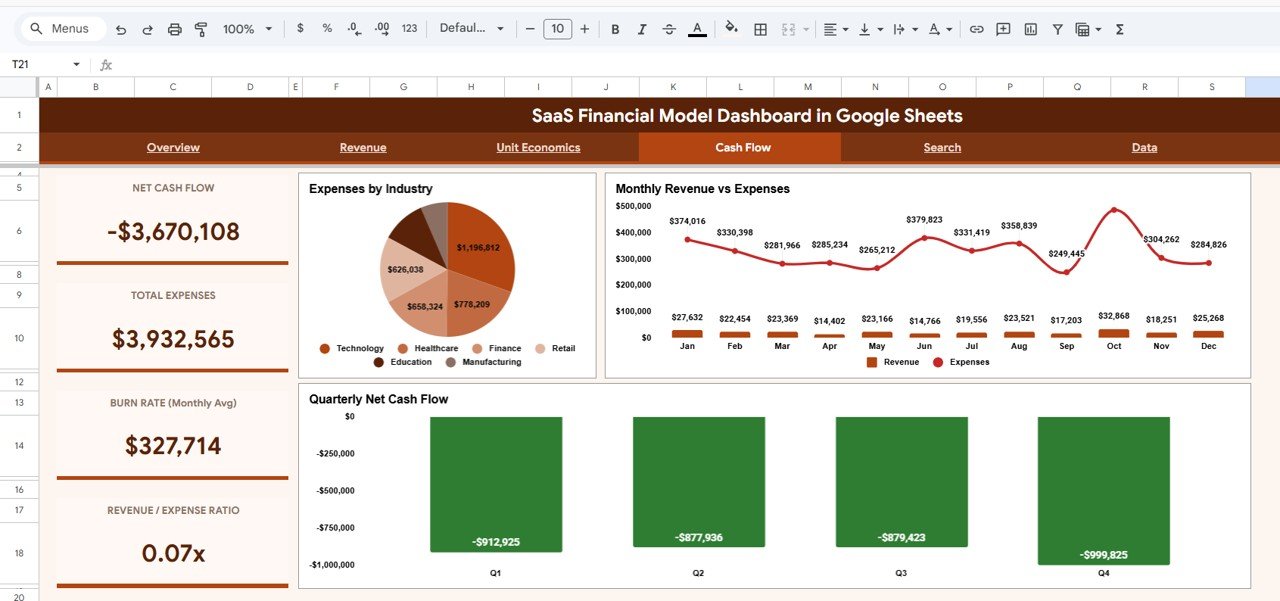
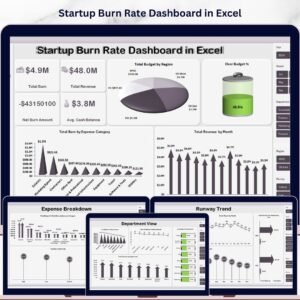
The Revenue page breaks down MRR by Region and MRR by Plan Type per Quarter, plus a Monthly ARR Trend line chart for tracking annualized growth. The Unit Economics page visualizes LTV vs CAC by Plan Type, Average LTV vs CAC comparisons, Monthly Average LTV Trend, and MRR Distribution by Range — essential for understanding customer profitability. The Cash Flow page tracks Expenses by Industry, Monthly Revenue vs Expenses, and Quarterly Net Cash Flow 📈. Similar to our popular Startup Burn Rate Dashboard in Excel, this template gives you instant financial clarity.
📦 What’s Inside the SaaS Financial Model Dashboard
📌 Overview Page – 5 KPI cards (Total MRR, Total ARR, Avg LTV, Avg CAC, Total Customers) with Subscription Status Distribution, MRR by Plan Type, Monthly MRR Trend, and MRR vs Expenses by Quarter charts plus interactive slicers for instant filtering.
📌 Revenue Page – MRR by Region breakdown, MRR by Plan Type per Quarter stacked analysis, and Monthly ARR Trend line chart for tracking annualized revenue growth.
📌 Unit Economics Page – LTV vs CAC by Plan Type comparison, Avg LTV vs CAC by Plan, Monthly Average LTV Trend, and MRR Distribution by Range histogram for profitability analysis.
📌 Cash Flow Page – Expenses by Industry breakdown, Monthly Revenue vs Expenses trend comparison, and Quarterly Net Cash Flow bar chart for cash management.
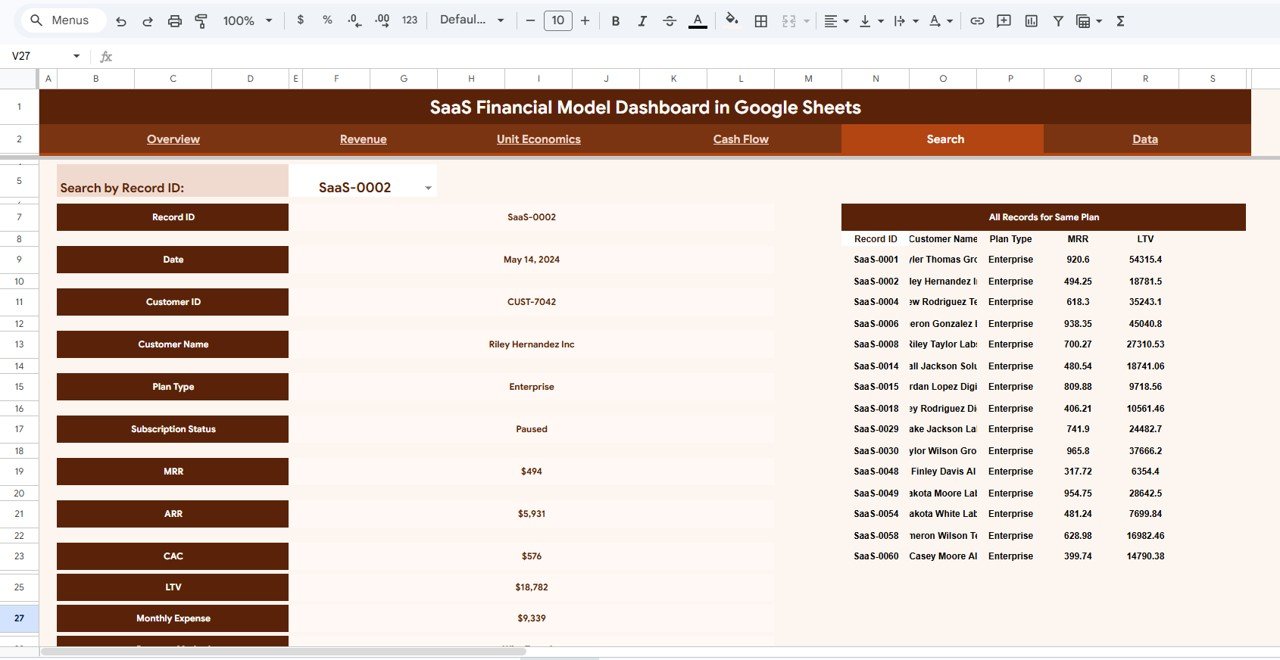
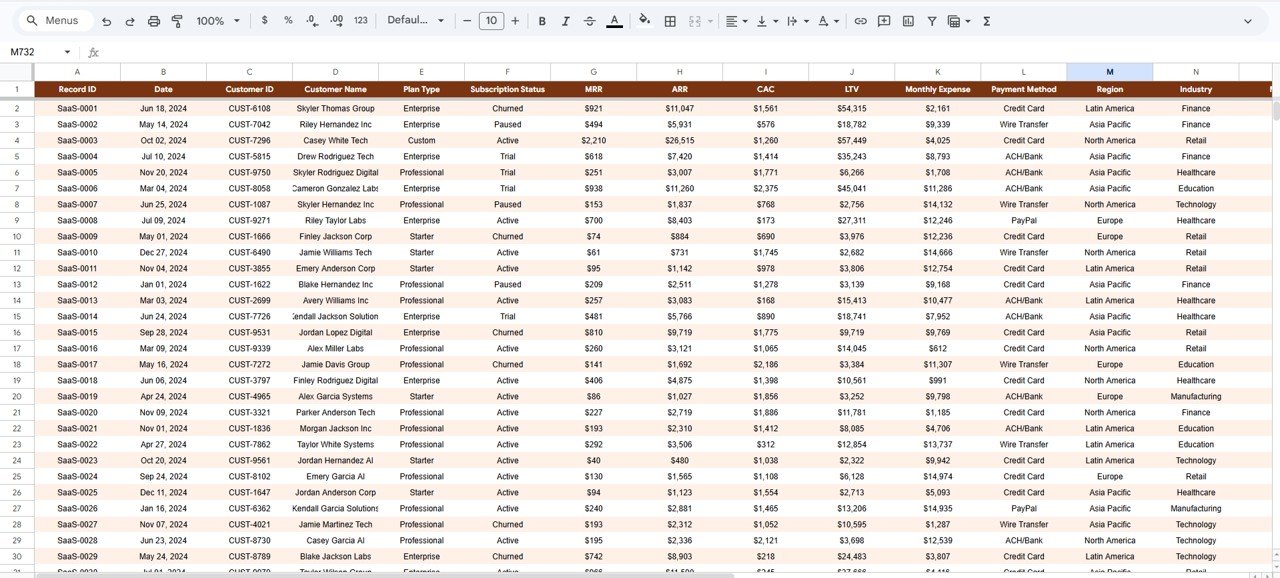
📌 Search Page – Search by Record ID to view complete details including Customer ID, Customer Name, Plan Type, Subscription Status, MRR, ARR, CAC, LTV, and Monthly Expense. Also displays all records sharing the same Plan Type for quick comparison.
📌 Data Sheet – Structured data entry sheet with sample SaaS subscription records. Replace with your own data and all dashboards auto-update instantly.
⚙️ How to Use the SaaS Financial Model Dashboard
1️⃣ Open the PDF guide included in your download — it contains the Google Sheets copy link.
2️⃣ Click the link to create your own editable copy in Google Drive.
3️⃣ Navigate to the Data sheet and replace sample data with your actual SaaS subscription records.
4️⃣ Return to the Overview page — all KPI cards, charts, and slicers update automatically.
5️⃣ Use slicers to filter by Plan Type, Region, Industry, or Subscription Status for targeted analysis.
6️⃣ Use the Search page to look up individual customer records by Record ID.
👥 Who Can Benefit from This Dashboard
🔹 SaaS Founders & CEOs – Track MRR, ARR, and customer growth at a glance.
🔹 CFOs & Finance Teams – Monitor cash flow, expenses, and budget compliance.
🔹 Startup Operators – Analyze unit economics, LTV/CAC ratios, and plan profitability.
🔹 Investors & Board Members – Review SaaS health metrics for due diligence and reporting.
🔹 Product Managers – Understand subscription distribution and revenue by plan type.
🔹 Business Analysts – Dive into regional and industry-level revenue breakdowns.
❓ Frequently Asked Questions
What KPIs does the SaaS Financial Model Dashboard track?
The SaaS Financial Model Dashboard in Google Sheets tracks 5 key performance indicators: Total MRR (Monthly Recurring Revenue), Total ARR (Annual Recurring Revenue), Average Lifetime Value (LTV), Average Customer Acquisition Cost (CAC), and Total Customers. It also provides detailed analysis across revenue, unit economics, and cash flow dimensions.
Can I customize this Google Sheets SaaS dashboard with my own data?
Yes. Simply navigate to the Data sheet, replace the sample records with your own SaaS subscription data in the same column format, and all charts, KPI cards, and slicers will auto-update instantly. No formulas or macros need to be edited.
How does this template help track SaaS MRR and ARR in Google Sheets?
The dashboard calculates Total MRR and Total ARR from your subscription data and displays them as prominent KPI cards on the Overview page. The Revenue page provides MRR by Region, MRR by Plan Type per Quarter, and a Monthly ARR Trend chart so you can track annualized growth over time.
What is included on the Unit Economics page?
The Unit Economics page shows LTV vs CAC by Plan Type, Average LTV vs CAC comparisons, Monthly Average LTV Trend, and MRR Distribution by Range. These charts help SaaS teams understand customer profitability and identify which plans deliver the best return on acquisition spend.SaaS Financial Model Dashboard in Google Sheets
Do I need advanced Google Sheets skills to use this template?
No. This dashboard is designed for all skill levels. Simply copy the template to your Google Drive, replace the sample data with your own, and the entire dashboard updates automatically. No coding, scripting, or formula editing is required.SaaS Financial Model Dashboard in Google Sheets
Can I use this SaaS financial model for investor reporting?
Absolutely. The dashboard presents MRR, ARR, LTV/CAC ratios, cash flow, and subscription status in a clean, professional format that is ideal for board meetings, investor updates, and due diligence presentations.SaaS Financial Model Dashboard in Google Sheets
🔗 Explore Related Templates
🔹 Startup Burn Rate Dashboard in Excel – Track your startup’s runway, burn rate, and monthly expenses with dynamic Excel charts.
🔹 Construction Project Cost Dashboard in Google Sheets – Monitor project budgets, actual costs, and variance analysis in Google Sheets.
🔹 Dental Practice Dashboard in Google Sheets – Manage dental practice operations with revenue, patient, and appointment analytics.
Browse all Google Sheets Dashboard Templates on NextGenTemplates.com.
📖 Click here to read the Detailed Blog Post
Watch the step-by-step video tutorial:


Reviews
There are no reviews yet.